Scenario

A scenario specifies the mix of different users accessing web applications and hence executing different test scripts. The users may be grouped in different groups and have different user characteristics.

  • Scenario is the overall definition of a test.
  • Scenario may have one or more groups.
  • Each group consists of several virtual users executing a test script.

Login to Cavisson

Follow the below-mentioned steps to the login into the portal:

  1. Enter the following URL (http://hostname/LOAD TEST) and press ENTER. The Cavisson login window is displayed.
Figure 1: Login Page

2. Enter the Username and Password and click the Sign in The Load Test UI Home page is displayed.

Figure 2: UI Dashboard

Load test: The home page consists of a left panel and a right panel. The left panel contains menu to view details on all test runs, scenarios, data files, and automation. Using these menus, the user can access further sections and can perform various operations, such as compare test runs, generate reports, access various features of the web dashboard and executive dashboard, and so on. On the right panel, a summary of the important aspects is displayed, be it a release version, CPU usage, memory utilization, or alerts generated in the system.

Load Test-Landing Page

This section provides a summary of details of the following sections:

  • Recent Test Runs
  • Scenarios
  • Transaction Details
Figure 3: Right Pane

Let us discuss in details about them.


Recent Test Runs

It provides information about the test run numbers, scenario names, start date and time, test status (Passed, Failed, or running), and enables you to view the reports such as Performance and Summary.

Figure 4: Recent Test Runs
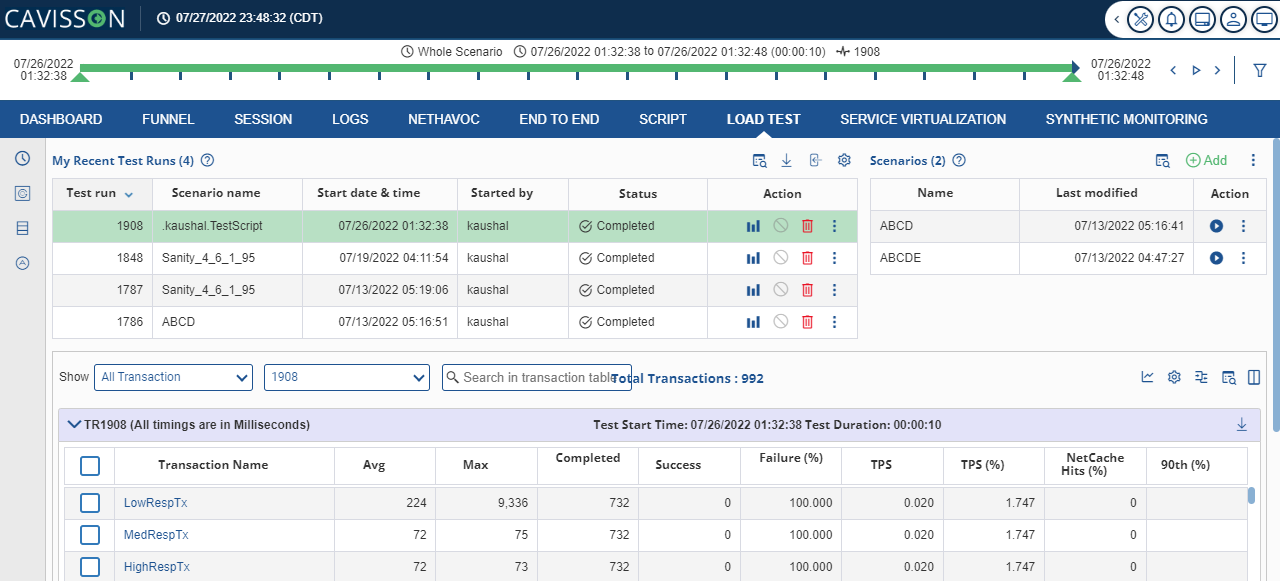
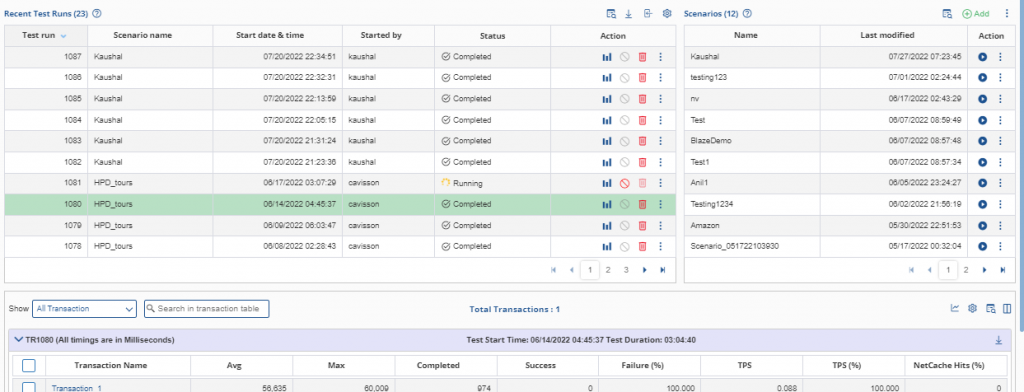
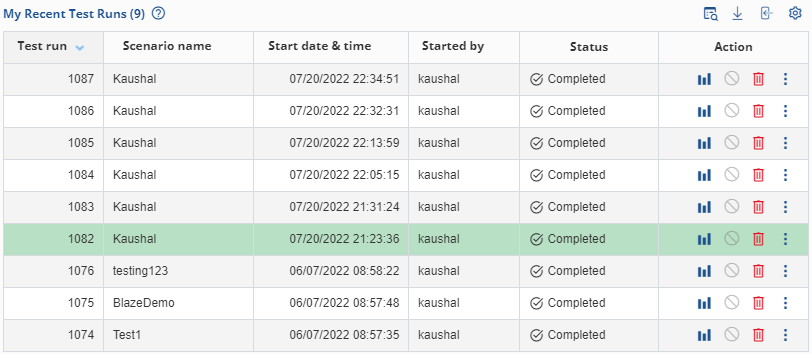
  • Test Run: Specifies the test number that is being executed.
  • Scenario Name: Specifies the scenario that is running.
  • Start Date and Time: Specifies the start date and time of test execution.
  • Started By: Species of the user who started the test.
  • Status: Displays the status (Passed, Failed, or Running) of the test being executed.
  • Action: Enables you to open the dashboard, stop test, delete test, export test and generate reports. It has following icons and options:
  • Dashboard : It opens the dashboard of a particular Test R
  • Delete: Use the icon to delete any test run.
  • Kebab Menu:
  • Performance Report: The Performance Report is categorized into Analysis Summary and Performance Summary. The Analysis Summary report contains details, such as overall analysis summary, executive summary, and statistics summary. The Performance Summary contains details, such as overview of the test, sessions, transactions, pages, network, and errors.
  • Summary Report: The Summary report provides summarized test information, such as test summary, transaction details, HTTP status code details, and other important information. Summary report contains some predefined sections and headers, which are more relevant.
  • Pass/Fail Report: The Pass/Fail report specifies the status of a test according to the check profile configuration.
  • Test Status Report: Shows the status of the est run, whether it is running and stopped.
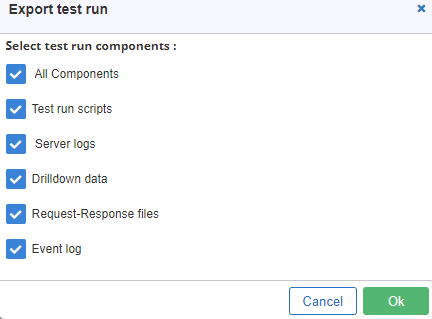
  • Export Test: Click this option to export the test run.
Figure 5: Export Test Run

You can either export the whole test run or just the some of the components.

Scenarios

A scenario specifies the mix of different users accessing a Web application and hence executing different test scripts. It consists of groups of Virtual users or VUsers, which emulate human users interacting with an application for executing a test script. The users can be grouped into different groups and have different user characteristics.

Figure 6: Scenarios
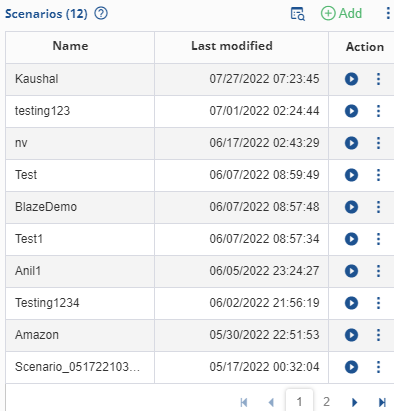
  • Name: Name of the scenario.
  • Last Modified: Update/modified date and time.
  • Action: Option like Start test, Export scenario, copy and delete are available.

Add Scenario

To create a new scenario, click the Add  button in Scenarios. The Scenario Configuration Wizard is displayed. For details refer to Create Scenario explained in above section.

Transactions Details

In this section, User can see transaction details of selected test run in Recent test run table. Below are the transaction table column descriptions:

  • Transaction Name: Specifies the name of the executed transactions in a Test Run.
  • Avg: Specifies the average time taken by a transaction in a Test Run.
  • Max: Specifies the maximum time taken by a transaction in a Test Run.
  • Completed: Specifies number of completed transactions in a Test Run.
  • Success: Specifies the number of successful transactions in a Test Run.
  • Failure (%): Specifies the transactions failure percentage in a Test Run.
  • TPS: Specifies the number of transactions completed per second in a Test Run.
  • TPS (%): Specifies the percentage of transactions per second in a Test Run.
  • Open Page Dump – Click this icon to see the page dump report.
  • Open Transaction Summary Report : This shows the transaction summary.
  • Show Dashboard On clicking this icon user can select following option for dashboard :
  • Show transaction in separate widget
  • Show transaction in same widget
  • Configuration This icon helps in the dashboard configuration.
  • Column Filter Click this icon to apply filter in columns.
  • Show/hide columns Click this icon to show or hide columns as per the requirement.
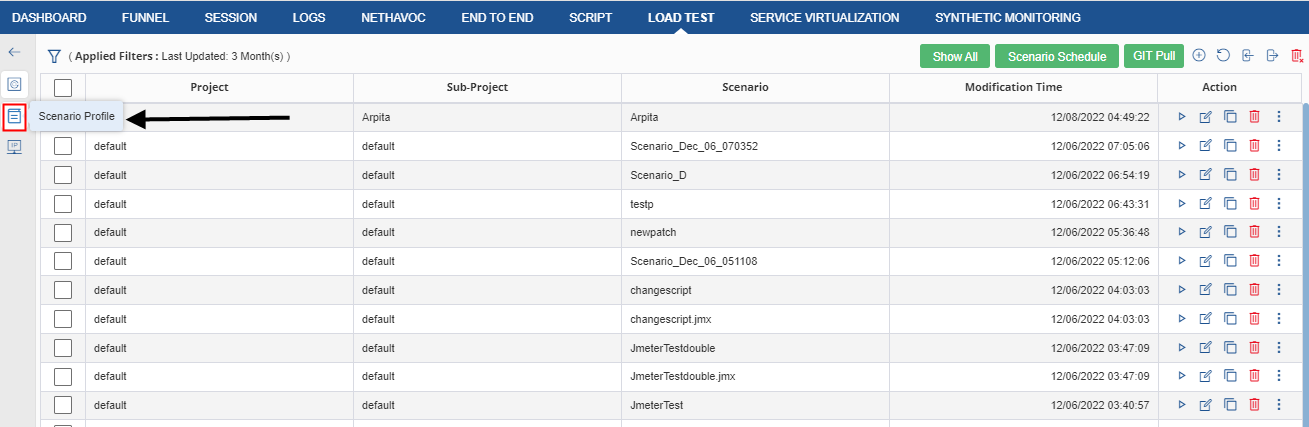
 

Left Menu

It contains the following menus/sub-menus, and menu items:

  • All Test Run
  • Scenarios
  • Data Files
  • Automation

All Test Run

Click  for all test runs details page. We get the following figure:

Figure 7: All Test Run Page

Let us discuss the sub-headings in detail:

  • Test Run: It shows the unique number associate to each Test Runs.
  • Test Name: It is given before starting any test. The name doesn’t need to be the same.
  • Scenario Name: Specifies the name of the scenario from which the test executed.
  • Start Time: Specifies the date and time when the test started.
  • Run Time: Determines the duration of the Test Run.
  • User: Shows the number of Virtual users used in a Test Run.
  • Started By: It shows the user who started the Test Run.
  • Notes: A user can specify any note related to that Test Run.
  • Action: It shows various action user can take like deletion, archive, and unlocking.
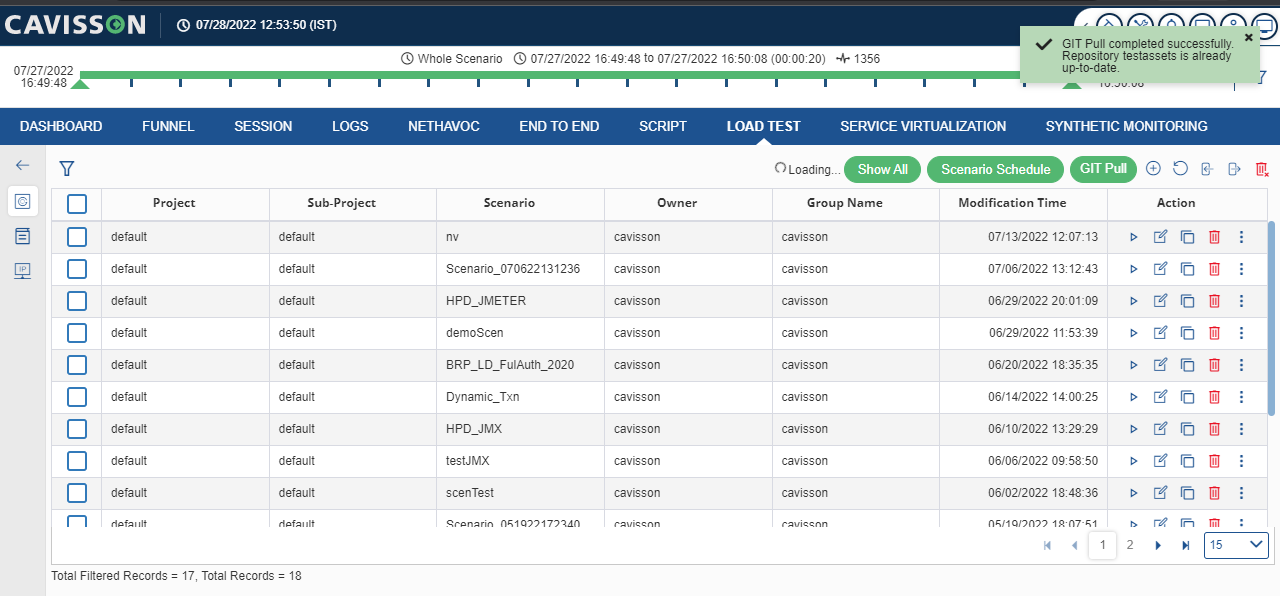
Scenarios

Click on  for scenarios detail. You have the following details as displayed below.

Figure 8: Scenarios Page

The scenario management window contains all the scenarios created in the past. The user can view all scenarios irrespective of the project, sub-project or started time using the Show All button. The user can also apply filters for getting scenarios that lies in a particular project, sub project, or started at a particular time, such as today/1 week/3 months/12 months by setting the filters and clicking the Apply button. The user can also search for a particular scenario using the search box. To reset the filters to default, click the Reset button.

The scenario management window contains all the scenarios created in the past. The user can view all scenarios irrespective of the project, sub-project or started time using the Show All button. The user can also apply filters for getting scenarios that lies in a particular project, sub project, or started at a particular time, such as today/1 week/3 months/12 months by setting the filters and clicking the Apply button. The user can also search for a particular scenario using the search box. To reset the filters to default, click the Reset button.

The Scenario Management window is displayed in.

Figure 9: Scenario Window

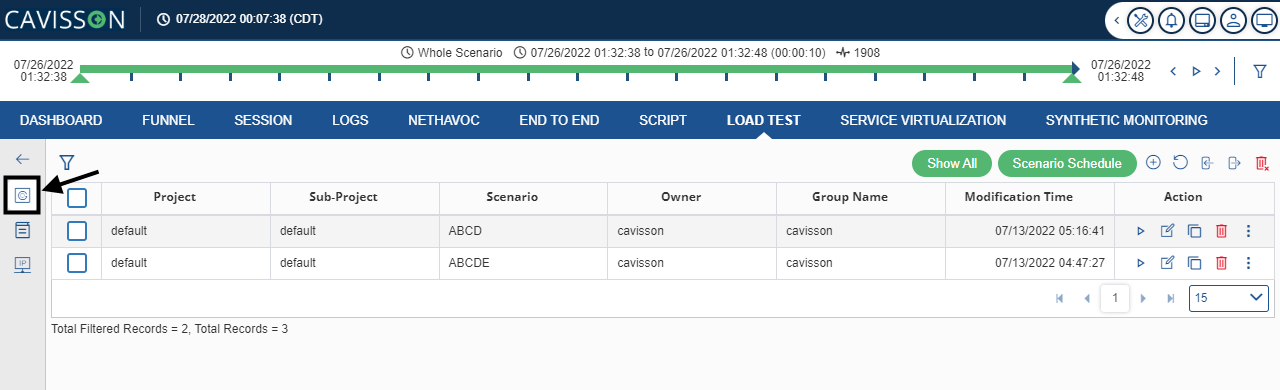
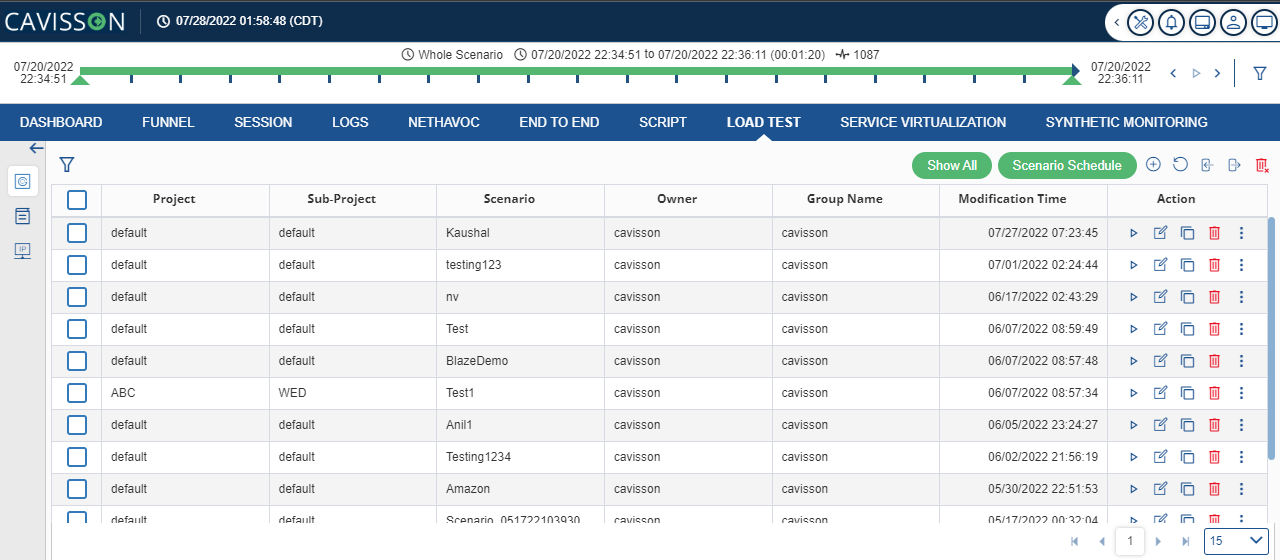
In Scenario table we have following columns :

  • Project: Project is the directory.
  • Sub-Project: Sub-Project is the directory.
  • Scenario: Specifies the scenario Name.
  • Modification Time: Shows the time and date when the scenario is modified.
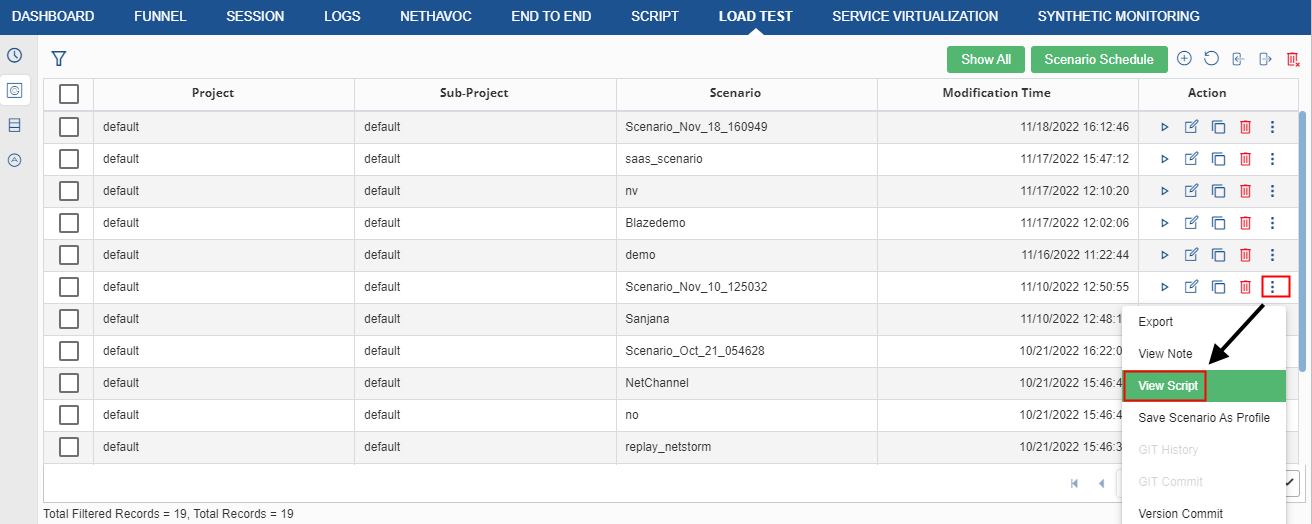
  • Action: It shows the following action to be taken:

– This icon is used to start the scenario.

– This icon is to edit the scenario.

– This icon is to copy the scenario.

– It is to delete the scenario.

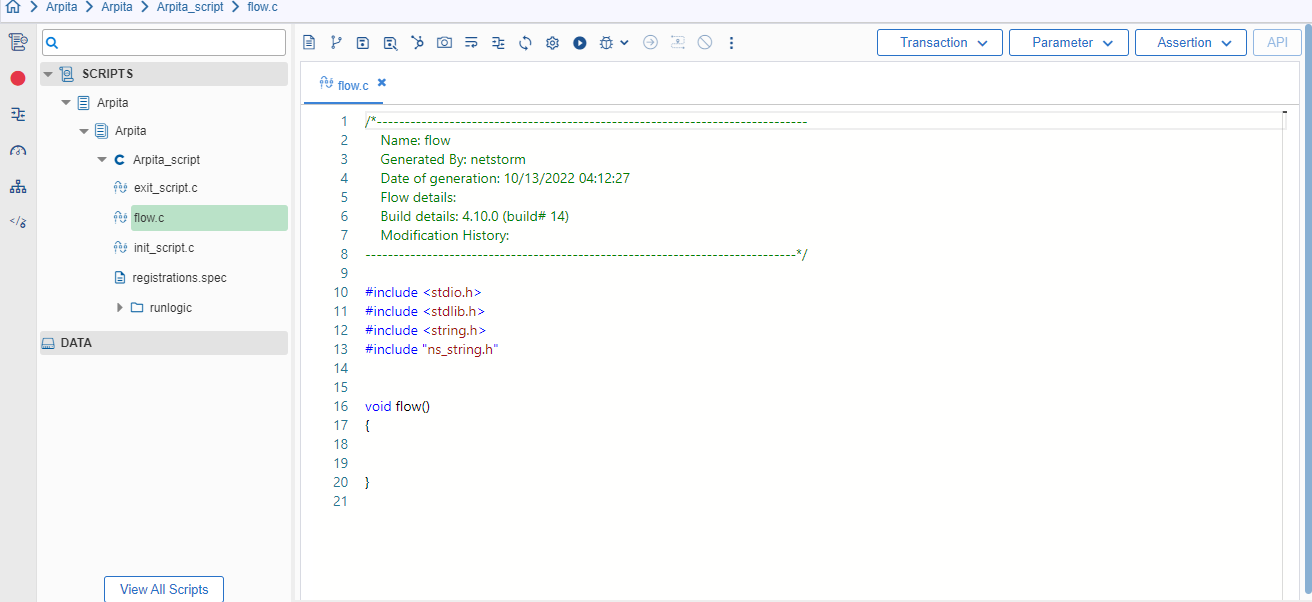
  • View Script: User can view the script used in the scenario creation. To do this, select the scenario and click the View Script button as shown in below figure.
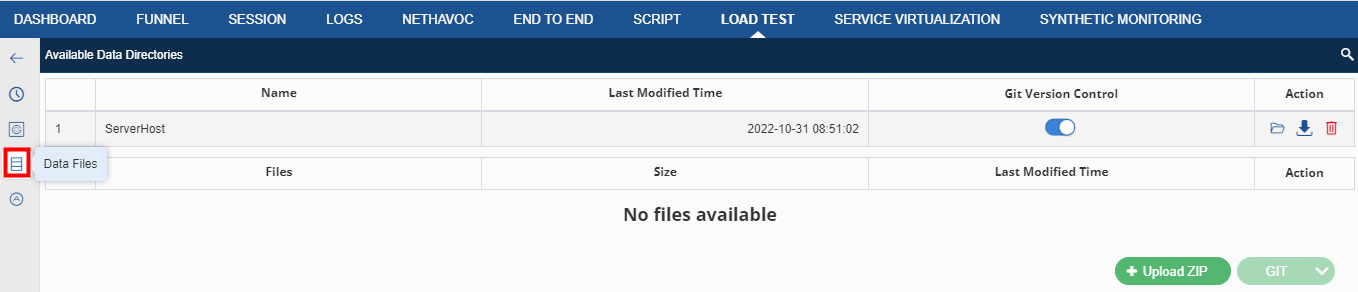
Figure 10: View Script Option

 The script gets displayed on the Script Editor window.

Figure 11: Script Editor

Scenario Schedule

The tasks are executed automatically based on the preconditions, inputs, and the scheduled time. In Scheduler Management, the user is asked to provide some pre-conditions for starting a test. Once conditions are provided, the user is required to specify the email id to make aware that the test has been started (in case the user is not available at a time when test has been started).

Once all the details regarding the test are provided, a time to schedule that task is provided to the user. Once the time matches with server time, the task is executed or in simple words, the test gets started.

To perform this activity, select a scenario and click the Scenario Schedule button.

Schedule Scenario have following fields:

  • Task name: Name of the task to be created.
  • Description: Description of the task.
  • Schedule Time: Time when scenario is scheduled.
  • Schedule Expiry Time: Expiry time of the schedule scenario.
  • Status: Shows whether the task is passed or failed.
  • Action: It is used for editing the task, whether to edit or delete a particular task.

A dialog box is displayed. If you click the Create Task Tab a new tab opens.

Figure 12: Schedule Scenario

Create Task

In this section, user can create a task and schedule it for its execution. To perform this activity, click the Create Task Button. The Scenario Schedule window is displayed with first section as Task Description.

Figure 13: Create Task Window

Task Settings

Figure 14: Task Settings

Task Settings have following fields:

  • Task Name: Task name must start with alphabet and must not include white space and special character.
  • Description: It is the description of the task.
  • Project/Subproject: Project/Subproject are used for holding test assets like the script, scenario, test suite, and check profiles
  • Scenario Name: Select the scenario name from the drop down.

Mail Settings

Figure 15: Mail Settings

Mail Settings have following fields:

  • To: Enter the email id.
  • Subject: Enter the subject of the mail to be sent.
  • Body: Content of the mail.

Advance Settings

If all controller is busy then select the wait time After which task will be cancelled.

Note: Scheduler will check every 1 minute for availability of controllers.

GIT Pull

It is used to pull the latest commits from the remote server to the local repository. By refreshing scenarios/scripts, all the recently committed files on master repository are fetched to the scenarios/scripts directory of local repository Select a record and click the GIT Pull button. On successful processing, a message is displayed – Refresh successfully.

Figure 16: GIT Pull Message

Create Scenario

For details of create scenario, refer to Create Scenario section in Chapter 5.

Scenario Profile

This section describes how to create a scenario profile and configure it for use in other scenarios. If the user selects that particular scenario profile while creating a scenario, the settings are reflected in the created scenario. There is no need to perform the settings repeatedly, the user just needs to select the scenario profile in which the required settings have already been done.

The user needs to follow the below-mentioned steps for creating a scenario profile:

  1. Login to LOAD TEST. On the left panel, click Scenarios icon, and then click Scenarios Profiles.
Figure 17: Scenario Profile Selection

2. The Scenario Profile window is displayed.

Figure 18: Scenario Profile Window

Scenario Profile has the following columns:

  • Project/Subproject: Project/Subproject are used for holding test assets like the script, scenario, test suite, and check profiles. They are folders/subfolders and can be managed from Project Administration Screen.
  • Scenario Profile: Shows scenario profile name.
  • Modification Time: Time and date when scenario profile is updated.
  • Action:
  • Delete: Use the icon to delete any scenario.
  • GIT History: User can view the version logs of a Scenario through GIT history
  • GIT Commit: This is used to commit the changes to a local repository.

3. In the Scenario Profile window, click the Add The Create Scenario Profile dialog box is displayed.

Figure 19: Create Scenario Profile Window

Following are the fields in the adding scenario profile:

  • Project/Subproject: Project/Subproject are used for holding test assets like the script, scenario, test suite, and check profiles. Select the required project/subproject from the drop down.
  • Profile name: Enter the profile name.

4. The Scenario Profile window is displayed.

Figure 20: Scenario Profile Page

5. The sections for setting different options (in additional settings, Group-based settings etc.) are displayed. Here, the user can set up a scenario profile and save the settings for later use in scenarios.

Internet Protocol (IP) Address Management

It is a method of tracking and modifying the information associated with a network’s Internet Protocol address (IP address) space. It is an integrated suite of tools to enable end-to-end planning, deploying, managing, and monitoring of your IP address infrastructure, with a rich user experience. It automatically discovers IP address infrastructure servers and Domain Name System (DNS) servers on your network and enables you to manage them from a central interface.

Why IP Management is required?

There is a need for LOAD TEST to support multiple sources of IP addresses for the following reasons.

  1. Real users use different source IP addresses and hence to emulate the real-world scenarios LOAD TEST should be able to generate virtual users with different source IP addresses.
  2. When LOAD TEST generates a very high connection rate, the system can run short of IP addresses/ports combinations for creating new connections. Ports are limited to 64K and hence having several sources IPs may be required.

There is a need for LOAD TEST to support multiple servers IP addresses for the following reasons.

  1. Real servers use different IP addresses and hence to emulate the real-world scenarios LOAD TEST should be able to connect to different servers with IP addresses.
  2. When LOAD TEST generates a very high connection rate, the system can run short of IP addresses/ports combinations for creating new connections on the server side. Ports are limited to 64K and hence having several destinations IPs may be required.

This is achieved by IP management module of LOAD TEST product.

IP Management in LOAD TEST

Go to Load Test > Scenarios > IP Management.

Figure 21: IP Management Icon

This displays the IP Management window. Here, the user can assign IP address for client and server.

Figure 22: IP Management Window

To assign an IP address for the client or server, the user is required to click the Client or Server button respectively.

Assigning IP Address

On the IP Management window, click the Add button. This displays the Add IP window (for either client or server based on the option selected).

Figure 23:Add IP for Client

The user needs to provide the following inputs:

  • IP Version: Select either IPv4 or IPv6.
  • Vlan ID: An ID associated with each VLan.
  • Network ID: Network ID for client/server.
  • Netbits: Bits of IP address, which are used to represent the network.
  • Start IP: Start IP of the particular range (netid).
  • End IP: Last IP of the given range.
  • Number of IPs: Number of PIs in the provided range.
  • Gateway: Allows data to flow from one discrete network to another. IP properties Tab of the IP Management affects this field.
  • Interface: It is condition-dependent. If we are using more than one Load interface, then only these column becomes visible.

Auto Fill: By clicking the Auto Fill button, the details are filled out automatically. To use this option, the user must provide Start IP and End IP or Number of IP.

Delete IPs: The user can delete one or more IPs by selecting the record(s) and clicking the Delete button.


IP Connectivity

On clicking this button, it fetches those clients IPs and server IPs, which are not connected.

Figure 24: IP Connectivity

Following are the columns available:

  • Client Start IP: Start IP of the client in particular range (netid).
  • Client Gateway: Allows data to flow from one discrete network to another.
  • Server Gateway: Allows data to flow from one discrete network to another.
  • Server Start IP: Start IP of the server in particular range (netid).


Properties

The user can set the Gateway configuration for the IPs. Based on Gateway configuration, Gateway column vary in IP tab. The user can reserve the net ids so that they cannot be added to the IP tab.

Figure 25: IP Properties

Gateway Settings

  • Only Layer 2 device is between client and server (No Gateway configuration required): If the user wants to set the gateway configuration in such a way that there is no gateway required between client and server then the user needs to use this option.
  • Only Layer 3 device(s) is between client and server (Gateway configuration always required): If user always wants to use the Gateway between client and server, then the user needs to use this option.
  • If the user wants to use first IP as gateway, the user needs to use the following option: Use first IP address of the IP range as Gateway address if Gateway not specified.
  • User-defined (No enforcement of Gateway configuration):It means there may or may not be a gateway between the client and server. Therefore, the user can use this option.

Other Settings

The user can reserve net ids that cannot be added to IP tab. This net id is reserved for internal use. We use 192.168.255.0 as the reserved net id for IPV4.


Data Files

You can use the Data Directory section for data file management. If you override the data directory, the data files of all file parameters are taken from the specified directory. If no file is found, it will be taken from the data directory specified in the file parameter and then from the script directory.

Click on  for data files. Once you click this icon the data files page opens as in below figure:

Figure 26: Data Files

Let us discuss the fields in detail:

  • Name: It is the name of the data directory.
  • Last Modified: It shows the last date and time when the directory was last modified.
  • Action: In action, we have the following option:
  • View in file explorer : It will show content of data directory in File Manager like below figure:
Figure 27: File Manager
  • Download in zip : It will download the data directory in zip format.
  • Delete the data directory file : it will delete data directory with its content.

Upload ZIP: Upload zip of file containing files with following extension dat, csv, txt, xml, json, cfg, pdf, docx, xls, zip, java, jar and js.