Using this section, user can perform group-based settings. User can add group-based settings to their scenarios from here. User can apply the following type of settings through Group settings window of Scenario UI:
- User Behavior
- Think Time
- Session Pacing
- Page Reload
- Click Away
- Inline Delay
- Browser Emulation
- Cipher Suite
- Inline Resource
- Caching
- Protocol Settings
- HTTP
- Header
- Version
- Keep Alive
- HTTP Proxy
- HTTP Timeout
- Advanced
- SMTP
- RTE
- Logs & Reports
- IP Settings
- SSL
- Ramp Down Settings
- Script Parameter
- Server Mapping
- RBU
- RDT
- Developer Options
- HTTP(s)
- Virtual User
- Smoke/Validation Test Criteria
- Request Body Encryption
- Debug Logging
- Others
User Behavior
Think Time
Think time is the delay between two steps/pages in the script. It is specified by calling ns_page_think_time () API. Think time passed in the API is called recorded think time. While browsing the application a user spends some time (think time) before doing any action on the website. For example, if you are purchasing an item, before adding the item to your cart, you take some time to review the features on the product page. This time spent on the product page is called think time.
In performance testing, we need to simulate the actual real-world scenarios. This is where the think time comes into the picture to better simulate the user journey steps, such as paths to purchase, searching for a product, or logging into an account. Each of these steps has different think time values and it is important to take these into considerations when performing load testing. It is recommended to use Uniform Random think time to simulate the real-world scenario.
Think time is applied only if ns_page_think_time () API is called after a page/step as shown below in this example. In some cases, such as when user action results in multiple steps and the need is to capture the transaction time of the user action think time API should not be added between steps.
voidflow()
{
ns_start_transaction(“CavLoadTest”);
ns_web_url(“CavLoadTest”, “URL= https://www.cavisson.com/netstorm-load-testing-solution”);
ns_end_transaction(“CavLoadTest”);
ns_page_think_time(1.5);// Applied Recorded think time is 1 second and 500 milliseconds
ns_start_transaction(“CavLoadTestFeatures”);
ns_web_url(“CavLoadTestFeatures”,
“URL= https://www.cavisson.com/netstorm-load-testing-solution/netstorm-features/”);
ns_end_transaction(“CavLoadTestFeatures”);
}
To setup Think Time configuration, click Group Settings ![]() icon on API Configuration beside Request List as shown in below figure .
icon on API Configuration beside Request List as shown in below figure .
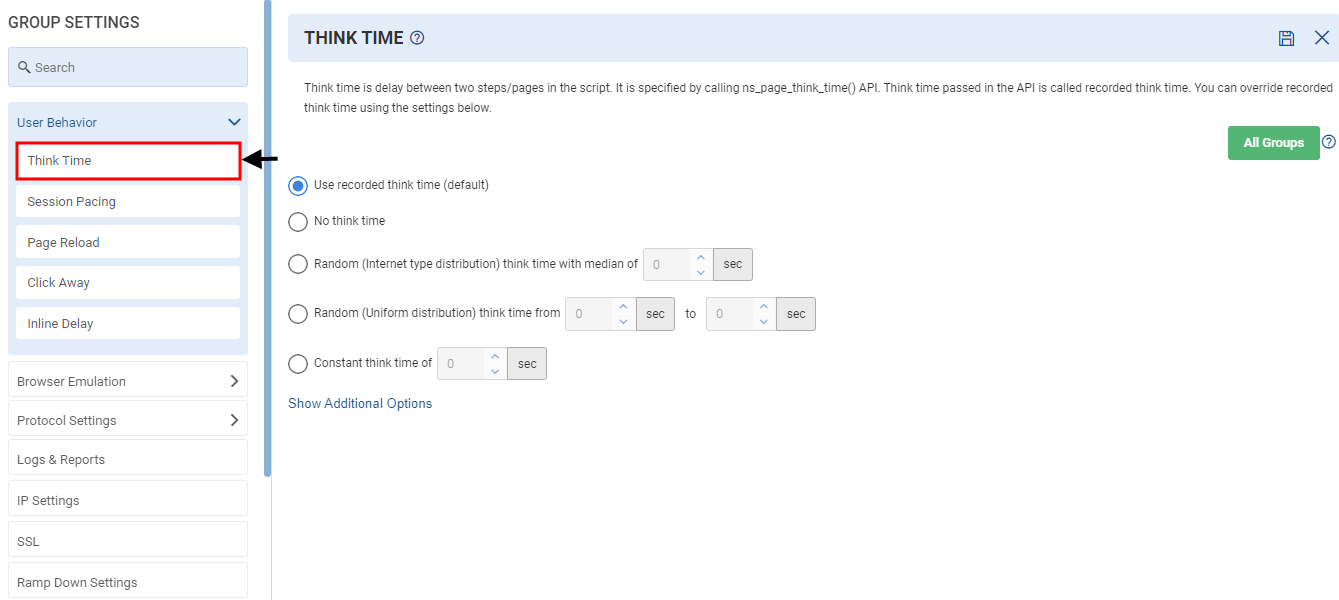
Think Time Options
- Use recorded think time: Think time is a value as specified in the API.
- No think time: Think time is not applied. It is useful to generate a huge uncontrolled load.
- Random (Internet type distribution) think time with median of specified seconds: Think time is an Internet distribution random value with median as specified which is roughly 1/4th of the mean.
- Random (Uniform distribution) think time range: Think time is a uniform random value between from and to the value specified.
- Constant think time: It is a constant value as specified.
Additional Options
Following are the additional options in Think Time:
- Use recorded think time multiplied by: Think time is multiplied by the specified value. The specified value can be in decimal also in case you want to apply half of the recorded think time then you can use 0.5
- Use random percentage of recorded think time from a specified range: Think time is a uniform random percentage (between from and to the value specified) of recorded think time.
- Custom think time returned by C method: Think time is the value returned by the C method which must be added in the script with a return value of double. It is currently supported only for C-type scripts.
Click the Save Changes ![]() icon on the top right corner of the page.
icon on the top right corner of the page.
Session Pacing
Pacing is related to rate of speed. Load on the server does not just depend upon the number of concurrent users, pace at which a virtual user is generating session is also equally responsible for the load on the server. Pacing is a key element in load determination, it is important that Pacing configuration for a scenario is realistic.
Session pacing is an interval between two sessions executed by a virtual user. This is used to simulate the real life scenario where user accesses application after some interval. It provides control for the load to be generated once number of users is provided. Session pacing is applied after every session. It can also be applied before first session of the user to randomize hitting of application when users are ramped up.
Session pacing is applicable to FCU scenario only as in FCU, users created during ramp up and then these users execute script (called sessions) with a delay between sessions based on session pacing setting.
In case of FSR, it is not applicable, as in FSR, session rate is fixed. Users are created to generate the target session rate. Once user completes session, user is removed.
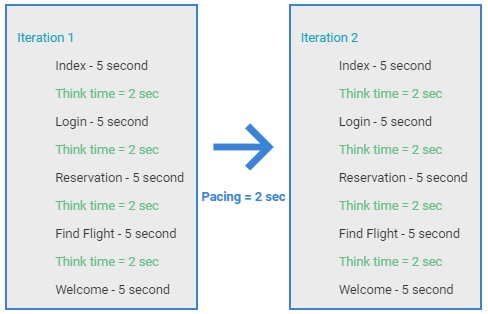
After a virtual user has completed executing a test script, it starts executing the next iteration of the session associated with its scenario group. The timing of next iteration of session execution depends upon the pacing configuration of the session.
To setup Session Pacing, click Group Settings ![]() icon on API Configuration beside Request List as shown in Figure 175. Once you click the icon, Group Settings page opens. Select Session Pacing under the User Behavior as shown in below figure.
icon on API Configuration beside Request List as shown in Figure 175. Once you click the icon, Group Settings page opens. Select Session Pacing under the User Behavior as shown in below figure.
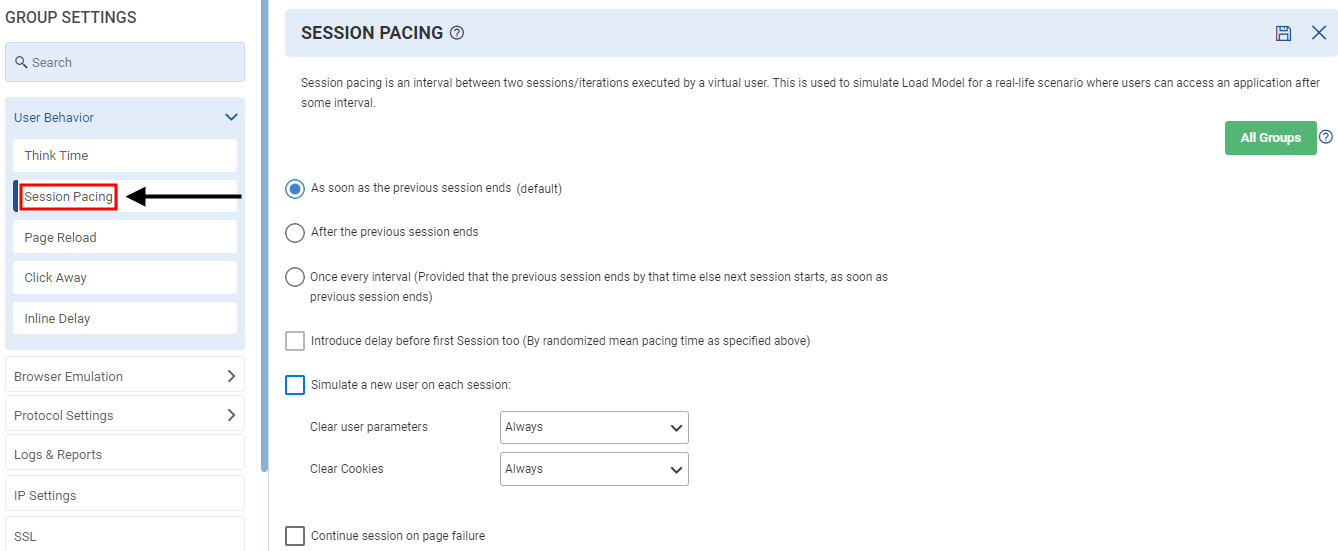
Continue session on page failure: To allow that session to be continued when there is an error on page occurred, select the Continue Session on Page Failure check box.
Runtime Changeable Yes
NOTES
It is applicable only in Fixed Concurrent Users (FCU) Scenario.
Applied session pacing can be seen in Page based stats and Virtual user trace.
Once every interval is the recommended session pacing setting and is recommended to be 1.5X to 2X of the average session duration.
Click the Save Changes ![]() icon on the top right corner of the page.
icon on the top right corner of the page.
Page Reload
Page Reload means to download the same web page again, which is currently on the displayed window, in case if it changes at the server side since it was last downloaded. User can stop loading of the current page after the timeout and loading same page again. Click the Page Reload menu item under the Group Setting section. This displays the Page Reload window.
To setup Page Reload, click Group Settings ![]() icon on API Configuration beside Request List as shown in Figure 175. Once you click the icon, Group Settings page opens. Select Page Reload under the User Behavior as shown in below figure.
icon on API Configuration beside Request List as shown in Figure 175. Once you click the icon, Group Settings page opens. Select Page Reload under the User Behavior as shown in below figure.
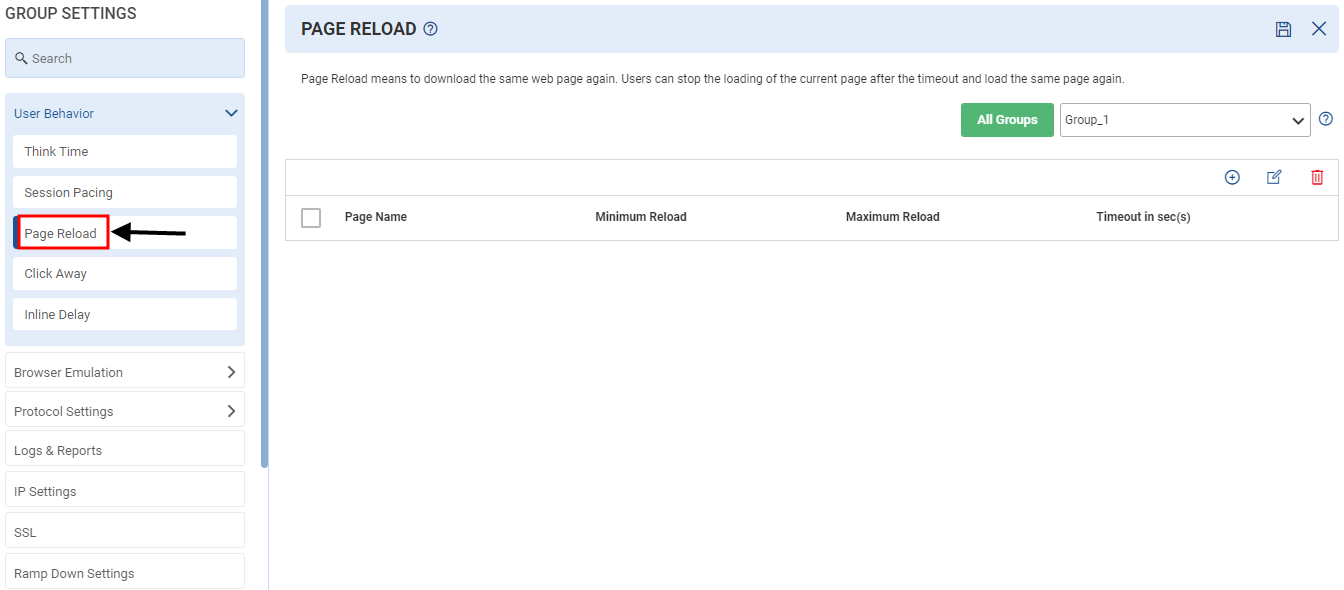
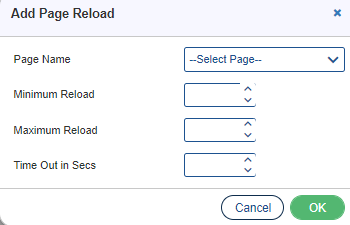
To add Page Reload click the ![]() icon and fill the following fields:
icon and fill the following fields:
- Page Name: Select the page name from the drop-down.
- Minimum Reload: Enter the minimum reload time required.
- Maximum Reload: Enter the maximum reload time.
- Timeout in Secs: Enter the timeout in seconds for reload.
Once all the fields are filled, click the OK button.
User can also Edit ![]() or
or![]() delete Page reload by clicking the or icon respectively as per the requirement.
delete Page reload by clicking the or icon respectively as per the requirement.
Click the Save Changes ![]() icon on the top right corner of the page.
icon on the top right corner of the page.
Click Away
Click Away means to leave the current sequence of page execution and redirect the current page to a different page. Click Away represents the user behavior of leaving the current execution of the Script. Users can stop the loading of the current page after the user’s patience timeout.
User can apply Click Away across all groups, or specified groups.
To setup Click Away, click Group Settings ![]() icon on API Configuration beside Request List as shown in Figure 175. Once you click the icon, Group Settings page opens. Select Click Away under the User Behavior as shown in below figure.
icon on API Configuration beside Request List as shown in Figure 175. Once you click the icon, Group Settings page opens. Select Click Away under the User Behavior as shown in below figure.
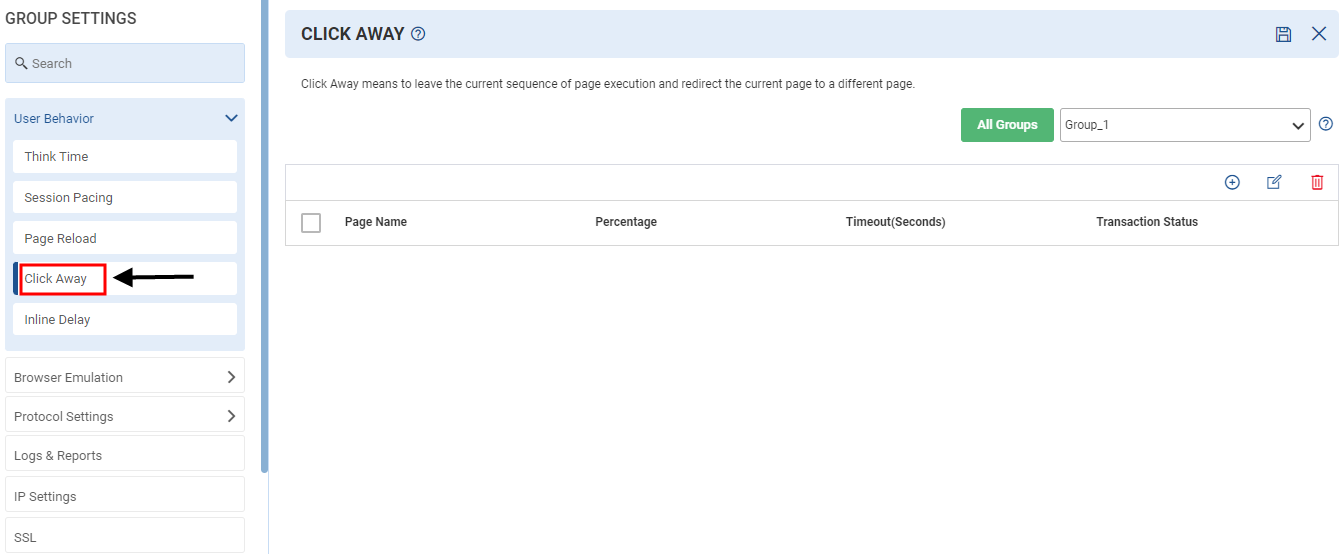
Specify the following fields once you click the add icon:
- Page Name: Page index from where to perform the action.
- Percentage: It is how many (%) pages is to be clicked away.
- Timeout in secs: Timeout for click away (in secs).
- Transaction Status: This field defines the status of transaction either Success or ClickAway.
You can also edit or delete the added fields.
Note:
- Percentage for the “Click Away” a page if Main URL download time is greater than click away time given.
- Open transaction needs to be closed with Click Away if clicking away to the exit page (i.e. -1).
- User has to be very careful if he/she is using click away & transaction.
- It may be possible that a transaction is started on page 3 & closed on page 5, but user clicked away a page 2 → 4. In that case, transaction is not started but configured to end. Some warning message is displayed to console.
- If both Reload and Click Away is given, checks Reload first, then Click Away.
- If RunLogic is given & Click Away is also given, then next page is -1 (End of script).
- Page status is set to ClickAway in report if ClickAway condition is matched.
- Open transaction needs to be closed with Click Away if clicking away to the exit page (i.e. -1).
Click the Save Changes ![]() icon on the top right corner of the page.
icon on the top right corner of the page.
Inline Delay
Inline delay is to calculate the interval between loading of two inline objects of a page. The settings are similar to page think time.
Let’s understand with an example. In a store, the agent is doing a checkout for which he/she has to scan multiple products. Here, the checkout is the main page/step and each scan is an inline URL. After every scan there is a delay because the agents take some time to scan a product barcode. To simulate those types of situations users, have to use inline delay for every inline URL, so that we can put some time difference between the inline URL.
To setup Inline Delay, click Group Settings ![]() icon on API Configuration beside Request List as shown in Figure 175. Once you click the icon, Group Settings page opens. Select Inline Delay under the User Behavior as shown in below figure.
icon on API Configuration beside Request List as shown in Figure 175. Once you click the icon, Group Settings page opens. Select Inline Delay under the User Behavior as shown in below figure.
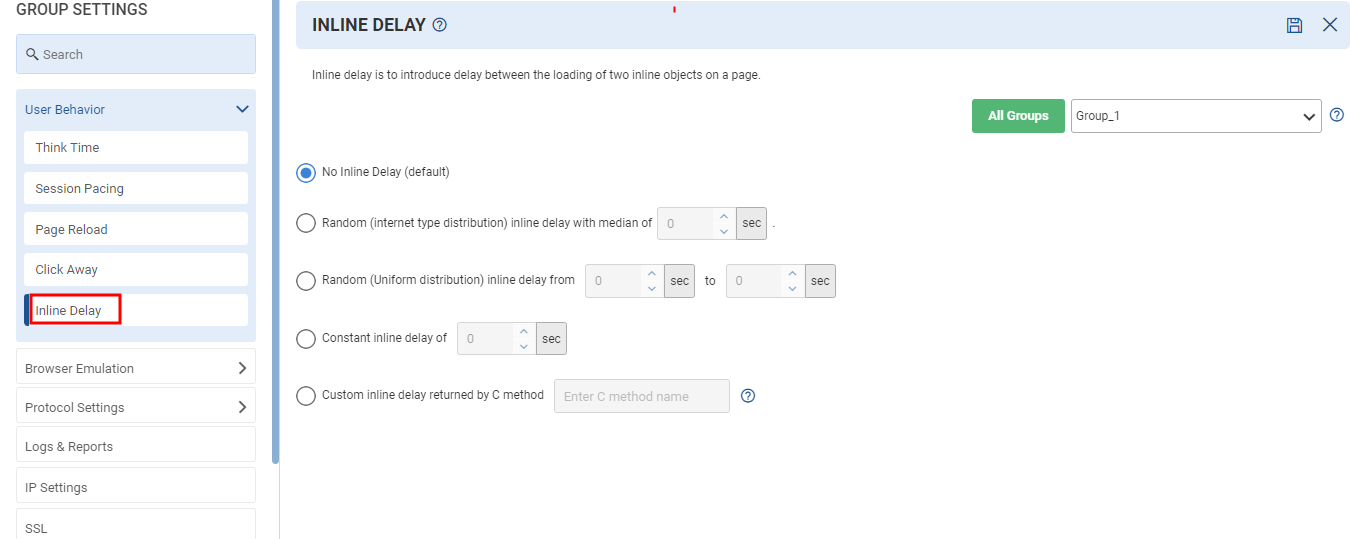
Inline Delay Options
- No Inline Delay: Inline delay is not applied.
- Random (Internet type distribution) inline delay with median of value specified in seconds: Inline delay is an Internet distribution random value with median as specified which is roughly 1/4th of the mean.
- Random (Uniform distribution) inline delay from specified range in seconds: Inline Delay is a uniform random value between from and to value specified.
- Constant inline delay of value specified in seconds: Inline Delay is a constant value as specified.
- Custom inline delay returned by C method: Inline delay is the value returned by the C method which must be added in script with a return value of double. It is currently supported only for C type scripts.
Note: It is applicable to Web Protocol scripts only.
Click the Save Changes ![]() icon on the top right corner of the page.
icon on the top right corner of the page.
Browser Emulation
Cipher Suite
A Cipher Suite is a set of algorithms that help to secure a network connection. Suites typically use Transport Layer Security or its now-deprecated predecessor Secure Socket Layer.
By default, ALL available Cipher Suites are used in SSL handshake which will be sent for further negotiation as per the protocol version.
To setup Cipher Suite, click Group Settings![]() icon on API Configuration beside Request List as shown in Figure 175. Once you click the icon, Group Settings page opens. Select Cipher Suite under the Browser Emulation as shown in below figure.
icon on API Configuration beside Request List as shown in Figure 175. Once you click the icon, Group Settings page opens. Select Cipher Suite under the Browser Emulation as shown in below figure.
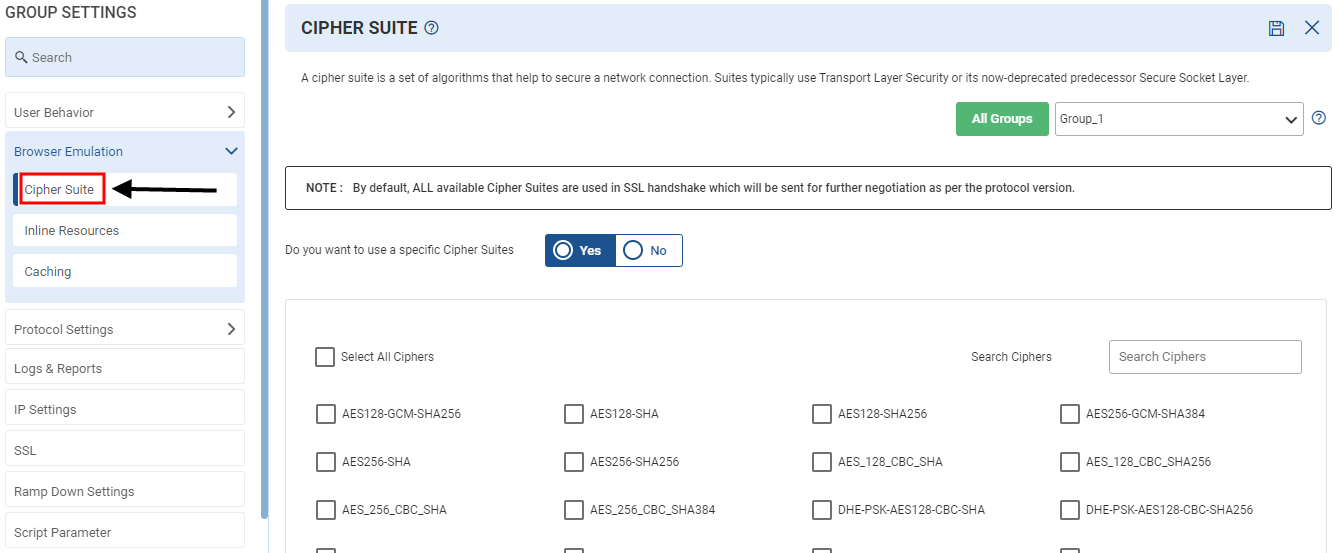
The user can choose Cipher from a list of available cipher suites if he wants to conduct tests with various cipher suites for benchmarking.
Click the Save Changes icon on the top right corner of the page.
Inline Resources
LOAD TEST fetches URL based on the recorded scripts. However, many web applications have dynamic contents, which changes based on the time, place and other factors. In addition, contents may change from release to release. Therefore, to do realistic testing and to avoid reordering of script with every release, auto fetching of embedded objects is required. So, the concept of auto fetch is used to fetch embedded URLs from real site.
To setup Inline Resources, click Group Settings ![]() icon on API Configuration beside Request List as shown in Figure 175. Once you click the icon, Group Settings page opens. Select Inline Resources under the Browser Emulation as shown in below figure
icon on API Configuration beside Request List as shown in Figure 175. Once you click the icon, Group Settings page opens. Select Inline Resources under the Browser Emulation as shown in below figure
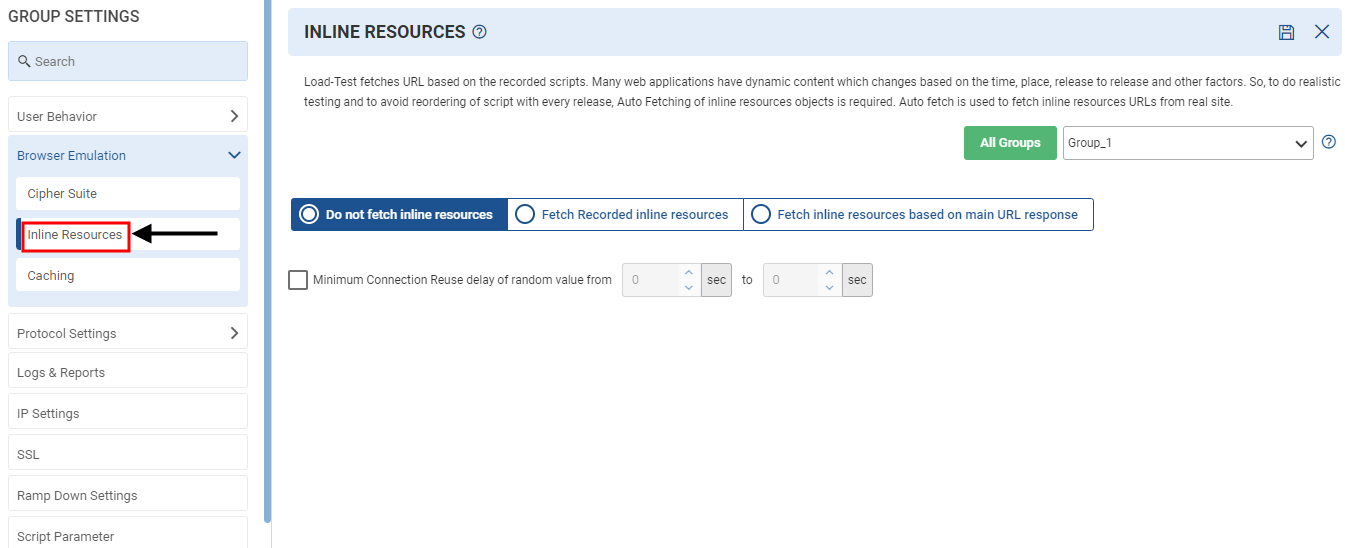
Inline Resource Options
- Do not fetch inline resources: When enabled, no dynamic inline URLs are captured in the network. It captures only the main URL.
- Fetch recorder inline resources: When enabled, only recorded inline URLs are captured in the network.
- Fetch inline resource based on main URL response: When enabled, all dynamic inline resources based on the main URL’s response are captured.
Add URL Filter
- URL Pattern: The user needs to define the URL pattern that he wants to include or exclude. Using a combination of includes and excludes, the user, should be able to execute the script with what he is interested in and skip what he is not.
Example: If a user doesn’t want to execute the test with a specific inline url of any domain then he/she can exclude that url/domain from the script at the time of execution. Like if the user wants to exclude an image then the user can put *.jpg in the URL pattern and select exclude from the drop-down.
- Inline Include Url Pattern: Specify the URL pattern that need to be included while hitting the inline URL. Url value can be a regular expression like *.jsp.
- Inline Exclude Url Pattern: Specify the URL pattern that need to be excluded while hitting the inline URL. Url value can be a regular expression like *.jsp.
Minimum Connection Reuse delay of random value from a specified range
In most applications, user can make a limit on the connections pool for parallel URL fetching of inline resources. Specify the range to apply delay while reusing the connection. It is used to simulate some blocking time.
Click the Save Changes icon ![]() on the top right corner of the page.
on the top right corner of the page.
Caching
Using the Caching options, you can enable browser cache, refresh cached data, and define the size of your cache table. The act of temporarily storing information and then recovering it either directly or implicitly from a high-performance repository (usually memory) is known as caching. To setup Caching, click Group Settings ![]() icon on API Configuration beside Request List as shown in Figure 175. Once you click the icon, Group Settings page opens. Select Caching under the Browser Emulation as shown in below figure.
icon on API Configuration beside Request List as shown in Figure 175. Once you click the icon, Group Settings page opens. Select Caching under the Browser Emulation as shown in below figure.
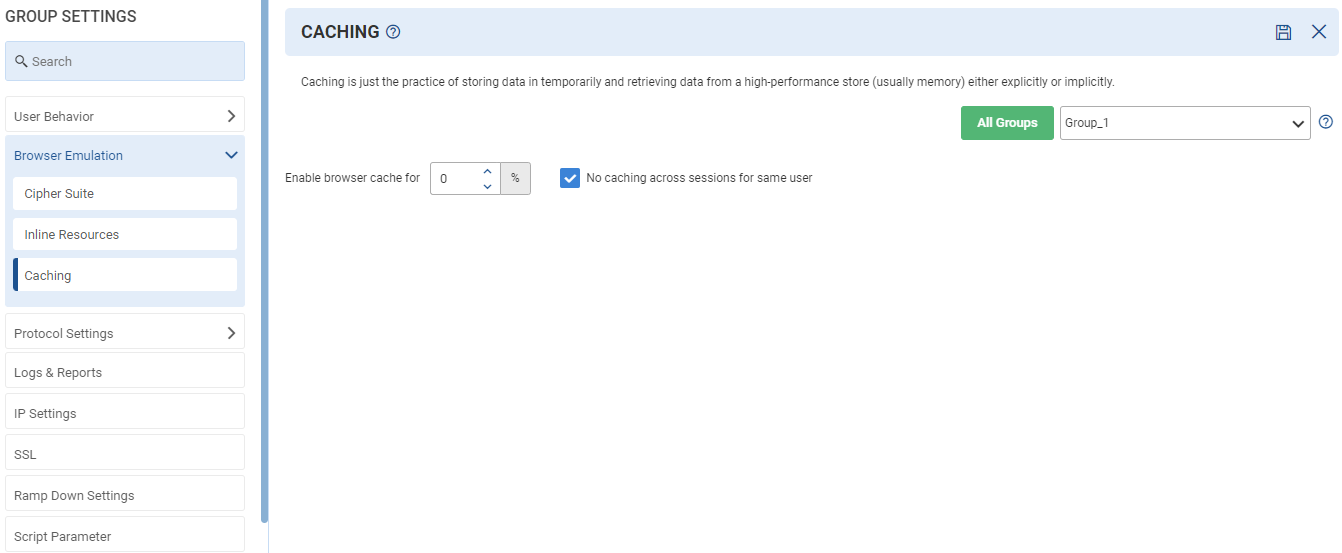
You can specify the following cache settings:
- Enable browser cache for: This helps to simulate browser behavior. % of users using the application is directly related to browser caching.
- No caching across sessions for same user: If caching across sessions is not required for the same user then select this box.
Click the Save Changes ![]() icon on the top right corner of the page.
icon on the top right corner of the page.
Protocol Settings
HTTP
HTTP Header
The name or value pairs that are presented in the request and response messages of the Hypertext Transfer Protocol are known as HTTP headers (HTTP).
Following are the ways to add Headers in HTTP requests: –
- Headers added with recording.
- adding in ns_web_url API.
- Adding a header using the ns web add header () or ns web add auto header () API.
- Adding via Group based setting > Protocol settings > HTTP(S) > Header from the scenario.
Note: A duplicate header will be passed if the same header is inserted several times.
To setup HTTP Header, click Group Settings ![]() icon on API Configuration beside Request List as shown in Figure 175. Once you click the icon, Group Settings page opens. Select HTTP header under the HTTP (Protocol Settings) as shown in below figure.
icon on API Configuration beside Request List as shown in Figure 175. Once you click the icon, Group Settings page opens. Select HTTP header under the HTTP (Protocol Settings) as shown in below figure.
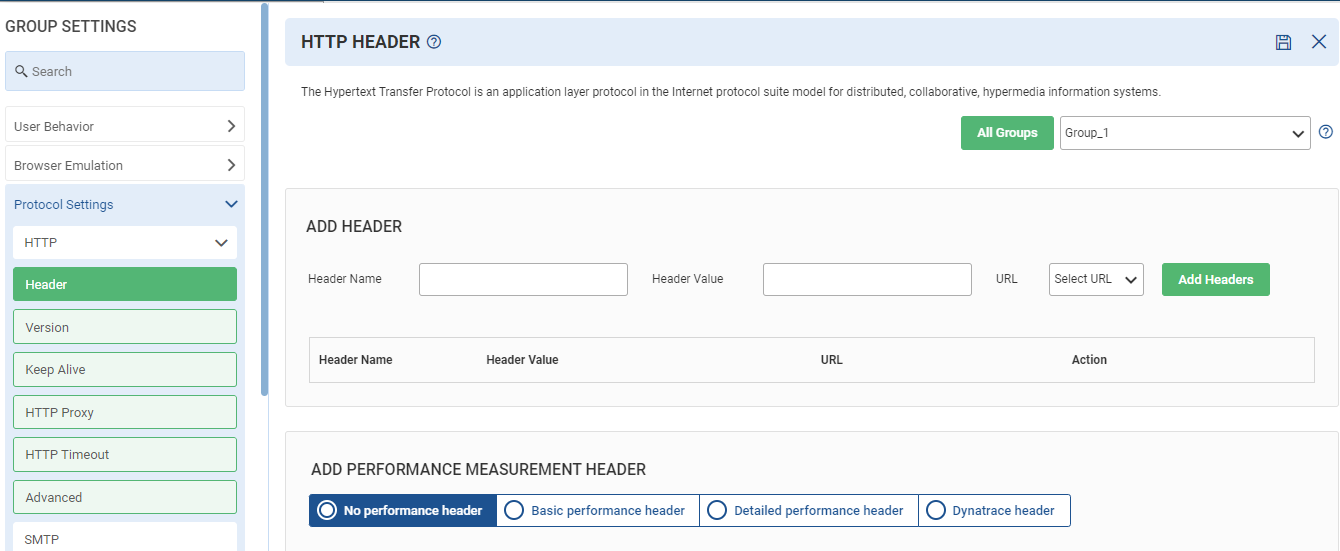
Add Header Options
- Header Name: Specify the name of the header.
- Header Value: Value of the header which you want to pass in the request.
- URL: For URL, select anyone from the following drop-down in which you want to pass the header:
- Main
- Inline
- All
Add Performance Measurement Header
- No performance header: – The requests will not include any extra headers.
- Basic performance header: – Every request will include the header “CavTxName,” the content of which will be the transaction name specified in the script.
- Send transaction name in http request header: Example: CavTxName:Login
Note: If you want to send the above header as Inline request, you have the option to check the box.
- Detailed performance header: – The “x-correlation-id” header, which has a Unique id made up of a combination of the Virtual user id, Session instance, Transaction (last page of the transaction), and Page id, will be passed in addition to the basic header. A page instance is used in the absence of a defined transaction.
- Send unique id (id) in http request header: Example: X-CorrelationID=72057594037928192
CavTxName:Login
Note: If you want to send the above header as Inline request, you have the option to check the box.
- Dynatrace header: – The “x-dynatrace” header, which is added on top of the basic header, will contain a combination of the Unique id, transaction name, and Test Run number as its value.
Note: – We can change these header names from group-based settings > developer options > Performance measurement header
We can also pass the same headers in Inline URLs as well by enabling the checkbox “send above headers with Inline request(s)”.
Dynatrace Session Recording
- Click on the checkbox “Enable Session Recording on the start of test execution” to record Load Test sessions on Dynatrace and fill in Dynatrace server details like Server IP with port, credentials, and Profile name.
Note: – If the user wants to run the test even if the session recording fails, they have to click on the checkbox “Continue Test if Failed to start recording”.
- Append Timestamp to the Recorded Session Name: It will add a timestamp in the recorded session name.
- Lock Session to prevent the session from being deleted during automated cleanups on low disk space: It will lock the recorded session so that auto cleanup will not delete this session.
- Presentable Name: User-readable presentable name for the session to be stored.
- Recording Option: Recording information to be stored in the session.
- PurePath and time series.
- Only PurePaths marked as violated and time series.
- Only Time Series.
- Session Label: Descriptive text to mark the stored session (Here, multiple label parameters are allowed).
- Enter Description: It is the description for the session to be stored.
Notes: If the user wants to run the test even if the session recording fails, they have to click on the checkbox “Continue Test if Failed to start recording”.
Click the Save Changes ![]() icon on the top right corner of the page.
icon on the top right corner of the page.
HTTP Version Settings
The Hypertext Transfer Protocol is an application layer protocol in the Internet protocol suite model for distributed, collaborative, hypermedia information systems. The version of the HTTP protocol (or HTTP versions) commonly used on the internet is HTTP/1.0. which is an earlier protocol and includes fewer functions.
To setup HTTP Version, click Group Settings ![]() icon on API Configuration beside Request List as shown in Figure 175. Once you click the icon, Group Settings page opens. Select HTTP Version under the HTTP (Protocol Settings) as shown in below figure.
icon on API Configuration beside Request List as shown in Figure 175. Once you click the icon, Group Settings page opens. Select HTTP Version under the HTTP (Protocol Settings) as shown in below figure.
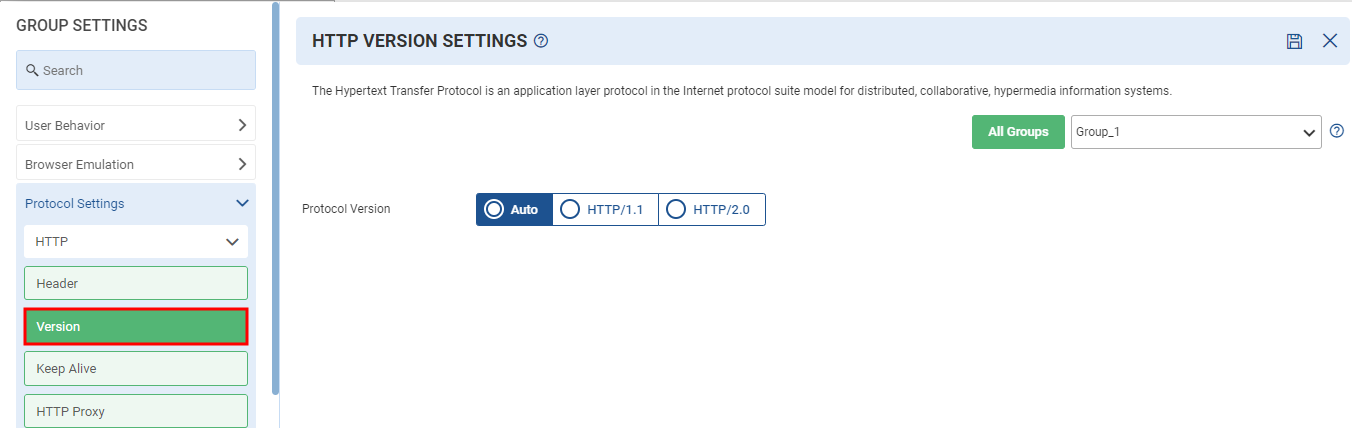
LOAD TEST supports the following HTTP versions:
- Auto: In auto mode, the load test engine first try to use HTTP 2.0 if server don’t support 2.0 than it will use 1.1 version
- HTTP/1.1: This widely used protocol runs on top of the TCP/IP suite of protocols. It provides faster delivery of Web pages than the original HTTP and reduces Web traffic.
- HTTP/2.0: It is a major revision of HTTP. It is a binary protocol (as opposed to text based HTTP/1.1).
Click the Save Changes ![]() icon on the top right corner of the page.
icon on the top right corner of the page.
Keep Alive Settings
A single TCP connection may be kept open for a number of HTTP requests and responses thanks to the HTTP keep alive or HTTP persistent connection instruction. The Keep-Alive general header allows the sender to hint about how the connection may be used to set a timeout and a maximum amount of requests.
To setup Keep Alive Settings, click Group Settings ![]() icon on API Configuration beside Request List as shown in Figure 175. Once you click the icon, Group Settings page opens. Select Keep Alive under the HTTP (Protocol Settings) as shown in below figure.
icon on API Configuration beside Request List as shown in Figure 175. Once you click the icon, Group Settings page opens. Select Keep Alive under the HTTP (Protocol Settings) as shown in below figure.
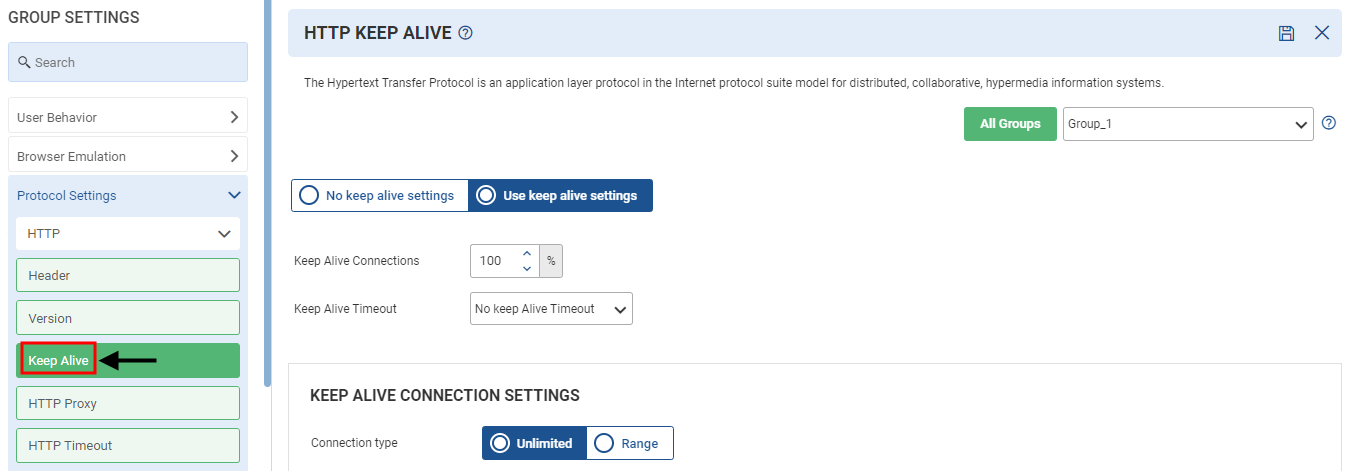
Keep Alive Option
- Keep Alive Time It specify the percentage of keep alive connections per virtual user.
- Keep Alive Timeout: It specify the keep alive timeout for idle TCP connection.
Keep Alive Connection Settings Option
By default, unlimited requests can be processed on a keep alive connection. Users can also specify the range (minimum and maximum).
Click the Save Changes ![]() icon on the top right corner of the page.
icon on the top right corner of the page.
HTTP Proxy
A proxy server is a server that acts as an intermediary for requests from clients seeking resources from other servers. A client connects to the proxy server, requesting some service, such as a file, connection, web page, or other resources available from a different server and the proxy server evaluates the request as a way to simplify and control its complexity.
To setup HTTP Proxy Settings, click Group Settings ![]() icon on API Configuration beside Request List as shown in Figure 175. Once you click the icon, Group Settings page opens. Select HTTP Proxy under the HTTP (Protocol Settings) as shown in below figure.
icon on API Configuration beside Request List as shown in Figure 175. Once you click the icon, Group Settings page opens. Select HTTP Proxy under the HTTP (Protocol Settings) as shown in below figure.
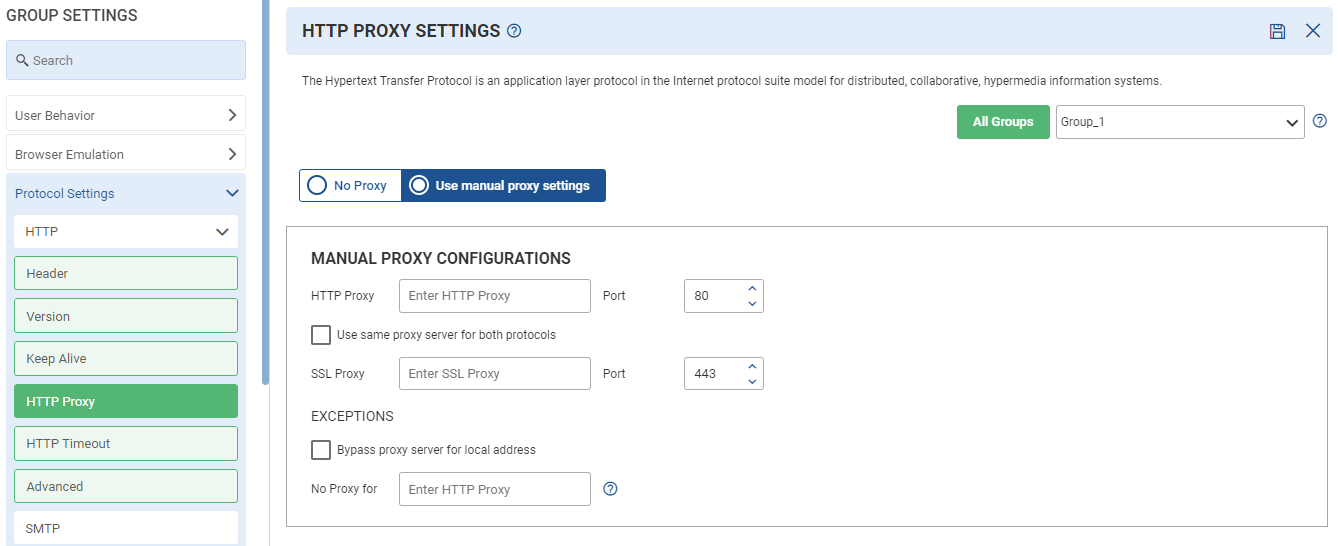
HTTP Proxy Settings Options
- No Proxy: By selecting this option, no proxy is applied to access the web server. This is the default option.
- Manual Proxy Configuration: The Manual proxy section contains the following options
- HTTP Proxy: An HTTP proxy is a category of network setting that can be configured in the network (or Internet) accessing applications. Specify the HTTP proxy in the following format: http://ip:port.
- Port: Port number ranges from 1 to 65535. By default, it is 80.
- SSL Proxy: It routes traffic from a client to a web server using the Secure Sockets Layer (SSL) protocol. SSL is an encrypted protocol that creates a secure connection from one client to another client or server. Specify the SSL proxy in the following format: https://ip:port.
- Port: Port number ranges from 1 to 65535. By default, it is 443.
- Exceptions: Exceptions option gets enabled in case the Manual proxy configuration check box is selected. To bypass the proxy server for the local address, the user first needs to specify the local address, for example, 168.1.0/24 in the No Proxy for text box then needs to select the Bypass proxy server for the local address check box.
- Proxy Authentication Credential: The user’s credentials are verified here. If the user enables the Proxy authentication credential check box, he needs to provide the Username, Password and Confirm the Password.
Click the Save Changes ![]() icon on the top right corner of the page.
icon on the top right corner of the page.
HTTP Timeout
The HTTP Request Timeout response status code indicates that the server wants to terminate this idle connection. Some servers even send it without the client making any prior requests while the connection is inactive.
To setup HTTP Timeout, click Group Settings ![]() icon on API Configuration beside Request List as shown in Figure 175. Once you click the icon, Group Settings page opens. Select HTTP Timeout under the HTTP (Protocol Settings) as shown in below figure.
icon on API Configuration beside Request List as shown in Figure 175. Once you click the icon, Group Settings page opens. Select HTTP Timeout under the HTTP (Protocol Settings) as shown in below figure.
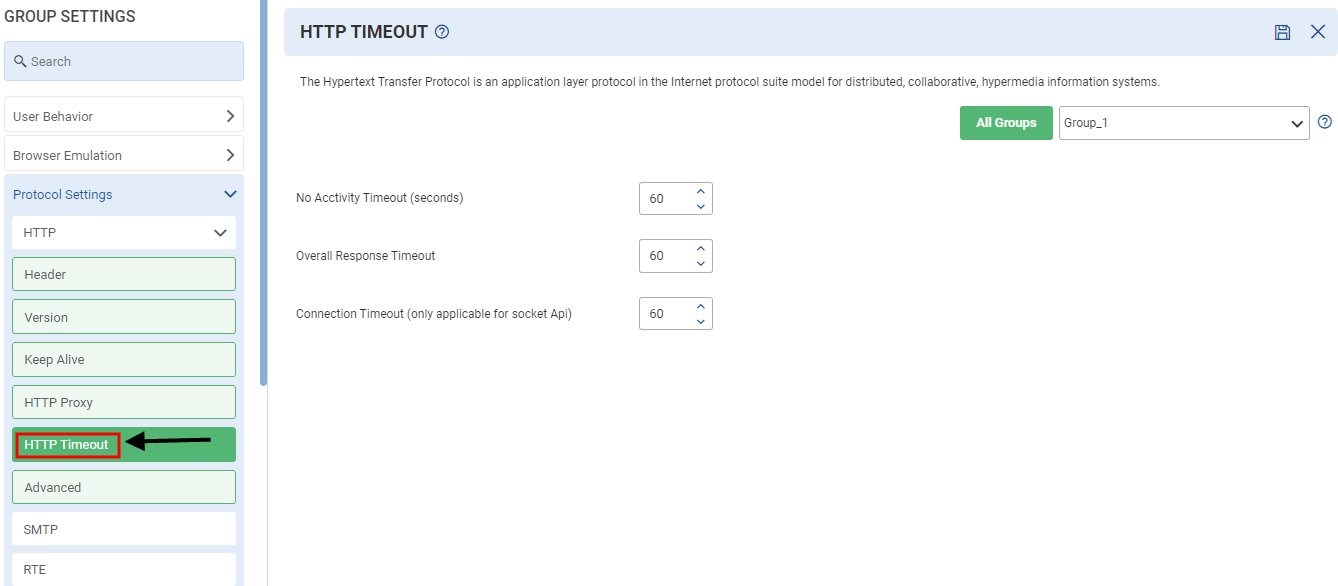
HTTP TIMEOUT OPTION
- No Activity Timeout(secs): This is the timeout value for no activity on the connection. There are two cases in which a request can be timeout. The first case is when the total time taken for DNS lookup, Connection creation, SSL handshake, and sending the request exceeds the value specified for this setting. The second case can happen during the downloading of the HTTP response. If the idle time (no activity on connection) between any two bytes of the response exceeds the specified value, the request is timed out.
- Overall Response Timeout: This is the maximum duration in which the response is expected to be received for any request. If the HTTP response duration exceeds this value, the request is timed out. The HTTP Response Timeout timer is started once the request has been sent to the server and continues to run till the last byte of the response is received.
- Connection Timeout (only applicable for Socket API): In the case of socket API the connection timeout can be overridden from this option.
Click the Save Changes ![]() icon on the top right corner of the page.
icon on the top right corner of the page.
Advanced HTTP Settings
The Hypertext Transfer Protocol is an application layer protocol in the Internet protocol suite model for distributed, collaborative, hypermedia information systems.
To setup Advanced HTTP Settings, click Group Settings ![]() icon on API Configuration beside Request List as shown in Figure 175. Once you click the icon, Group Settings page opens. Select Advanced HTTP Settings under the HTTP (Protocol Settings) as shown in below figure.
icon on API Configuration beside Request List as shown in Figure 175. Once you click the icon, Group Settings page opens. Select Advanced HTTP Settings under the HTTP (Protocol Settings) as shown in below figure.
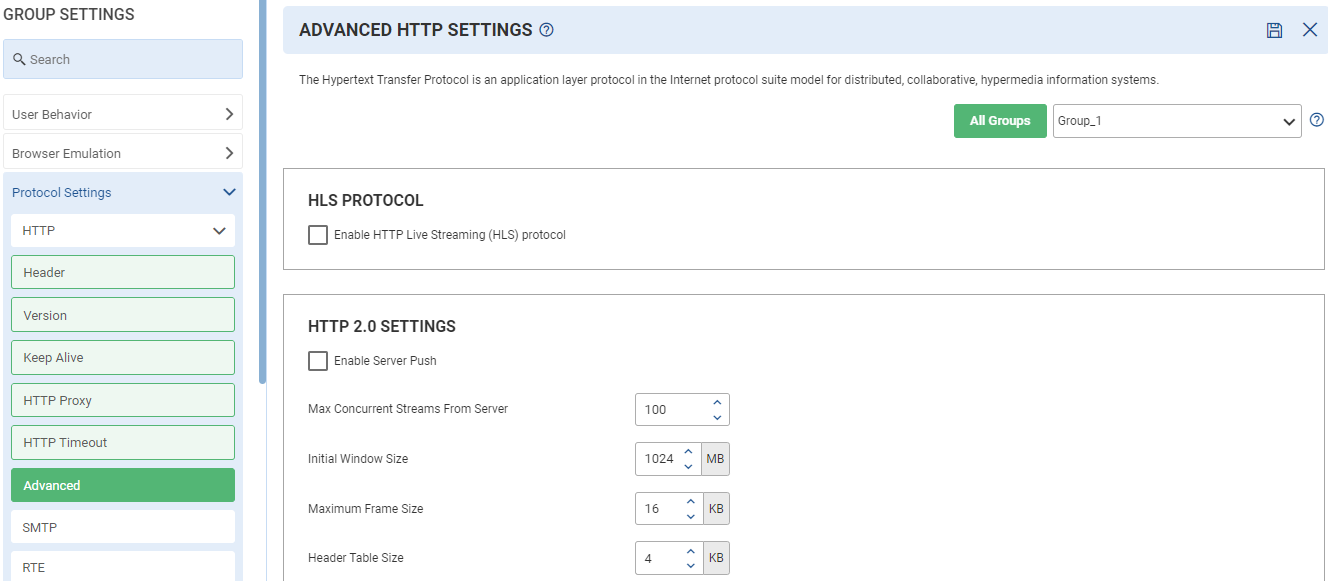
HLS Protocol
- Enable HTTP Live Streaming (HLS) protocol: LOAD TEST supports the recording of a script using Media Streaming (HLS) protocol. HTTP Media Streaming (HLS) is an HTTP-based media streaming communications protocol, used to deliver the media content by breaking the overall stream into a sequence of small HTTP-based files. The client can choose from a range of alternative streams that play the same content while being encoded at various data rates, allowing the streaming session to adjust to the available data rate.
HTTP 2.0 Settings Option
- Enable Server Push: HTTP 2.0 allows a web server to send resources to a web browser, before browser requests for them. This helps websites load faster. To improve latency, HTTP/2 introduced server push, which allows the server to push resources to the client (LoadTest/Browser) before they are explicitly requested.
- Max Concurrent Streams from Server: This refers to maximum number of connections that can be established in parallel to a particular host.
- Initial Window Size: Specify the initial window size. By default, it is 1024 MB.
- Maximum Frame Size: Specify the maximum frame size. By default, it is 16 KB.
- Header Table Size: Specify the header table size. By default, it is 4 KB.
Authentication
- HTTP Authentication using NTLM: This uses a secure challenge/response mechanism that prevents password capture or replay attacks over HTTP. However, the authentication is per connection and will only work with HTTP/1.1 persistent connections. For this reason, it may not work through all HTTP proxies and can introduce large numbers of network round trips if connections are regularly closed by the web server. When enabled, HTTP authentication is not implemented using the NTLM. We support the following version of NTLM: – NTLMv1, NTLM2, or NTLMv2.
- Kerberos Authentication: This is a computer network authentication protocol that works based on ‘tickets’ to allow nodes communicating over a non-secure network to prove their identity to one another in a secure manner. When enabled, Kerberos authentication is not implemented.
Maximum Connection(s) Per Virtual User Setting
Here, the user can specify maximum connections (server, proxy, and user) per virtual user setting. For browser settings, it is set by default.
- Max Connection Per Server: Select the connection required in HTTP 1.0 and HTTP 1.1 servers respectively.
- Max Connection Per Proxy: Select the connection required in HTTP 1.0 and HTTP 1.1 proxy server respectively.
- Max Connection Per User: Select the number of connections needed per user.
Other Settings
- Enable Network Cache: Network caching is the technique of keeping frequently accessed information in a location close to the requester. By selecting this check box, user can enable the network cache statistics.
- Change transaction name if response is severed by Network Cache by adding suffix: To categorize the request that is served from network cache, we discover the separate transaction for that at run time by using the provided suffix. For example, if a transaction is started with the name “payload” and a request is served from network cache, then the transaction name will be “payload_NetCache”.
- Fail page if embedded URL of page fails: When enabled, the page status is set as ‘failed’ if embedded URL of a page fails.
Click the Save Changes ![]() icon on the top right corner of the page to save the settings.
icon on the top right corner of the page to save the settings.
SMTP
The Simple Mail Transfer Protocol is an internet standard communication protocol for electronic mail transmission. Mail servers and other message transfer agents use SMTP to send and receive mail messages. Timeouts are an essential feature of an SMTP implementation. If the timeouts are too long (or worse, there are no timeouts), Internet communication failures or software bugs in receiver-SMTP programs can tie up SMTP processes indefinitely. If the timeouts are too short, resources are wasted with attempts that time out part way through message delivery.
To setup SMTP, click Group Settings ![]() icon on API Configuration beside Request List as shown in Figure 175. Once you click the icon, Group Settings page opens. Select SMTP under (Protocol Settings) as shown in below figure.
icon on API Configuration beside Request List as shown in Figure 175. Once you click the icon, Group Settings page opens. Select SMTP under (Protocol Settings) as shown in below figure.
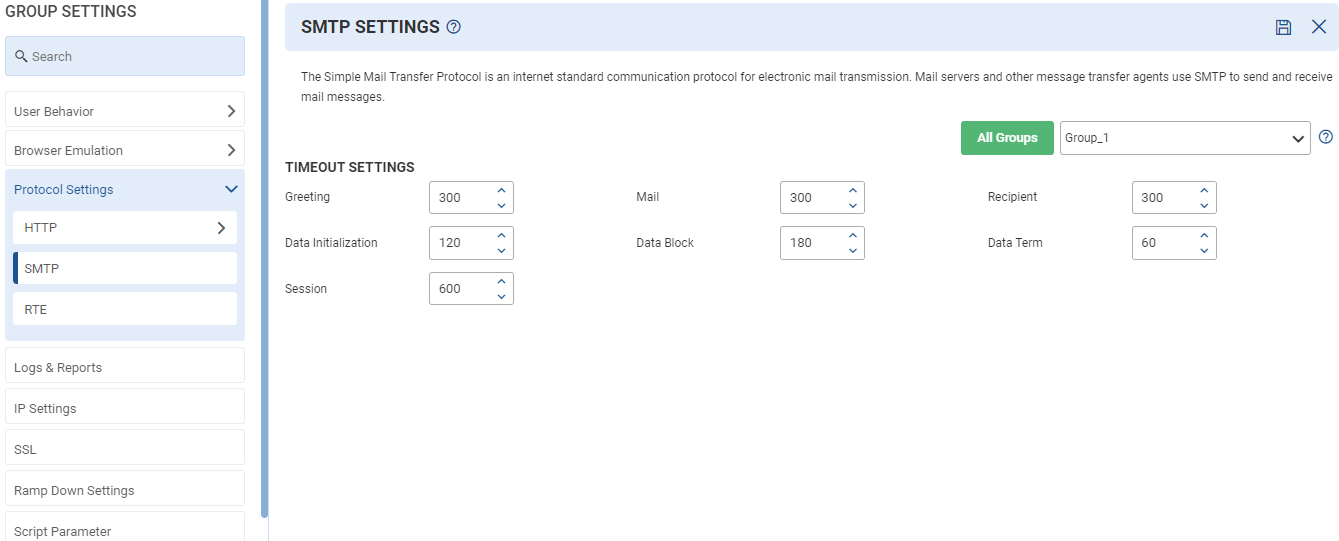
SMTP Settings Options
- Greeting: A Sender-SMTP process needs to distinguish between a failed TCP connection and a delay in receiving the initial 220-greeting message. Many receiver-SMTPs accept a TCP connection but delay delivery of the 220 messages until their system load permits more mail to be processed.
- Mail: It is used to establish the return address. By default, it is 300 seconds.
- Recipient: A longer timeout is required if the processing of mailing lists and aliases was not deferred until after the message was accepted.
- Data Initialization: This is while awaiting the “354 Start Input” reply to a DATA command.
- Data Block: This is while awaiting the completion of each TCP SEND call transmitting a chunk of data.
- Data Term: This is while awaiting the “250 OK” reply. When the receiver gets the final period terminating the message data, it typically performs processing to deliver the message to a user mailbox. A spurious timeout at this point is a waste since the message has been successfully sent.
- Session: After this time, the session is expired. By default, it is 600 seconds.
Click the Save Changes ![]() icon on the top right corner of the page to save the settings.
icon on the top right corner of the page to save the settings.
RTE Settings
Remote Terminal Emulation (RTE) supports the emulation of users who submit input to, and receive output from, character-based applications. An RTE Vuser types character input into a terminal emulator, submits the data to a server, and then waits for the server to respond. An RTE (Remote Terminal Emulator) basically submits the data to a server, and then waits for the server to respond.
To setup RTE, click Group Settings ![]() icon on API Configuration beside Request List as shown in Figure 175. Once you click the icon, Group Settings page opens. Select RTE under (Protocol Settings) as shown in below figure.
icon on API Configuration beside Request List as shown in Figure 175. Once you click the icon, Group Settings page opens. Select RTE under (Protocol Settings) as shown in below figure.
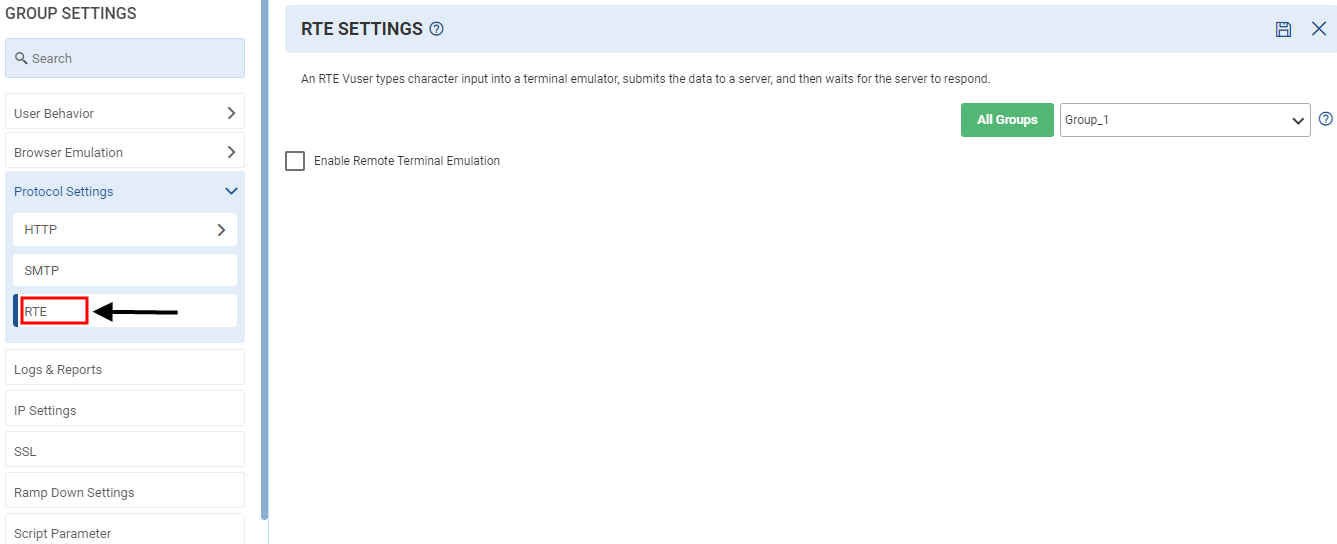
Enable Remote Terminal Emulation to implement the protocol. Currently, the following protocols are implemented:
- SSH
- TN3270(display and display less)
User can check the box if he wants Open Display on the Local machine.
Click the Save Changes ![]() icon on the top right corner of the page to save the settings.
icon on the top right corner of the page to save the settings.
Logs & Reports
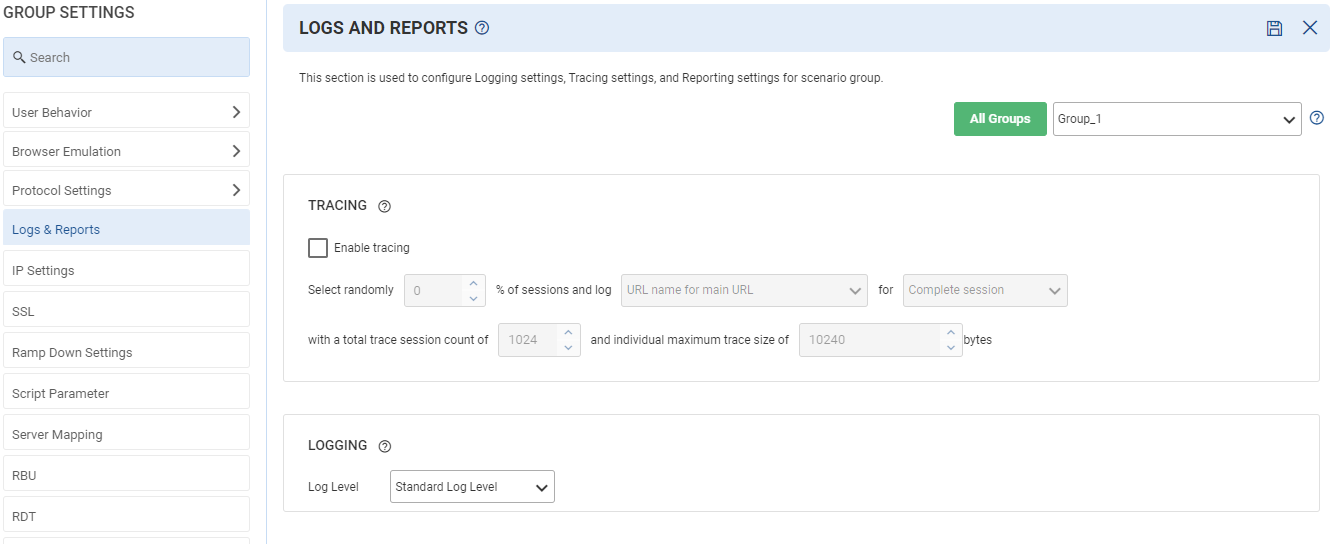
This section is used to configure Logging settings, Tracing settings, and Reporting settings for scenario groups. Each test run is assigned a sequentially generated number. For each test run, a log directory is created by the name TRxxx, where xxx is the test run number under the logs directory. Test run logs directory contains logs. Logs are created for storing record of any test run.
To setup Logs & Reports, click Group Settings ![]() icon on API Configuration beside Request List as shown in Figure 175. Once you click the icon, Group Settings page opens. Select Logs & Reports as shown in below figure.
icon on API Configuration beside Request List as shown in Figure 175. Once you click the icon, Group Settings page opens. Select Logs & Reports as shown in below figure.
Logs and Reports Options
Tracing
Tracings are important logs, such as request, response, response body, and parameterization information showing in the pagedump UI.
Users just have to enable the traces to see them. Tracing settings are group-based. Users can specify different settings for different scenario groups.
- Select Session: Randomly select the % of session is to be used for tracing.
- Trace Level: Possible options for trace-level can be:
- Only URL names are enabled: When selected, only URL information is displayed in page request in the pagedump UI.
- Only URL request and response files are enabled: When selected, request and response is displayed in the pagedump UI.
- URL request, response and parameter substitution are enabled: When selected, request, response, and parameter information is displayed in the pagedump UI.
- URL request, response, parameter substitution, and page dump are created: When selected, request, response, parameter information, and page dump is displayed in pagedump UI.
- Trace Session: It specifies the condition when the trace messages are logged. Possible options are:
- Trace complete sessions (default): When enabled, trace information of all executed pages is displayed in the pagedump UI.
- Trace only fails page/Transaction: When enabled, trace information of all failed pages/transactions is displayed in the pagedump UI.
- Trace complete session if any page or transaction is fail: When enabled, trace information of all pages/transactions of failed sessions is displayed in pagedump UI.
- Trace Page, if header octet stream found in Response: Octet stream refers some binary data in response, such as
“Content-Type: application/octet-stream”
Content-Disposition: attachment; filename=”picture.png”
The user is required to save it (for example, picture.png) on the disk. By using this option, a user can save up to 1024 parameters values and save up to 10240 bytes of data.
Trace Session Size: Select the maximum size of the trace in bytes
Logging
Logging settings control what logs are logged in the test run log. Logged messages have a log level associated with it. Log level specifies the verbosity of the message. Messages with higher log level represent higher level of verbosity.
Log level specifies up to which level logs are enabled. All messages belonging to log-level and below are enabled. Possible options of log level are:
- Only logs logged with Standard Log Level are enabled (default).
- Logs with Standard and Extended log level are enabled.
- All logs (standard, extended and debug) are enabled.
Reporting
In the Reporting section, you can specify how much percentage of DDR records need to be logged in the database.
- Enable drill down reports (diagnostics) for % of sessions: In this field, you can specify the percentage of sessions for which data will be captured. By default, the value of this field is set to 1%.
- Value can be specified in the range of 1% to 10%. If configured outside this range, LOAD TEST will set and update this value to 1% by giving an appropriate message.
- If this field is not configured, it will be considered with default value as 1%.
- For debug tests, 100% sessions will be captured in the drill down reports. Debug test is a smoke or validation test with following schedule:
- Maximum 10 Virtual Users or 100 session/minute rate.
- Maximum duration of 5 minutes or 100 sessions.
Note: For smoke/debug tests, 100% sessions will be captured for drill down reports. Refer Group based settings -> Developer Options -> Smoke/Validation Test Criteria.
Click the Save Changes ![]() icon on the top right corner of the page to save the settings.
icon on the top right corner of the page to save the settings.
IP Settings
There is a need for LOAD TEST to support multiple sources IP addresses for the following reasons:
- Real users use different source IP addresses and hence to emulate real-world scenarios, LOAD TEST can generate virtual users with different source IP addresses.
- When LOAD TEST generates a very high connection rate, the system can run short of IP addresses/port combinations for creating new connections. Ports are limited to 64K and hence having several sources of IPs may be required.
To setup IP Settings, click Group Settings ![]() icon on API Configuration beside Request List as shown in Figure 175. Once you click the icon, Group Settings page opens. Select IP Settings as shown in below figure.
icon on API Configuration beside Request List as shown in Figure 175. Once you click the icon, Group Settings page opens. Select IP Settings as shown in below figure.
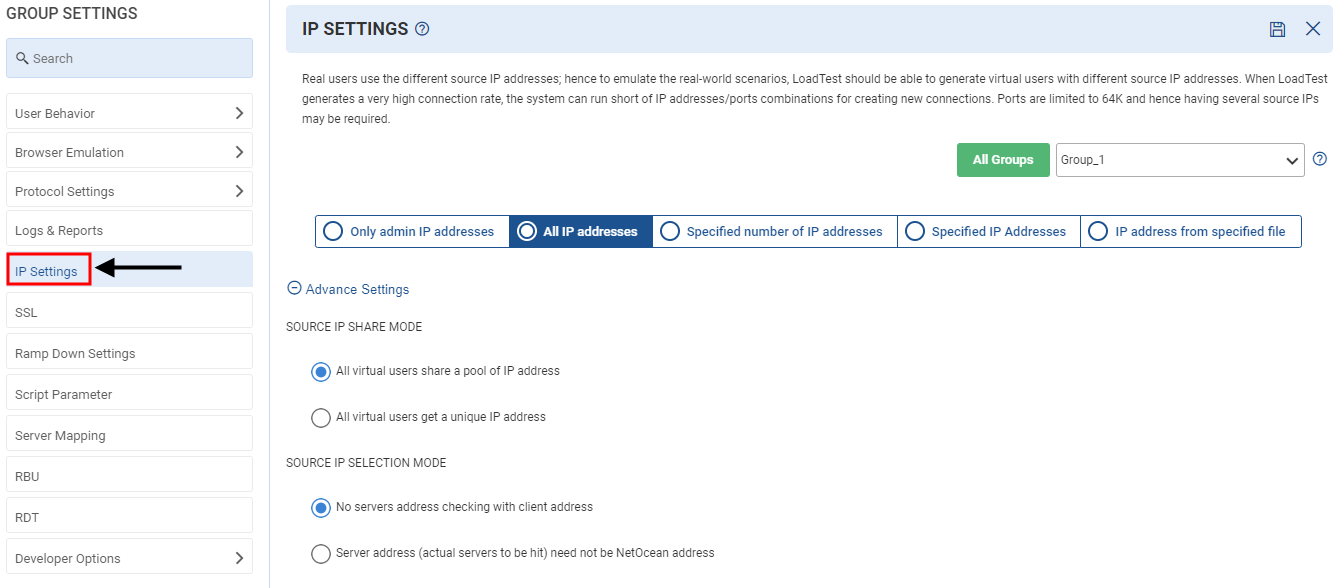
IP Settings Option
This section provides different options for selecting the source IP. Select any one option from the list of available options:
- Use only Admin IP address: Only the Admin IP address is used as source IP for load generation while running a test in LOAD TEST.
- Use all Load Interface IP addresses: All the Secondary IPs listed within the Primary (Admin) IP are used for load generation.
- Use specified number of Load Interface IP addresses: The specified number of load interface IP addresses is captured from the top within the Secondary IPs list. For example, if there are 50 IPs in the secondary IPs list and the user has mentioned using only 10 IPs, then the top 10 IPs are used for load generation and the rest are ignored.
- Specified IP Addresses: The user needs to select the IP address list from the drop-down and provide the Start IP address and Number of IP addresses to be used. Make sure IPs should belong to the same interface and the number of IPs to be used should be within the range of IPs. For example, in IP address list, if Start IP is 199.99.95.1 and Max IPs are 10, then the user can specify the Start IP as 199.99.95.1 and the number of IP addresses as 1 to 10. Specifying numbers beyond 10 are not allowed in this case.
- Use IP Addresses from the specified file: The IPs specified in a file can be used for IP spoofing. User needs to store the IPs in a file and can use it by using the Browse
Advanced Settings
This section contains some advance level settings based on the source IP selection. Here, the user can specify the source IP share mode and other settings, such as the selection of IP version mode and enable/disabling source IP stats.
Source IP Share Mode
- All virtual users share a pool of IP addresses: All the virtual users share the IPs from the pool of IP addresses. Suppose there are 100 virtual users and listed IPs are 10, then all the 100 virtual users share all the listed IPs for load generation. This option is not available if user selects Admin as source IP address as there is only one IP address.
- All virtual users get a unique IP address: No virtual users share the IPs from the pool, a unique ID is assigned to them instead. Suppose there are 100 virtual users and listed IPs are 10, then those 10 virtual users can use the unique 10 IPs out of 100 listed IPs. This option is not available if user selects Admin as source IP address as there is only one IP address.
Source IP Selection Mode
Select any of the following as per the requirement:
- No servers address checking with client address.
- Server address (actual servers to be hit) need not be a NetOcean address.
- Server address (actual servers to be hit) must be NetOcean address.
Other Settings
- Enable Source IP address bases Metrics: When enabled, the user can see data distribution in the graph, such as how much load is generated from each IP, how many virtual users used that IP, and so on.
- Number of Load Interface IP Address: The user can specify the version mode either IPv4 or IPv6. If the version mode is not known, the user can select “Auto”. This automatically selects the version mode, which is used by the interface.
Note: There is a scenario in which multiple scripts are using a single assigned IP. In order to get the correct analysis, all of these scripts are grouped under a single request group.
Click the Save Changes ![]() icon on the top right corner of the page to save the settings.
icon on the top right corner of the page to save the settings.
SSL Settings
Secure Sockets Layer (SSL) is the standard security technology for establishing an encrypted link between a web server and a browser. This link ensures that all data passed between the web server and browsers remain private and integral.
To setup SSL Settings, click Group Settings ![]() icon on API Configuration beside Request List as shown in Figure 175. Once you click the icon, Group Settings page opens. Select SSL Settings as shown in below figure.
icon on API Configuration beside Request List as shown in Figure 175. Once you click the icon, Group Settings page opens. Select SSL Settings as shown in below figure.
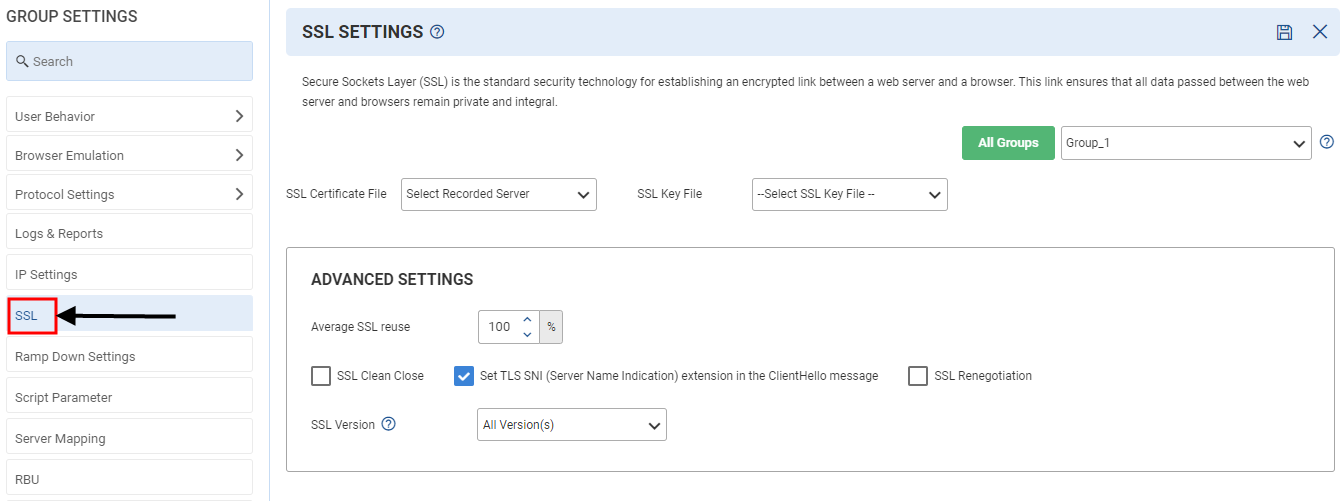
SSL Options
- SSL Certificate: An SSL certificate is a digital certificate that authenticates a website’s identity and enables an encrypted connection. Select the SSL certificate file from the system.
- SSL Key File: Select the SSL Key file from the drop-down list.
Advanced Settings Options
- Average SSL Reuse %: Percentage of SSL sessions to be reused. By default, it is 100.
- SSL Clean Close: SSL clean close only. By default, it is disabled.
- Set TLS SNI (Server Name Indication) extension in the ClientHello message: This allows a server to present multiple certificates on the same IP address and TCP Port number and hence allows multiple secure websites to be served by the same IP address. SNI is used at the time of handshake.
- SSL Renegotiation: It is to renegotiate the SSL.
- SSL Version: All versions include, SSLV3, TLS 1.0, TLS 1.1, TLS 1.2 and TLS 1.3. The server may select any one of these versions.
Click the Save Changes ![]() icon on the top right corner of the page to save the settings.
icon on the top right corner of the page to save the settings.
Ramp Down Settings
Ramp Down defines various methods in which virtual users are ramped down. Ramp down in simple words means to slow down.
To setup Ramp Down Settings, click Group Settings ![]() icon on API Configuration beside Request List as shown in Figure 175. Once you click the icon, Group Settings page opens. Select Ramp Down Settings as shown in below figure.
icon on API Configuration beside Request List as shown in Figure 175. Once you click the icon, Group Settings page opens. Select Ramp Down Settings as shown in below figure.
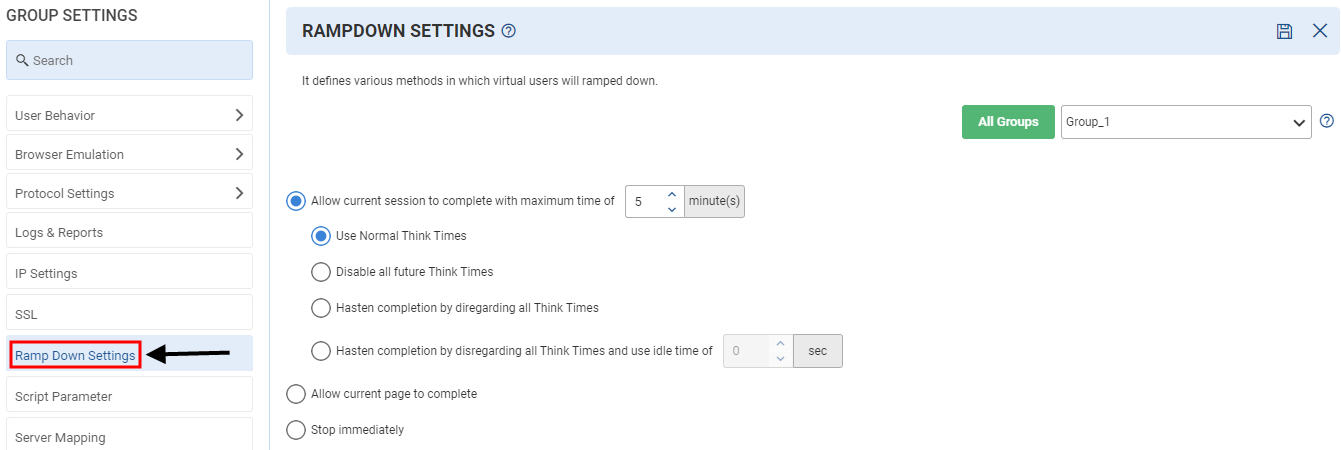
Ramp Down Settings Options
- Allow current sessions to complete: Ramp down settings are applied to allow completion of the current session with maximum time but with the following conditions:
- Use normal Think Times: In this case, the think time already specified for each page is used and complete the session.
- Disable all future Think Times: Once selected, all the future think times are disabled, all pages are executed and the session is completed.
- Hasten completion by disregarding all Think Times: The current session is completed in accelerated mode by ignoring all the think times.
- Hasten completion by disregarding all Think Times and use idle time: In this case also, the current session is completed in accelerated mode by ignoring all the think times. Specify an idle time in seconds.
- Allow current page to complete: Ramp-down settings are applied to allow completion of the current page but with the following conditions:
- User normal idle time: In this case, the page completion takes the normal idle time.
- Hasten completion by using idle time: The page completion is done in accelerated mode by using an idle time specified by the user.
- Stop Immediately: The current session stops immediately.
Click the Save Changes ![]() icon on the top right corner of the page to save the settings.
icon on the top right corner of the page to save the settings.
Script Parameter
Script Parameters specify the attribute name and values used in a script and perform data file management. This feature is used when the user wants to overwrite the value of scratch parameters.
Example: If a script has a scratch parameter “Var1” and the user wants to overwrite its value from the scenario, then the user can assign value to that variable in UI.
To setup Script Parameter , click Group Settings ![]() icon on API Configuration beside Request List as shown in Figure 175. Once you click the icon, Group Settings page opens. Select Script Parameter as shown in below figure.
icon on API Configuration beside Request List as shown in Figure 175. Once you click the icon, Group Settings page opens. Select Script Parameter as shown in below figure.
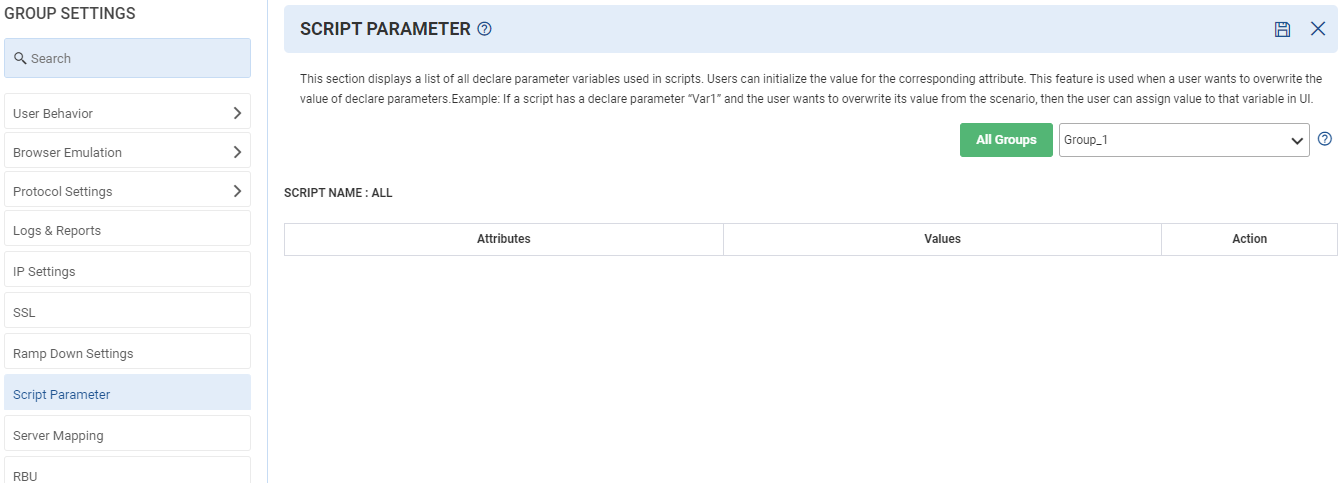
Script Parameter Option
- Attributes: It shows the list of all declared parameters used in the script.
- Values: It shows the values of these attributes.
- Action: Through this user can update/edit or delete any attributes from the list.
Click the Save Changes ![]() icon on the top right corner of the page to save the settings.
icon on the top right corner of the page to save the settings.
Server Mapping
Server mapping is needed to map one recorded host to one or more actual hosts. Recorded-host is the host name as recorded at the time of session recording. Recorded and Actual hosts names are specified in the format host name: port.
For example, 10.10.30.7:81
A special character, dash (-) can be used as a placeholder to specify the server location as the default server location. For example: rediff.com
LOAD TEST maps the recorded host (name of the host where the script was recorded) to the actual host (which is being tested). This maps one recorded host to one or more actual servers and their locations.
The mapping is kept in a table in shared memory. LOAD TEST picks a random entry that maps a given recorded host to an actual server when it makes a new connection and connects to this server. The recorded server > actual server mapping is fixed for a session.
When the URL is a redirection type, the request may be re-directed to another (recorded) host whose mapping is not present in the shared table. Since the script does not contain this new recorded host upfront, it cannot be added in the shared table and it results in an error during parsing of the script.
By default, Recorded hosts are used at the time of test run (session replay). However, a different hostname (for sending requests to) may be specified for the test runs. This may be important for the situations when the session recording is done with one server but may have to run the same session against different servers.
For example, in a typical situation, there may be one server setup for development, one for QA, one or more for performance and one for staging environment etc. In this situation, tests may be recorded once but may be replayed against any server setup, by mapping the recorded server(s) to actual hosts(s).
To setup Server Mapping, click Group Settings ![]() icon on API Configuration beside Request List as shown in Figure 175. Once you click the icon, Group Settings page opens. Select Server Mapping as shown in below figure.
icon on API Configuration beside Request List as shown in Figure 175. Once you click the icon, Group Settings page opens. Select Server Mapping as shown in below figure.
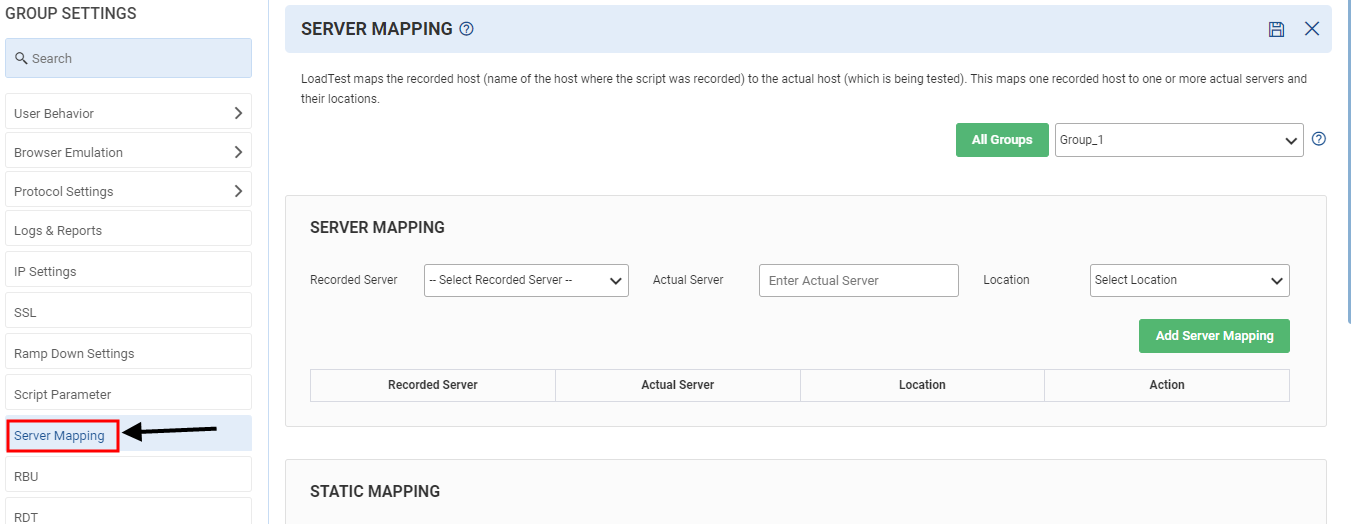
To add a host in server mapping table
- Select recorded server from drop down.
- Enter actual server.
- Select location
- Click on the Add Server Mapping button.
Server Mapping Options
- Recorded Server: Server on which recording is done.
- Actual Server: It is the server where you want to perform the actual testing.
- Location: The default location is assumed as the server location.
- Action: In this you can edit/ update or delete the mapping.
Static Mapping
Static mapping is used where an IP can be assigned corresponding to a host.
- Host: Select the hostname from the drop-down.
- IP: Provide the IP of the host.
Advanced Settings
- Default Server Location: The user can set the default server location from the Default Server Location drop-down list.
- Use same Actual Server in single session (Server Select Mode settings): This option is used to decide whether the same host is needed for both HTTP and HTTPS requests for a particular session.
Add Recorded Host for specified http scheme type
A user can add Recorded Host from Scenario UI in Server Mapping within Advanced Setting to generate load on the specified IP. The user can enter a Recorded Hostname in a text box and select Scheme type from the drop-down list.
Click the Save Changes ![]() icon on the top right corner of the page to save the settings.
icon on the top right corner of the page to save the settings.
Real Browser User
Real Browser User support is a way of simulating Internet access and browsers executing the transaction via a “real” browser (Real Browser Users or RBU). RBUs are heavily loaded as compared to the load generated by typical Virtual Users as an RBU uses a real browser to download web page components.
To setup RBU, click Group Settings ![]() icon on API Configuration beside Request List as shown in Figure 175. Once you click the icon, Group Settings page opens. Select RBU as shown in below figure.
icon on API Configuration beside Request List as shown in Figure 175. Once you click the icon, Group Settings page opens. Select RBU as shown in below figure.
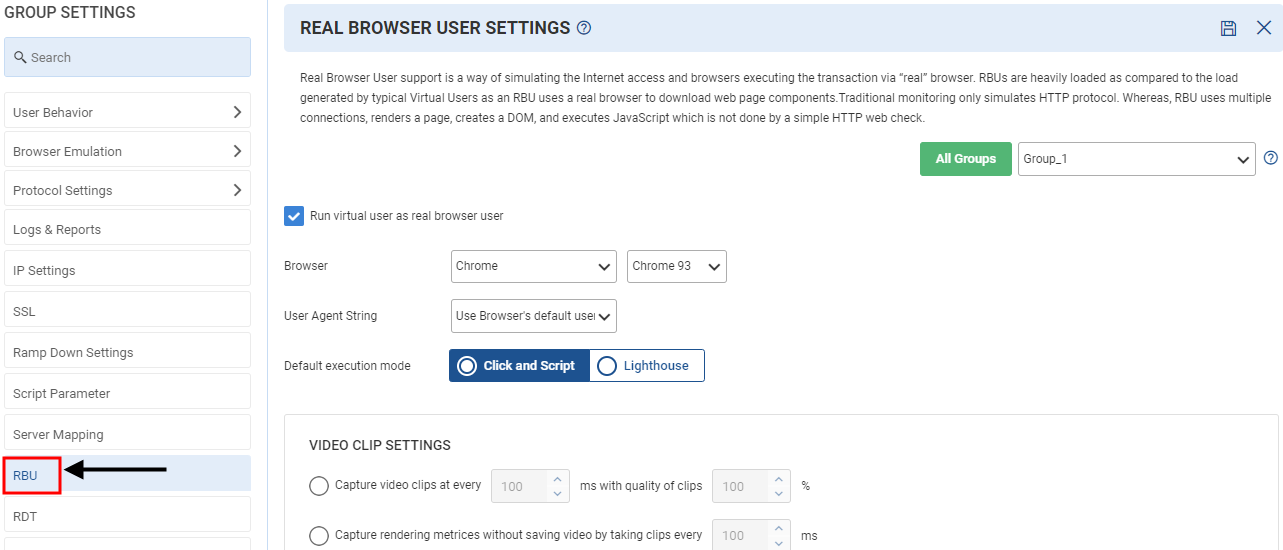
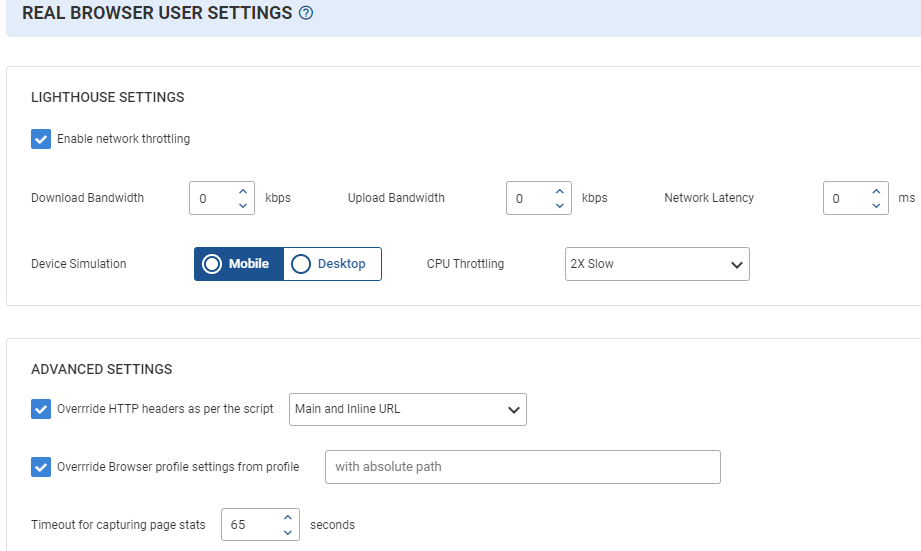
- Enable Network Throttle: You can enable/disable network throttle settings. Enabling the settings also enables download throughput, upload throughput, and network latency. These fields accept only the values that are greater than 0. If you provide values less than and equal to 0, an error message is displayed. Note: Network throttle is enabled only if Lighthouse is enabled.
- Device Simulation: In the Device Simulation settings, you can enable either Desktop or Mobile simulation or CPU Throttling.
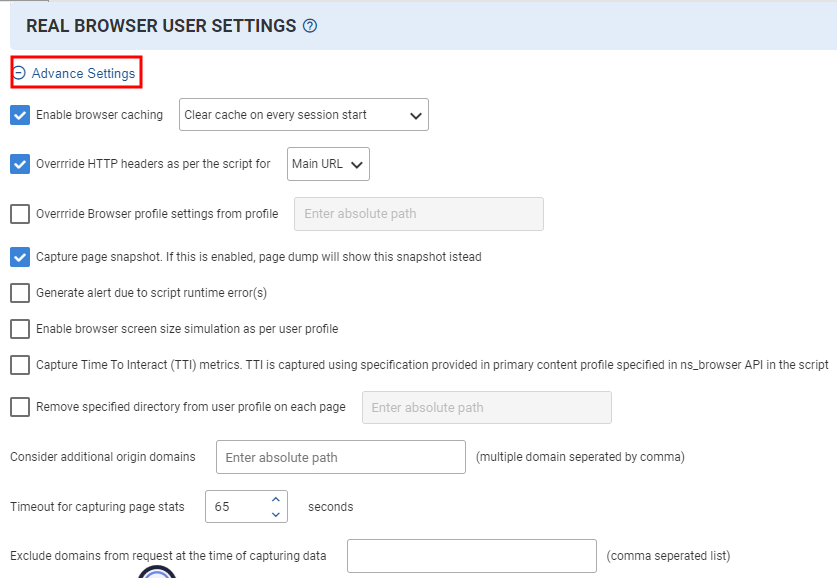
- Advanced Settings
- Enable to override HTTP header as per script in Main URL or in Main and Inline URL.
- Override browser profile settings from the provided profile (with absolute path).
- Select the timeout for capturing page stats in sec.
Click the Save Changes ![]() icon on the top right corner of the page to save the settings.
icon on the top right corner of the page to save the settings.
RDT Settings
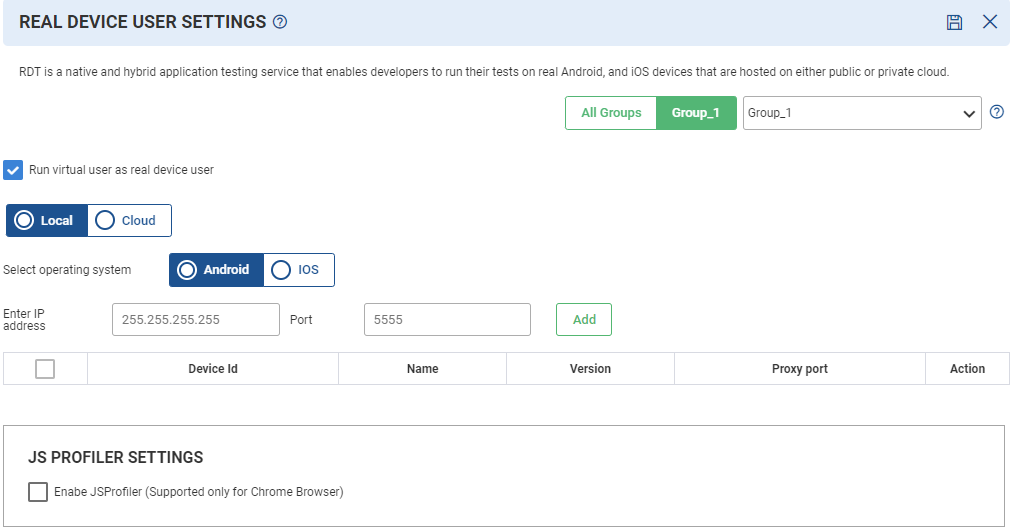
RDT is a native and hybrid application testing service that enables developers to run their tests on real Android, and iOS devices that are hosted on the either public or private cloud.
Note: In RDT, you can run session-specific duration only, you cannot run time-based duration.
Real Device User Option
Enable the Run virtual user as real device user option to run tests on real devices. These real devices can be either on a local (physical device) environment or a cloud environment.
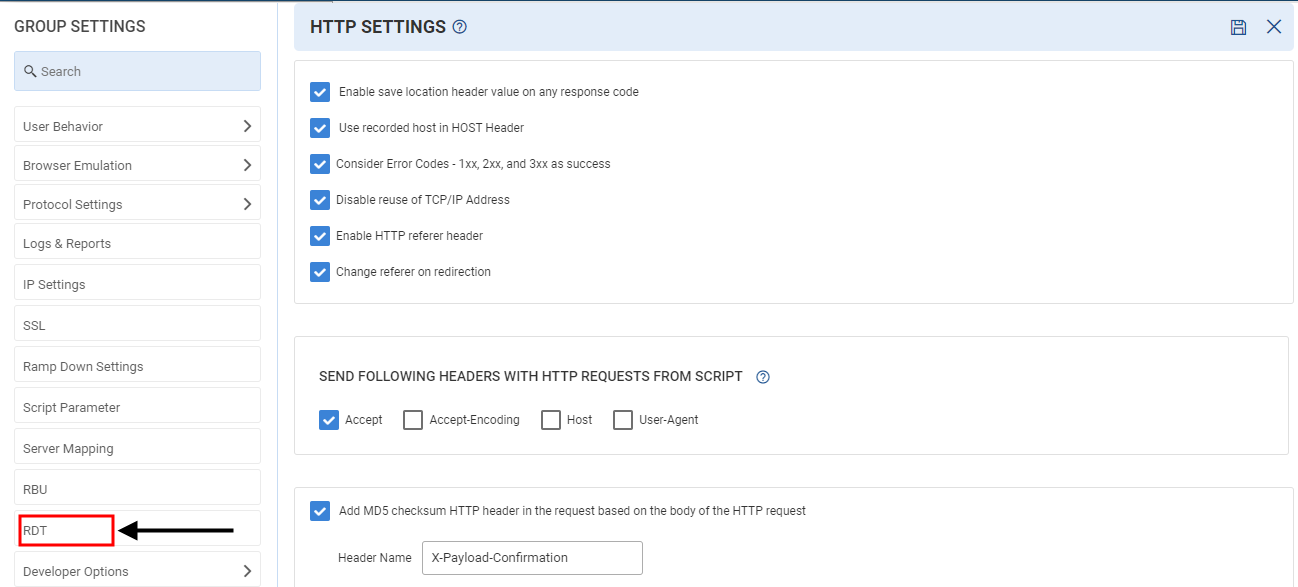
To setup RDT, click Group Settings ![]() icon on API Configuration beside Request List as shown in Figure 175. Once you click the icon, Group Settings page opens. Select RDT as shown in below figure.
icon on API Configuration beside Request List as shown in Figure 175. Once you click the icon, Group Settings page opens. Select RDT as shown in below figure.
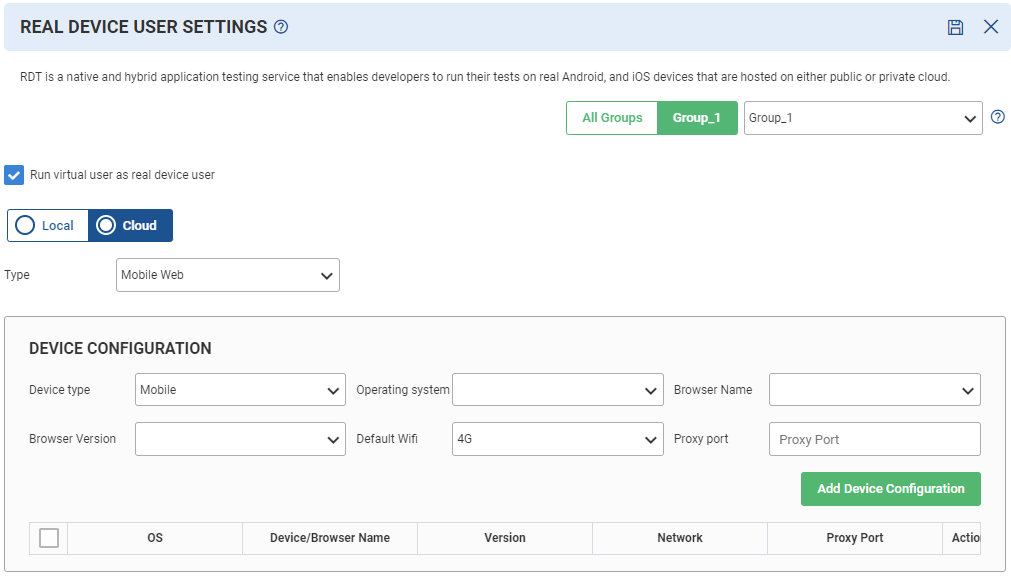
- Mobile Web for enabling the settings for Mobile & Desktop.
- Native App for enabling the settings for Mobile only.
In device configuration we have the following fields:
- Device Type: Select whether the configuration is to be done on mobile or desktop.
- Operating System: Select which OS is to be used for configuration.
- Browser name: Select the browser name from the drop down.
- Browser Version: Choose the version of the browser to be used.
- Default Wifi: Select the Wifi- 2G, 3G or 4G.
- Proxy Port: Enter the port number.
Click the Save Changes ![]() icon on the top right corner of the page to save the settings.
icon on the top right corner of the page to save the settings.
Developer Options
HTTP(s)
HTTP Option
To setup HTTP, click Group Settings ![]() icon on API Configuration beside Request List as shown in Figure 175. Once you click the icon, Group Settings page opens. Select HTTP under Developer Options as shown in below figure.
icon on API Configuration beside Request List as shown in Figure 175. Once you click the icon, Group Settings page opens. Select HTTP under Developer Options as shown in below figure.
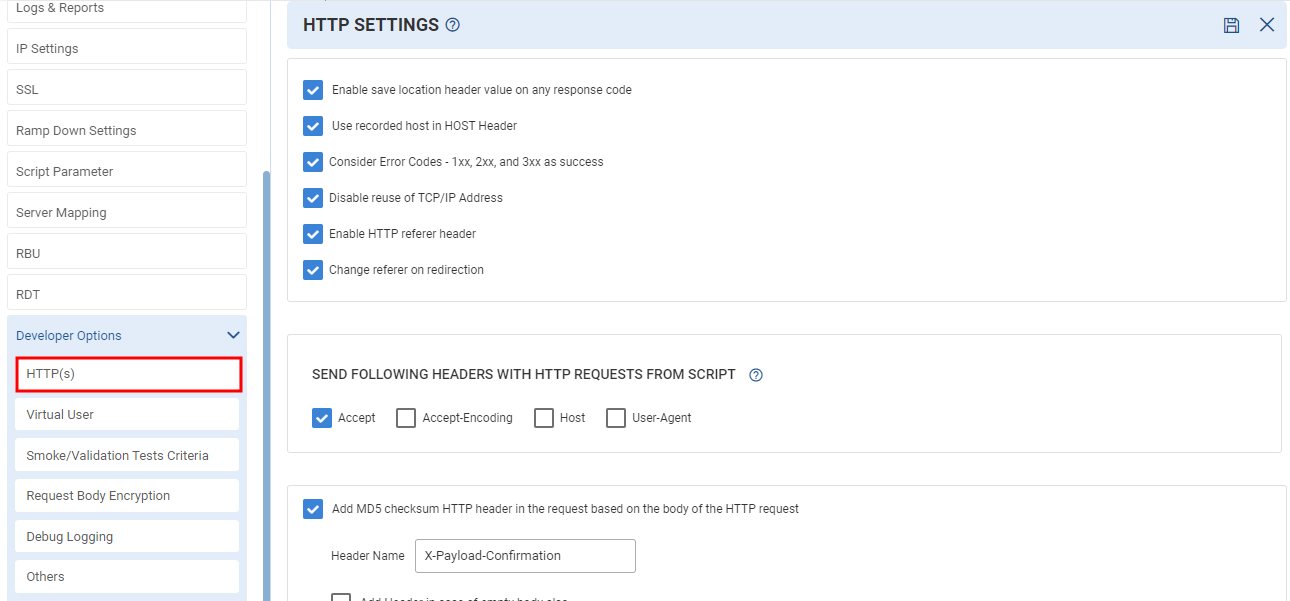
HTTP have following option:
- Enable save location header value on any response code: By default, the location header is displayed with 3xx response code. But sometimes, the location header is displayed with other response codes also and there could be a need to handle the location header.
- Use recorded host in Host Header: When enabled, Recorded Host is used in ‘HOST’ header. By default, the mapped/actual host is used in the ‘HOST’ header.
- Consider Error Codes – 1xx, 2xx, and 3xx as OK: If there is any error generated with error codes 1xx, 2xx and 3xx then LOAD TEST assumes that the request is successful.
- Disable Reuse of TCP/IP Address: By selecting this option, the user can disable the reuse of TCP/IP Address. By default, the reuse of TCP/IP Address is disabled.
- Enable HTTP referrer Header: HTTP referrer identifies the address of the webpage that is linked to the resource being requested.
- Change referer on redirection: This is used to change referrer in case of redirection
Send following headers with http requests from script
Default headers: – Accept, Accept-encoding, Host, User-Agent and Accept language. Load Test sends these headers with the HTTP request. If enabled, then it will not send those enabled headers with the HTTP requests. These default headers are not recorded with the script. If the user wants to record these headers, then they can enable the option from the Advance recording settings.
Add MD5 checksum HTTP header in the request based on the body of the HTTP request: An MD5 checksum is a 32-character hexadecimal number that is computed on a file. When enabled, MD5 checksum HTTP header is added in the request based on the body of the HTTP request.
- Header Name: Specify the name of the header for which the checksum is to be calculated.
- Add Header in case of empty body also: When enabled, if body is empty then header is not passed.
- Add prefix and suffix to the body before calculating MD5 checksum: User can add any prefix and suffix, such as { } or @ @.
Performance Measurement Headers
- Basic Header: Every request will include the header “CavTxName,” the content of which will be the transaction name specified in the script.
- Detailed Headers: The “x-correlation-id” header, which has a Unique id made up of a combination of the Virtual user id, Session instance, Transaction (last page of the transaction), and Page id, will be passed in addition to the basic header. A page instance is used in the absence of a defined transaction.
Click the Save Changes ![]() icon on the top right corner of the page to save the settings.
icon on the top right corner of the page to save the settings.
Virtual User
To setup Virtual User, click Group Settings ![]() icon on API Configuration beside Request List as shown in Figure 175. Once you click the icon, Group Settings page opens. Select Virtual User under Developer Options as shown in below figure.
icon on API Configuration beside Request List as shown in Figure 175. Once you click the icon, Group Settings page opens. Select Virtual User under Developer Options as shown in below figure.
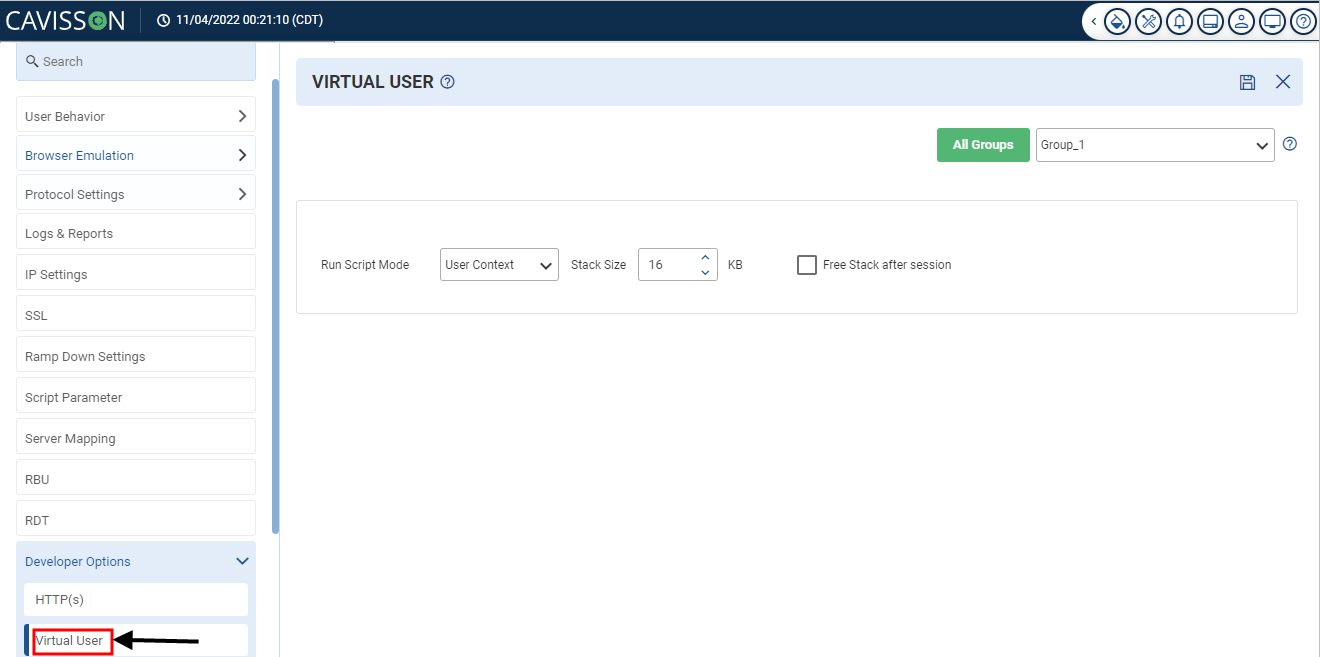
Virtual User Options
- Run Script Mode: This is used to run script mode for Legacy and User Context. There are two modes:
- In the case of User Context, specify the stack size and select the check box to free the cache after the session completes.
- Thread Per User is a collection of Virtual users where each VUser is considered as a thread. It is used for ramping up/ramping down users as specified in scenario when script is run in thread mode. User need to configure settings for Thread pool in Global Settings -> Advanced -> Advanced Settings.
Click the Save Changes ![]() icon on the top right corner of the page to save the settings.
icon on the top right corner of the page to save the settings.
Smoke/Validation Test Criteria
For debug tests, 100% sessions will be captured in the drill-down reports. The default value of smoke validation test criteria:
- Maximum 10 Virtual Users or 100 session/minute rate.
- Maximum duration of 5 minutes or 100 sessions.
To setup Smoke/Validation Test Criteria, click Group Settings ![]() icon on API Configuration beside Request List as shown in Figure 175. Once you click the icon, Group Settings page opens. Select Smoke/Validation Test Criteria under Developer Options as shown in below figure.
icon on API Configuration beside Request List as shown in Figure 175. Once you click the icon, Group Settings page opens. Select Smoke/Validation Test Criteria under Developer Options as shown in below figure.
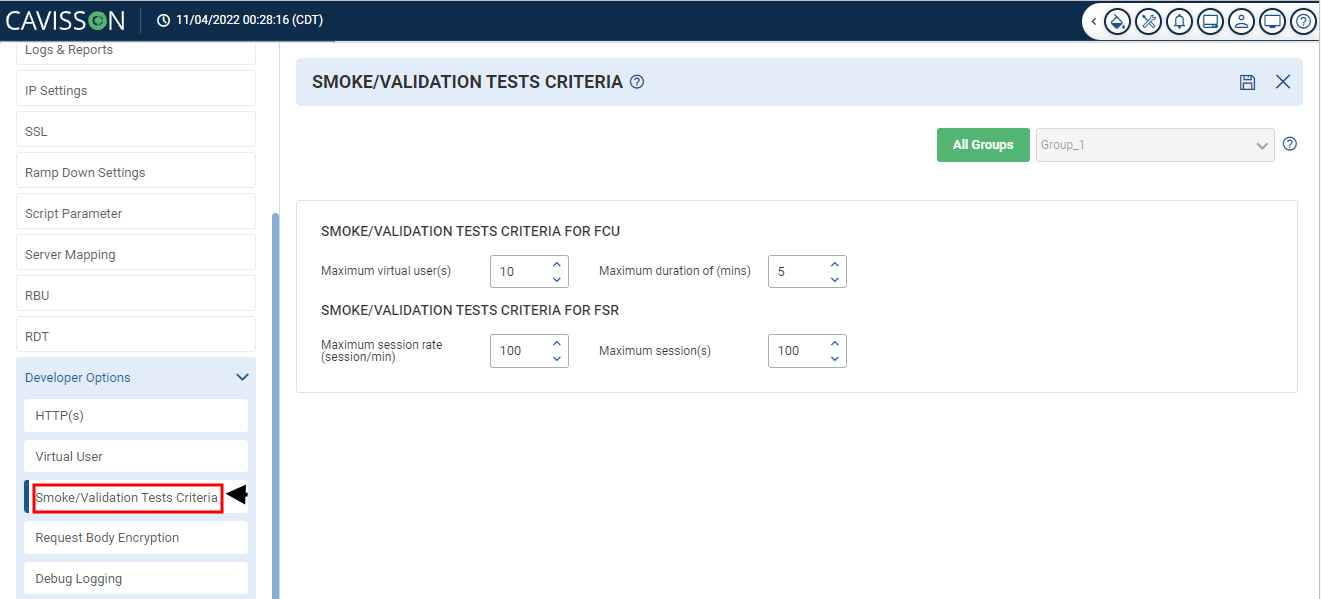
- fixed concurrent user test. For example, if the user gives a maximum of 10 VUsers and 30 minutes, then all tests with durations of less than 30 minutes and VUsers lower than 10 will be regarded as smoke tests. The following fields need to be filled to set the criteria:
- Maximum Virtual Users: Maximum number of virtual Users required for smoke/validation test.
- Maximum Duration: Select the maximum duration required for the smoke/validation test.
- Smoke/Validation Tests Criteria for FSR: This is used to define the smoke test criteria for the fixed session rate test. The maximum session rate and the number of sessions can be set by the user. All tests whose session rate is less than equal to 10 and whose number of sessions is less than 1000 will be regarded as smoke tests, for example, if the user provides 10 sessions per minute and 1000 sessions. The following fields need to be filled to set the criteria:
- Maximum Session Rate(session/min): Enter the maximum number of sessions per minute for the smoke/validation test.
- Maximum Session(s): Select the maximum number of sessions required for the smoke/ validation test.
Click the Save Changes ![]() icon on the top right corner of the page to save the settings.
icon on the top right corner of the page to save the settings.
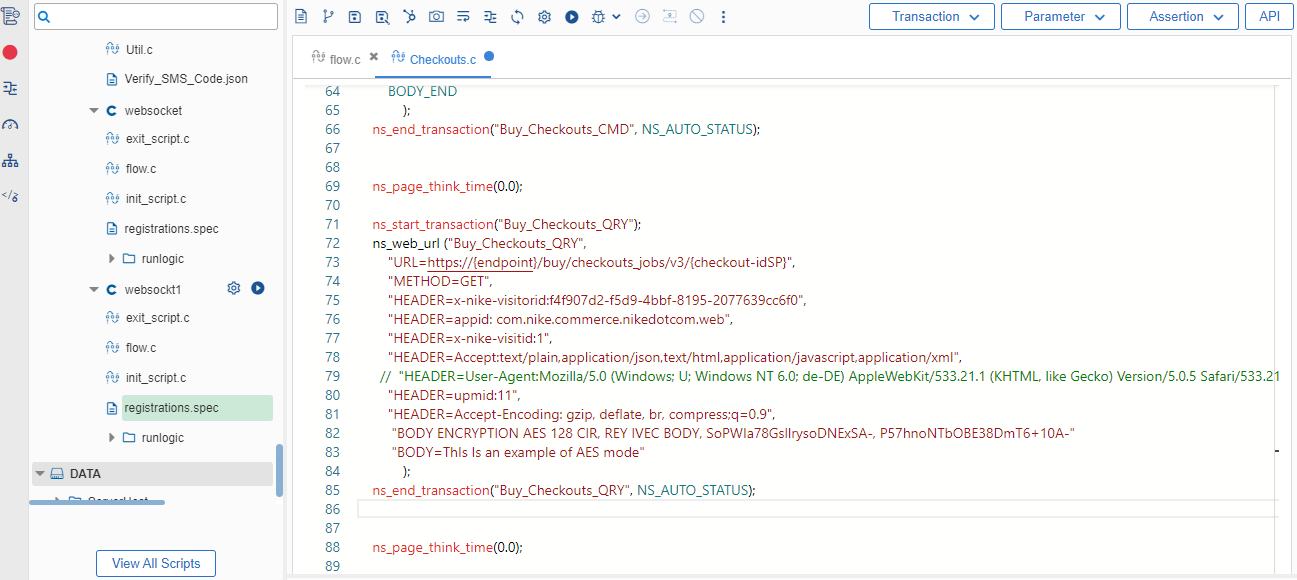
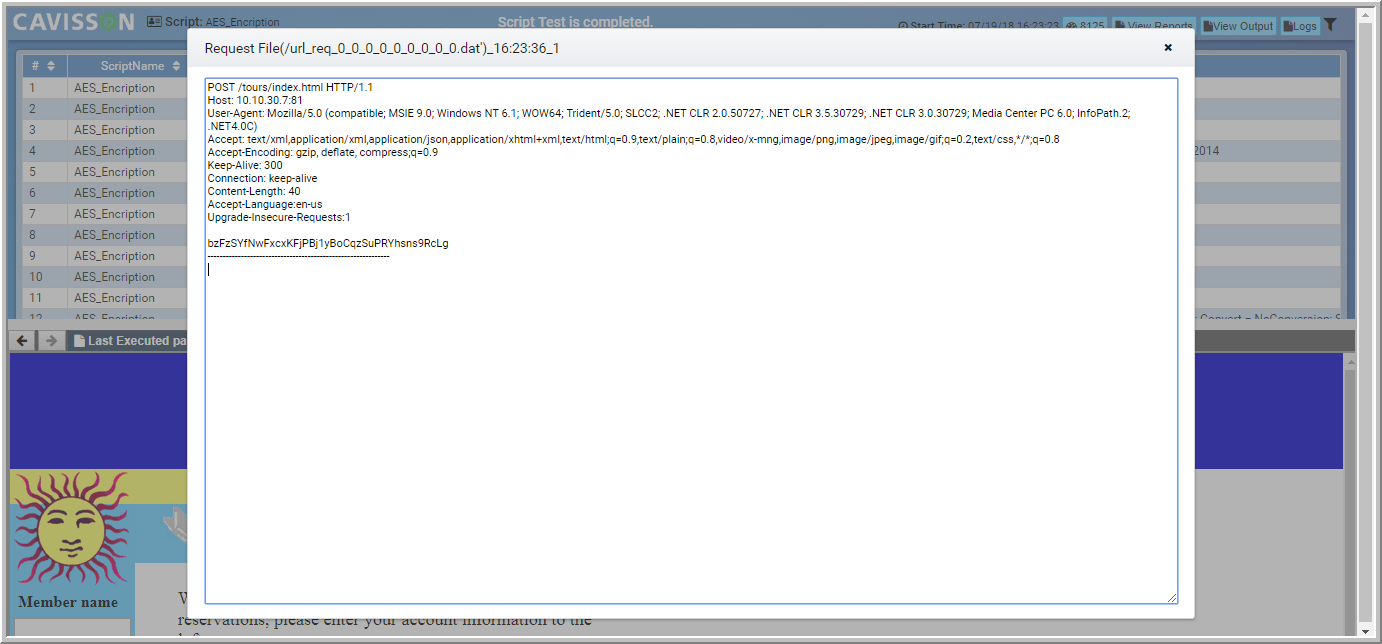
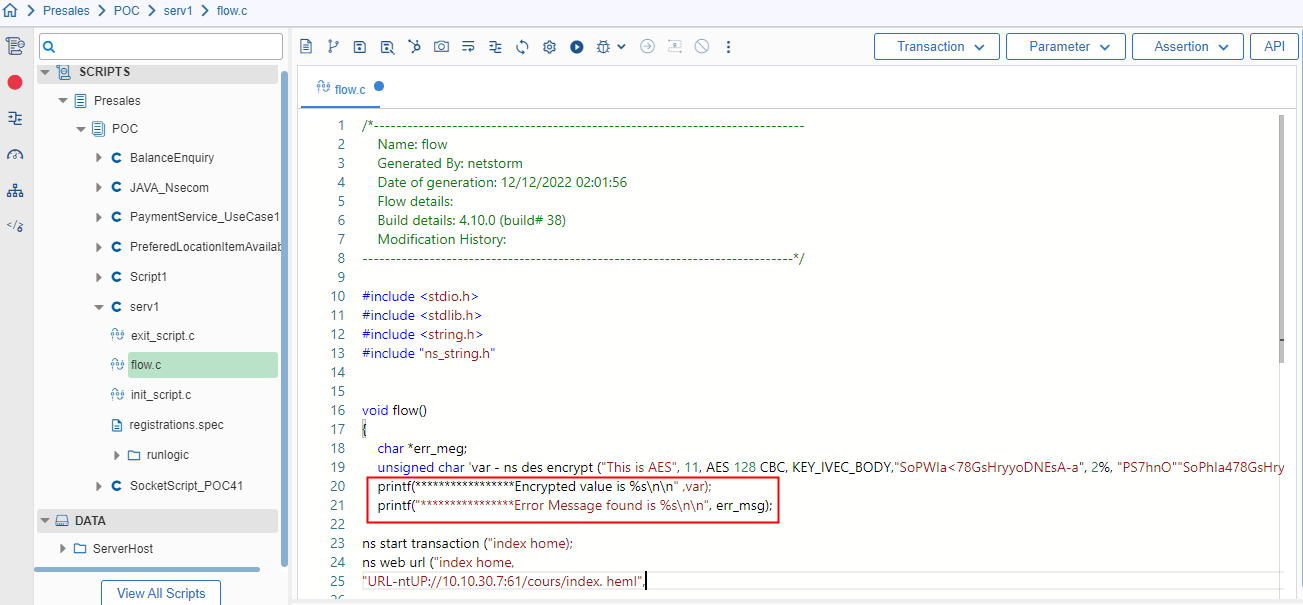
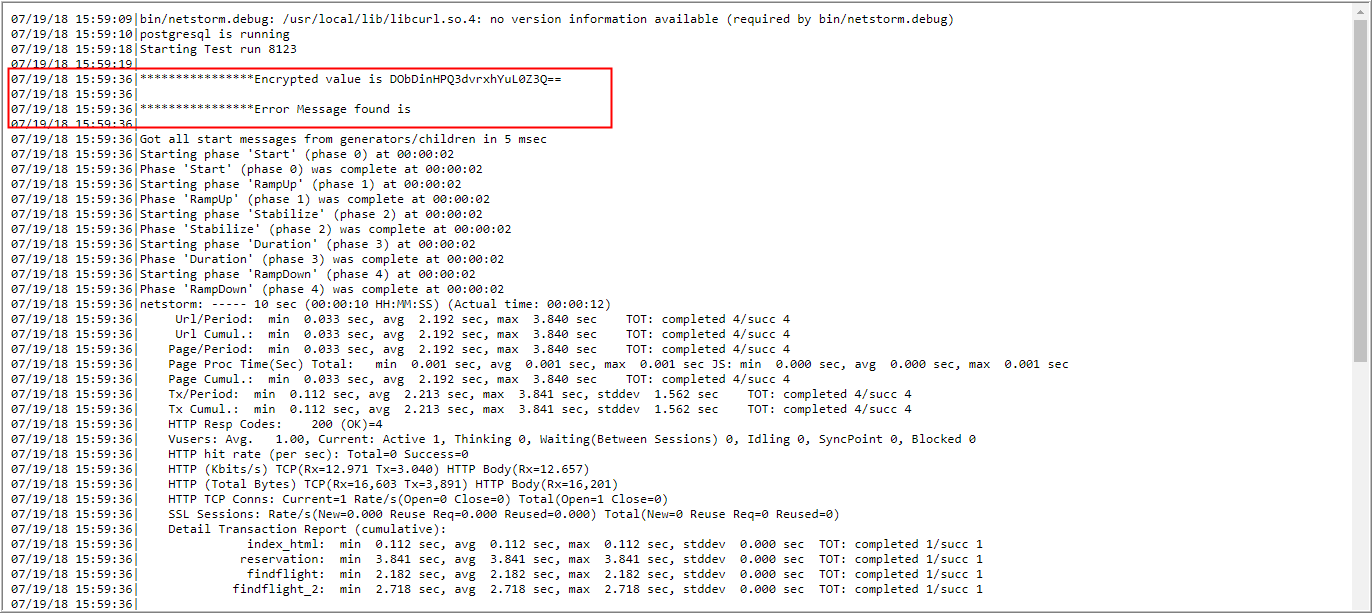
Request Body Encryption
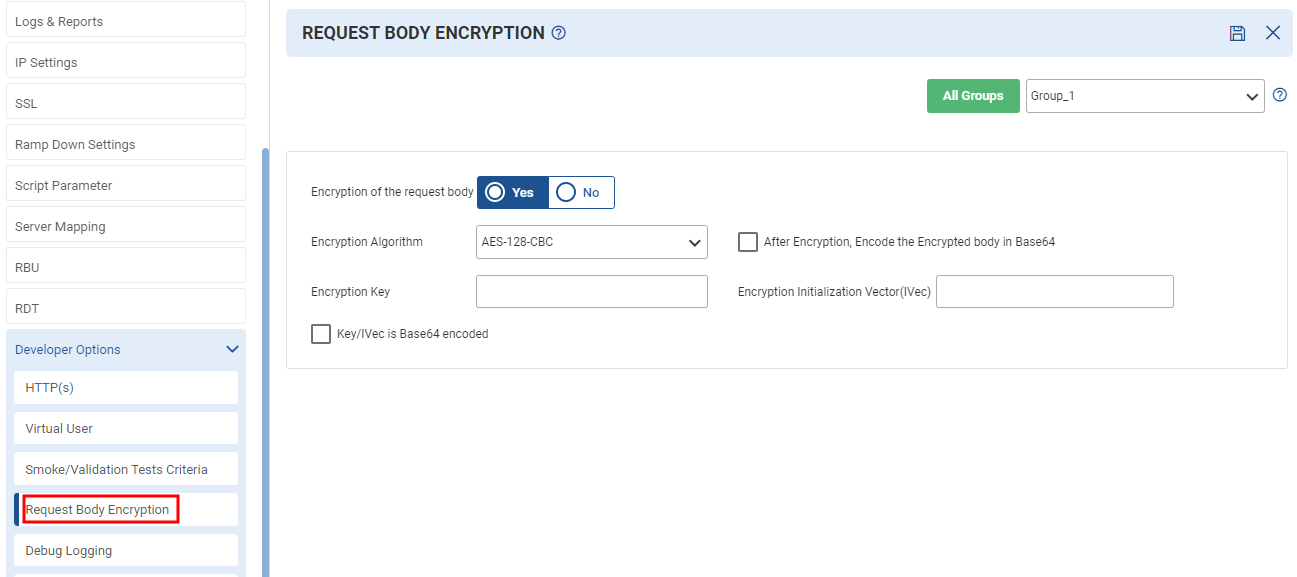
Encryption, is the process of changing information in such a way as to make it unreadable by anyone except those possessing special knowledge (usually referred to as a “key”) that allows them to change the information back to its original, readable form.
Encryption is important because it allows the user to securely protect data to avoid access for anyone else.
To setup Request Body Encryption, click Group Settings ![]() icon on API Configuration beside Request List as shown in Figure 175. Once you click the icon, Group Settings page opens. Select Request Body Encryption under Developer Options as shown in below figure.
icon on API Configuration beside Request List as shown in Figure 175. Once you click the icon, Group Settings page opens. Select Request Body Encryption under Developer Options as shown in below figure.
Click the Save Changes ![]() icon on the top right corner of the page to save the settings.
icon on the top right corner of the page to save the settings.
Debug Logging
To setup Debug Logging, click Group Settings ![]() icon on API Configuration beside Request List as shown in Figure 175. Once you click the icon, Group Settings page opens. Select Debug Logging under Developer Options as shown in below figure.
icon on API Configuration beside Request List as shown in Figure 175. Once you click the icon, Group Settings page opens. Select Debug Logging under Developer Options as shown in below figure.
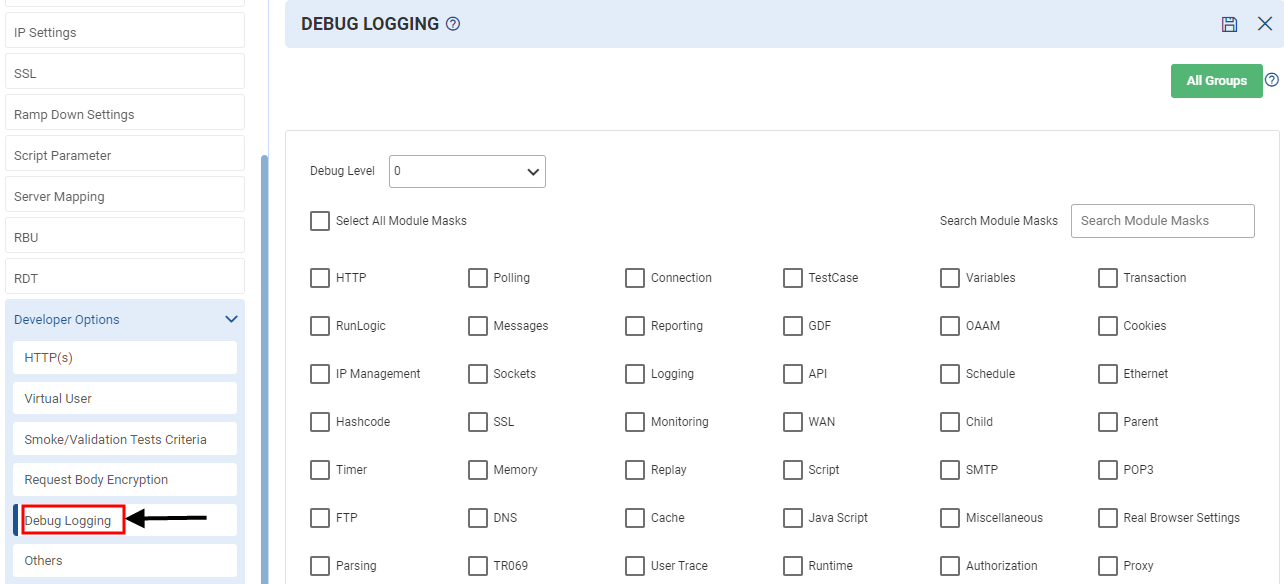
Debug level is used to specify what level of logs user wants to enable for logging. The value of the debug level ranges from 0 to 4.
- 0 – No debug logs enabled (Default)
- 1 – Level 1 debug logs enabled
- 2 – Level 2 debug logs enabled
- 3 – Level 3 debug logs enabled
- 4 – Level 4 debug logs enabled
Module Masks
Since LOAD TEST is having different modules, so for each module, there is a mask specifying the particular module. If user selects the Select All Module Masks check box, all module masks are enabled.
The value of the module mask passed with the “MODULEMASK” setting in the scenario file. User already has some module mask for some modules of LOAD TEST. But there should be a particular modular mask for each module.
SR | MODULE | MASK | DESCRIPTION |
1 | MM_HTTP | 1 | Debug logging of HTTP request and responses |
2 | MM_POLL | 4 | Debug logging of epoll event |
3 | MM_CON | 8 | Debug logging of connection make and break |
4 | MM_TESTCASE | 16 | Debug logging of test case related logs such as for goal based scenario |
5 | MM_VARS | 32 | Debug logging of all variables |
6 | MM_TRANS | 64 | Debug logging of Transaction Parsing |
7 | Combined in MM_TRANS | 128 | Debug logging of Transaction Execution |
8 | MM_RUNLOGIC | 256 | Debug logging of RunLogic |
9 | MM_MESSAGES | 512 | Debug logging of Message communication between master to client and parent to childs |
10 | MM_REPORTING | 1024 | Debug logging of report modules (applicable for summary.html only presently) |
// The MASKS for below MODULES should also be there. | |||
11 | MM_GDF | 2048 | Debug logging of GDF |
12 | MM_OAAM
| 4096 | Oracle Authentication and Authorization Module |
13 | MM_COOKIES | 8192 | Debug logging of Cookies |
14 | MM_IPMGMT | 16384 | Debug logging of IP Management, Source IP, Server IP selection. |
15 | MM_SOCKETS | 32768 | Debug logging of Socket communication, Cav Modem related code |
16 | MM_LOGGING | 65536 | Debug logging of logging |
17 | MM_API | 131072 | Debug logging of API,s |
18 | MM_SCHEDULE | 262144 | Debug logging of test phases (schedule) RAMPUP_MODE, RAMPUP_RATE, RAMPDOWN, WARMUP, Run Phase, think time, session pacing |
19 | MM_ETHERNET | 524288 | Debug logging of Ethernet packet send and receive |
20 | MM_HASHCODE | 1048576 | Debug logging of creation of hash-code |
21 | MM_SSL | 2097152 | Debug logging of SSL module |
22 | MM_MON | 4194304 | Linmon/Tcpmon/Server Stats/Custom Monitor |
23 | MM_WAN | 8388608 | Code related to WAN simulation |
24 | MM_CHILD | 16777216 | Child |
25 | MM_PARENT | 33554432 | Parent/master |
Table: Modular Mask for Modules
NI* – Not Implemented Yet
Module Mask Configuration
Select the module(s) from the given list for which debug needs to be enabled. Since LOAD TEST is having different modules, so for each module, there is a mask specifying the particular module. If user selects the Select All Module Masks check box, all module masks are enabled.
Click the Save Changes ![]() icon on the top right corner of the page to save the settings.
icon on the top right corner of the page to save the settings.
Others Settings
To setup Other Settings, click Group Settings ![]() icon on API Configuration beside Request List as shown in Figure 175. Once you click the icon, Group Settings page opens. Select Other Settings under Developer Options as shown in below figure.
icon on API Configuration beside Request List as shown in Figure 175. Once you click the icon, Group Settings page opens. Select Other Settings under Developer Options as shown in below figure.
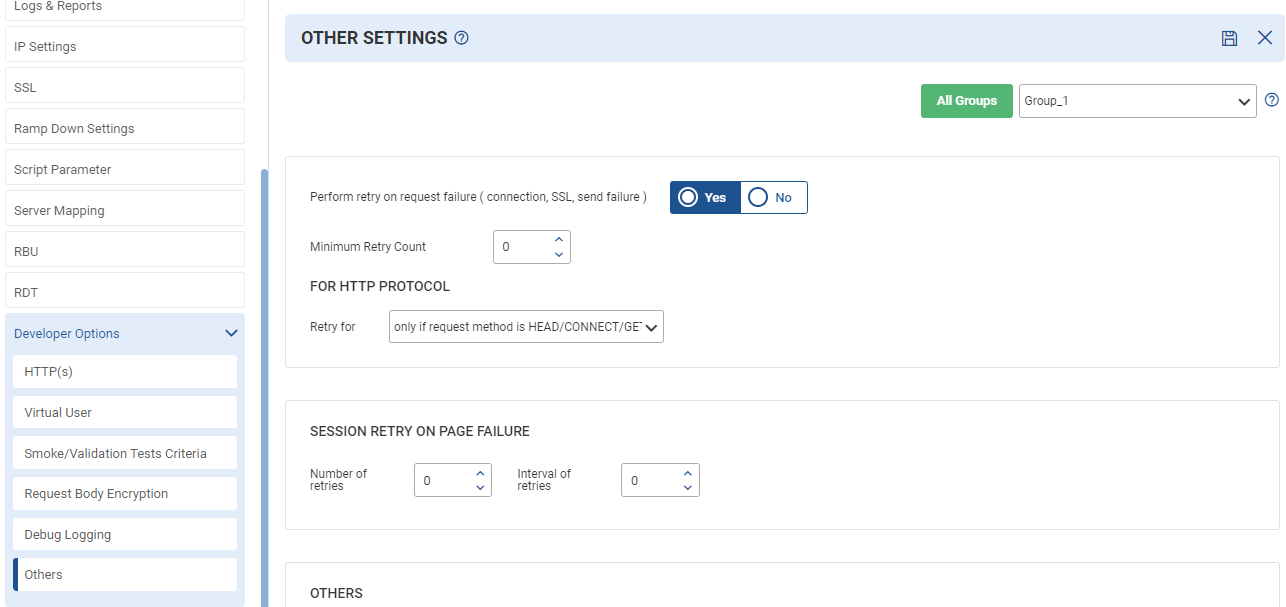
Other Settings Options
If, perform retry on request failure (connection, SSL, send failure) is selected as Yes, then the Load test will retry the request to the server for mentioned minimum retry count. Specifies the following fields:
- Minimum retry count: Specify the minimum retry count required to in case of failure.
- For HTTP Protocol: Retry only in any one of the following cases:
- Only if the request method is Head/connect/get.
- On all request methods.
- Session Retry on Page Failure
- Number of retries: Enter the number of session retries in case of page failure.
- Interval of retries: Select the time interval between the two retries.
- Others
- After an old user completes a session, user connection remains open: This section is to provide the time when the user has completed the session but needs to wait for some before closing all connections.
- Perform DNS Lookup for SUT servers: DNS lookupis a process by which an IP address is returned for a domain name by a DNS You can perform DNS Lookup with the following option:
- Once on Start of test.
- Start of every session(blocking)
- Cache for session
- Refresh on every request
- Cache Time (TTL) (time in sec)
- Start of every session(non-blocking)
- Cache for session
- Refresh on every request
- Cache Time(TTL) (time in sec)
- DNS Lookup protocol
- Perform no validation on response: LOAD TEST performs some validations (size of response) on response. By enabling this, LOAD TEST do not perform any validation on response.
The fields above remain the same if Perform retry on request failure (connection, SSL, transmit failure) is selected as No, with the exception that it does not include the Minimum retry count and HTTP Protocol.
Click the Save Changes ![]() icon on the top right corner of the page to save the settings.
icon on the top right corner of the page to save the settings.