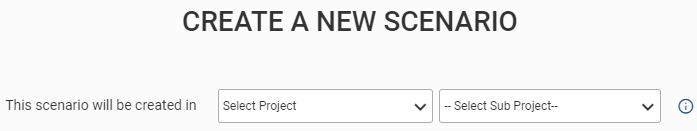
To create a scenario, select the![]() icon as shown in below figure.
icon as shown in below figure.
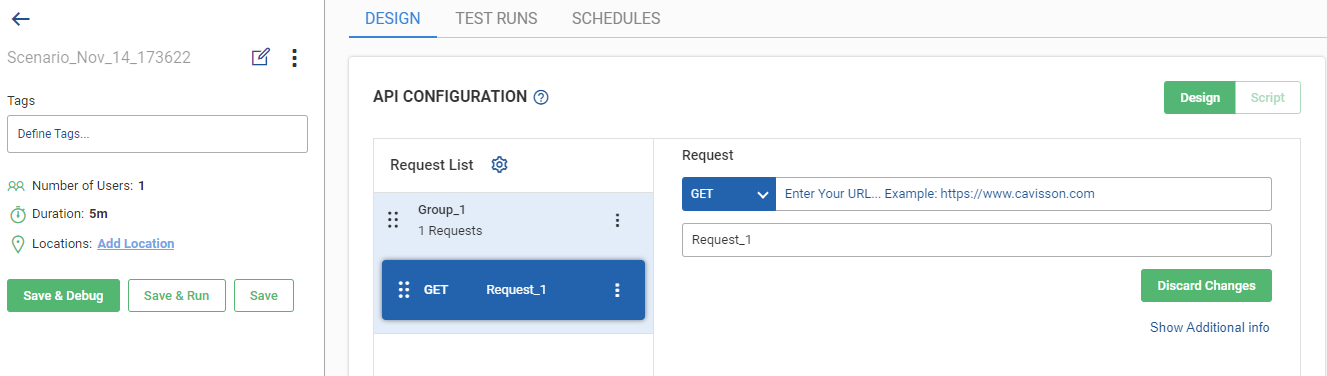
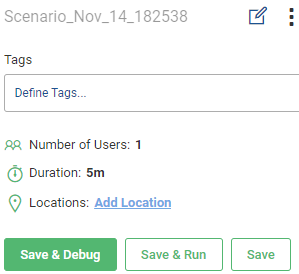
Edit Scenario Name
Whenever scenario is created by default its name will be of following format:
“Scenario_Month_Day_HHMMSS”
For ex: “Scenario_Nov_08_011948”.
You can rename it by clicking the ![]() icon.
icon.
Menu
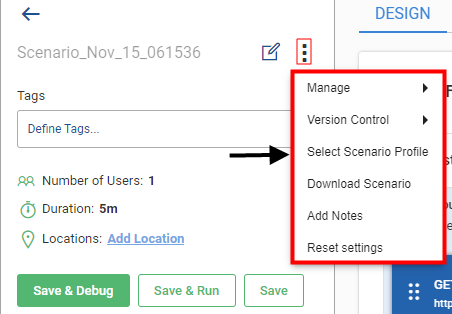
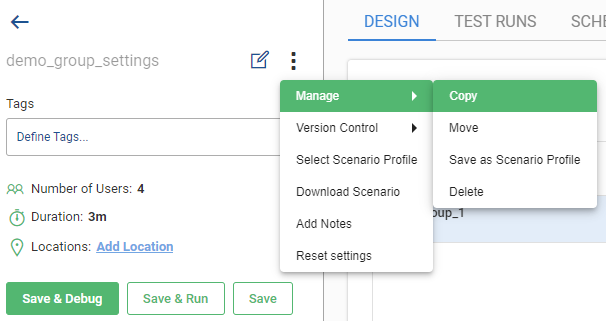
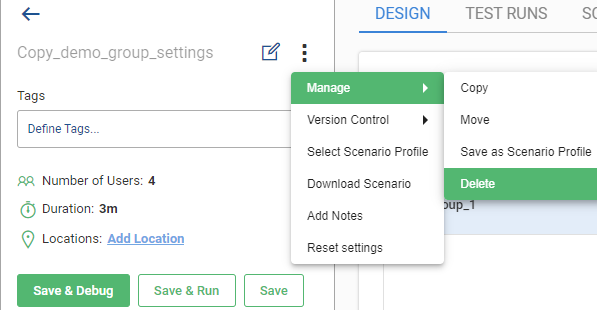
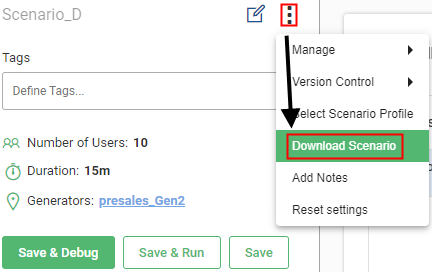
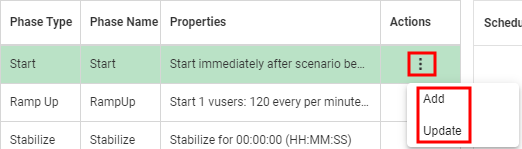
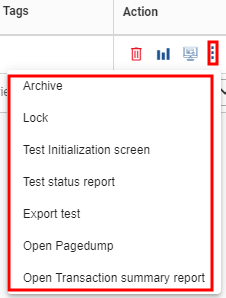
Once you click the kebab menu ![]() , you have the following options as shown in the figure below:
, you have the following options as shown in the figure below:

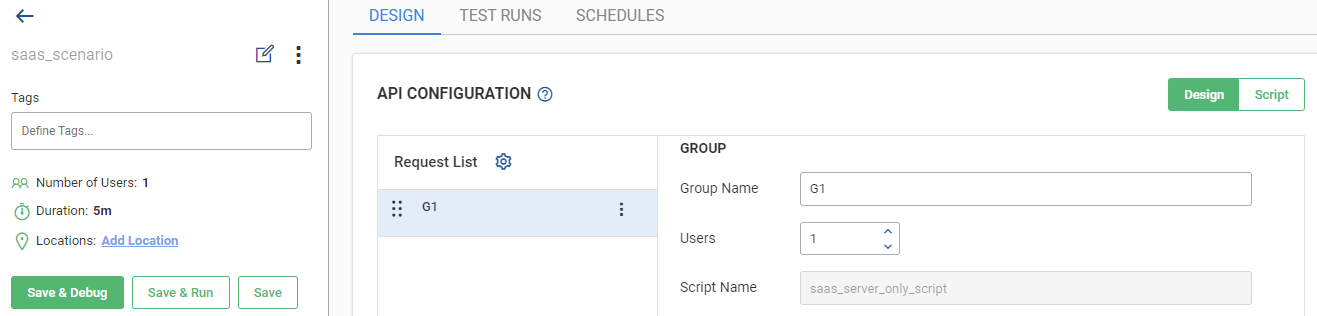

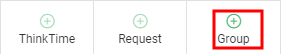
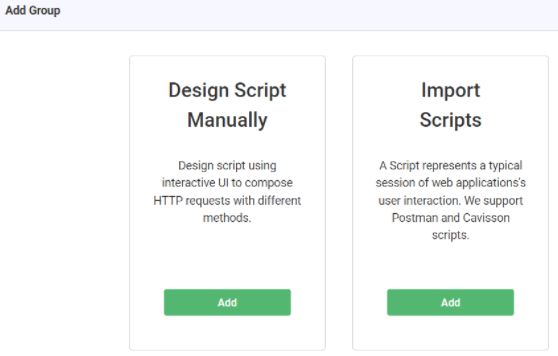
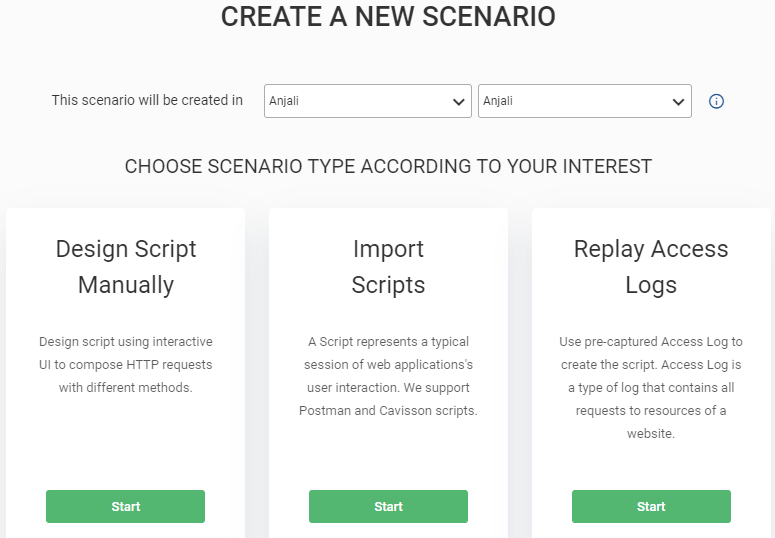
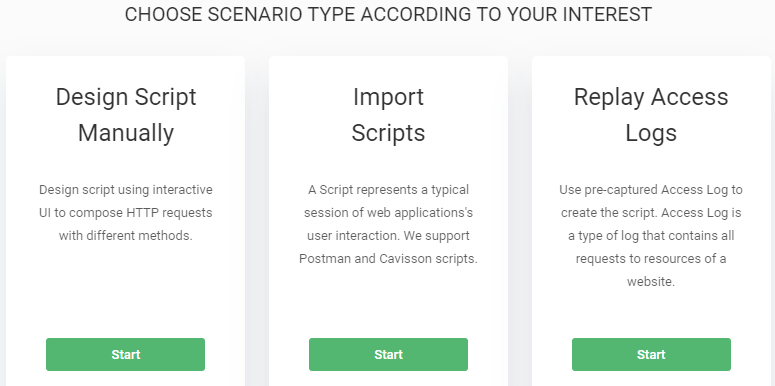
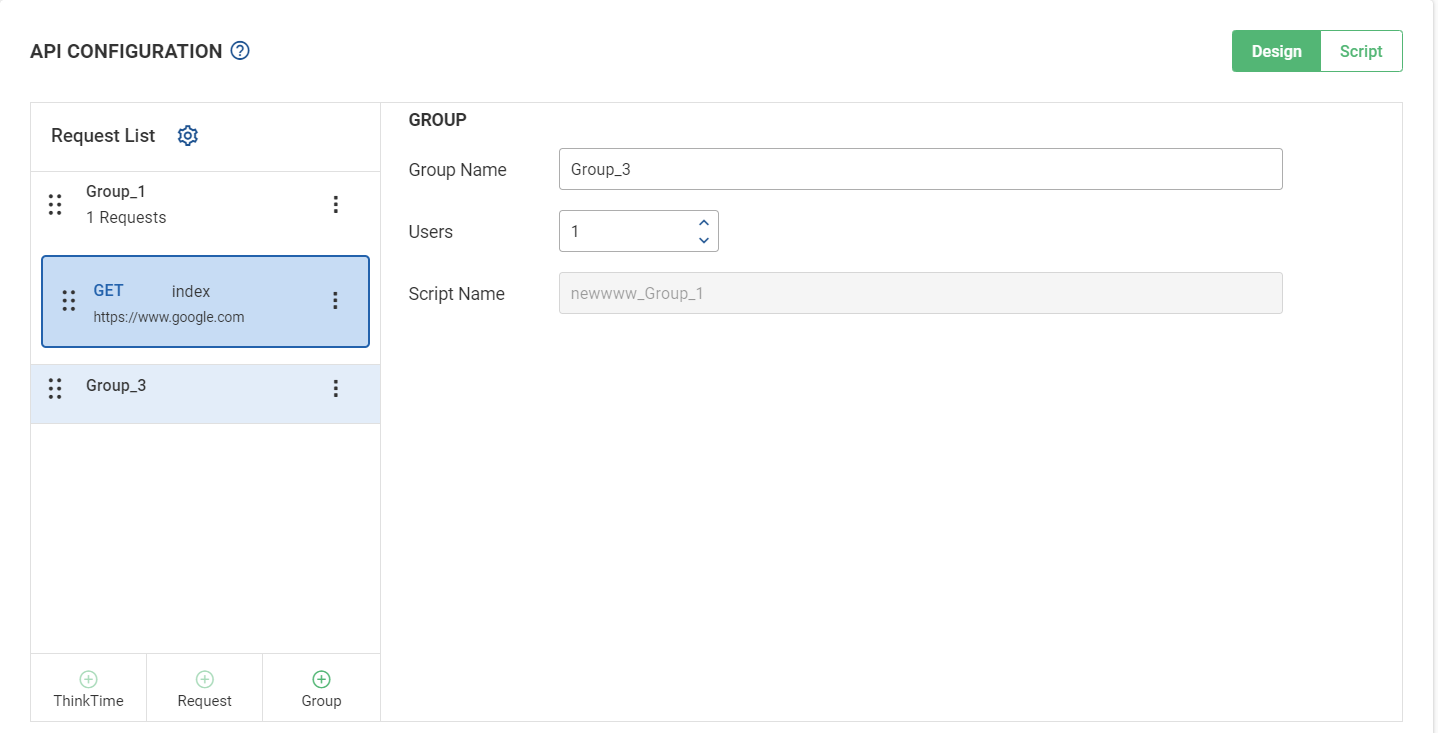
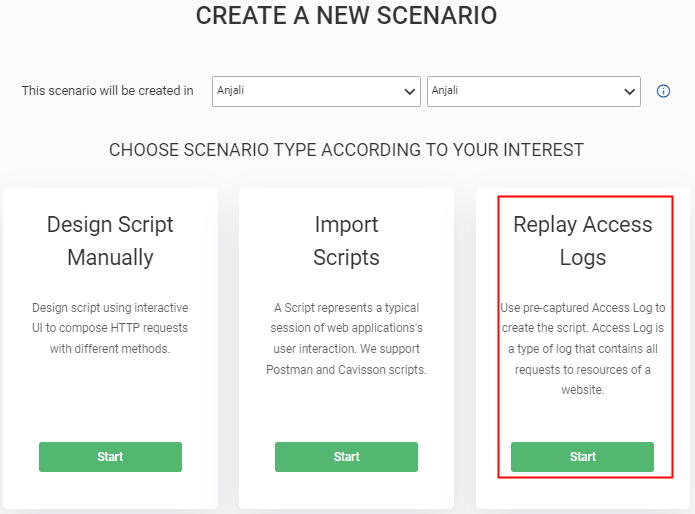
Users have following two options to add a group: ‘Design Script Manually’ and ‘Import Scripts’.
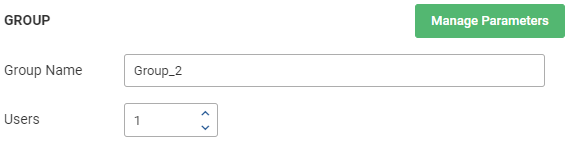
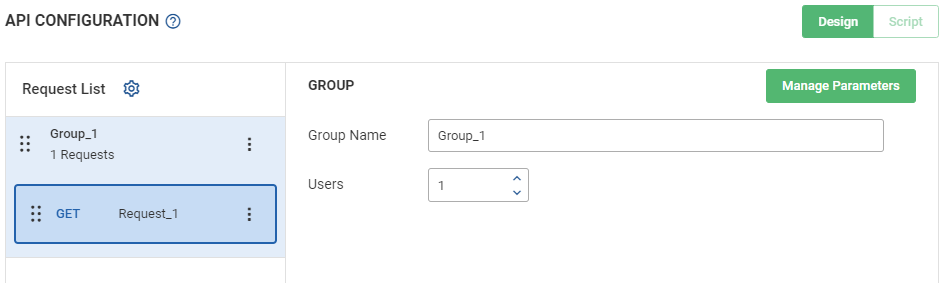
In Design Script Manually, a user can design an API group where he/she can add multiple groups where each group can have multiple requests.
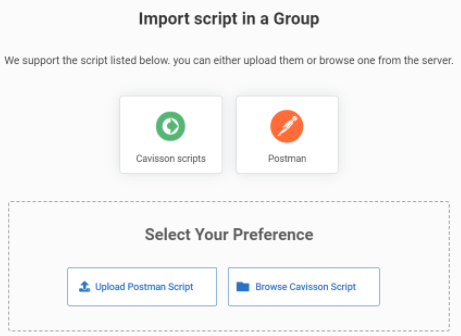
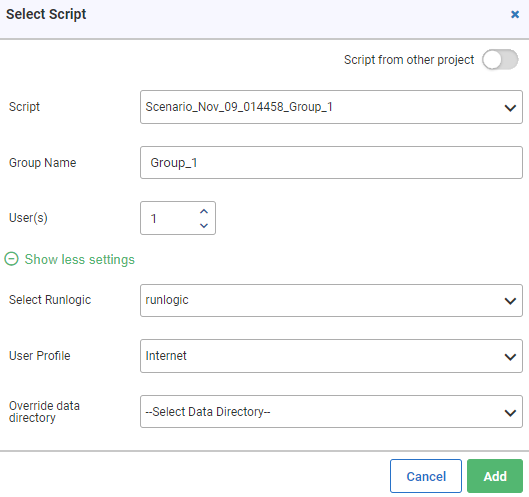
In Import scripts, users can import an existing API script or select an already created script from current workspace or import postman scripts.
In this, we have pre-defined scripts which are: Cavisson Scripts and Postman Scripts.
- Cavisson Scripts are those scripts that are created by Cavisson tools.
- Postman Scripts are those scripts that are created from Postman.
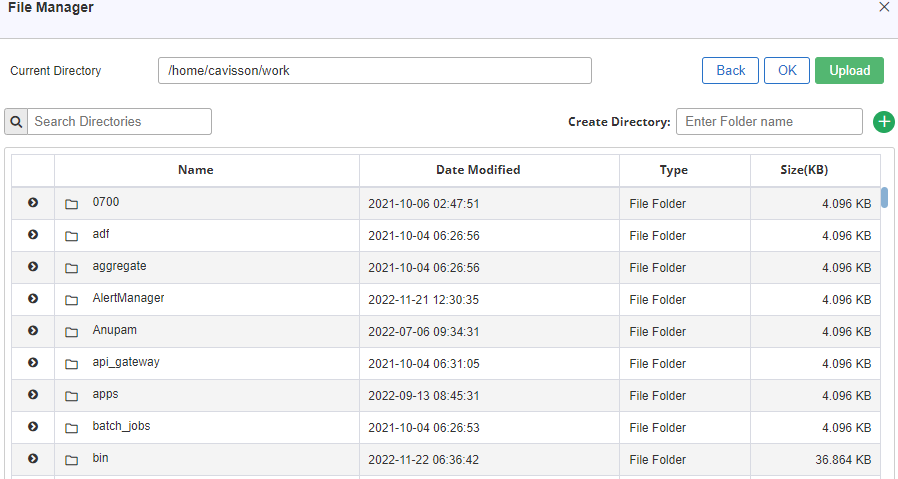
Users can select their preferences by either Uploading a Script from the desktop or can Select from the System. For details of Import script refer to Import Script.
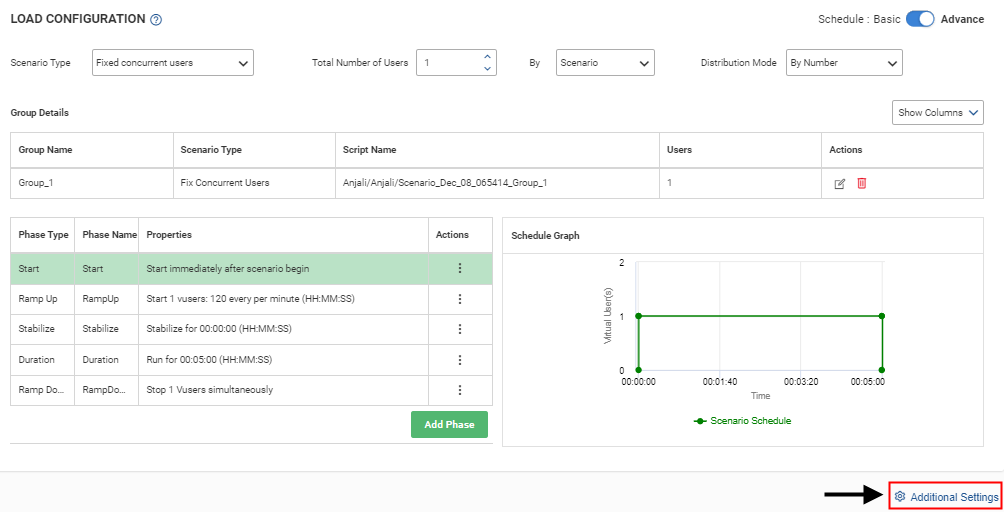
Group Settings ![]()
From here users can apply settings based on individual groups as well as for all group. By default, All Groups is selected. To apply settings group based click on ![]() icon as shown in below figure:
icon as shown in below figure:
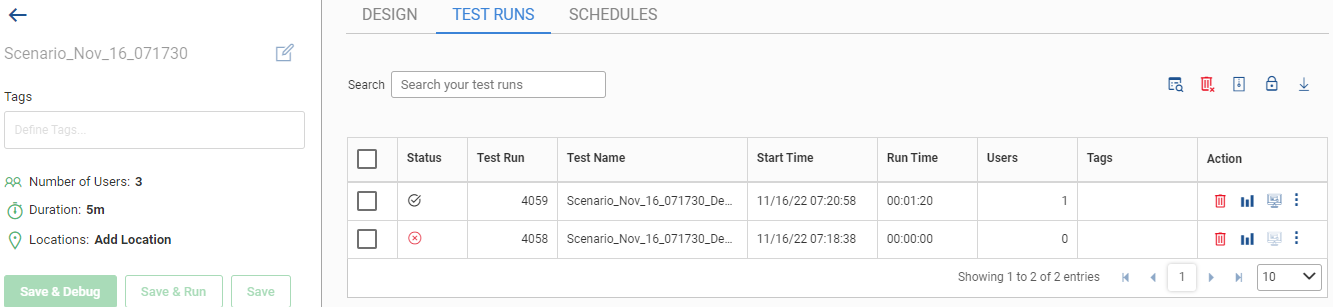
The user can launch a web dashboard from the Test Run table found in the test run tab. In addition to the capability of locking, deleting, etc., the user can also filter and search Test Run.
Test Run(TR) table consists of following columns:
- Checkbox(
 ): With help of checkbox user will be able to delete, archive, lock, compare multiple Test Runs at one go.
 - Status: determines the status of Test Run. Following can be the status of a Test Run at a time:
- Running
 : Shows that Test run is in execution mode.
 - Completed
 : Once a test run has been running for a certain amount of time, it is deemed finished. because a test can be stopped midway after it has started running.
 - Passed
 : The rules in a checkprofile that the user has applied will decide the status of a Test R Test runs are deemed successful if they meet certain requirements or regulations.
 - Failed
 : When test run failed to execute or test run failed to satisfy conditions or rules defined in checkprofile, then it is considered to be failed.
 - Test Run: The unique Test Run number that Load Test provides automatically to a Test run.
- Test Name: The test name user can give to a test.
- Start Time: The time when test is actually started.
- Run Time: This is the total duration for which the test executes.
- Users: The number of users defined in the scenario which is being executed i.e. the number of users simulating in the test run.
- Tags: These are the tags defined in the scenario which are used to filter out test run based on applied tags.
- Actions: Following are the actions performed in test run:
- Delete(
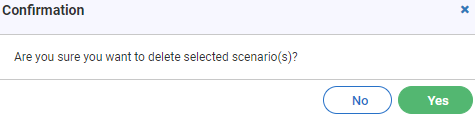
 ): This deletes the Test R User is asked for confirmation before deleting Test Run.
 - Open Dashboard(
 ): It opens the dashboard of a particular Test R
 - Open Transaction(
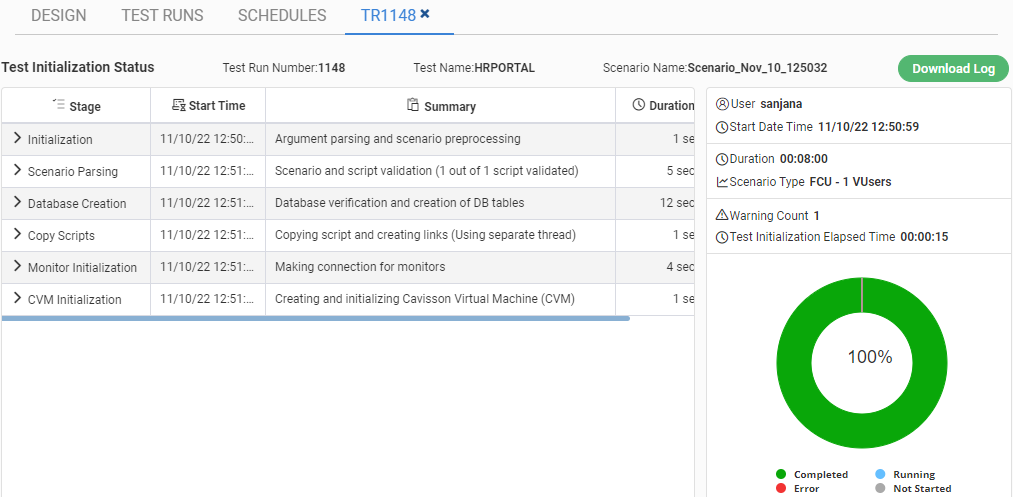
 ): If test is initialized properly, it will open transaction detail UI in a new tab. else it will open test initialization screen in a new tab.
 - Kebab Menu: It has the following g fields:
Following actions can be applied over multiple testruns:
- Global Search Bar
The user has the option of searching for TR using tags, test run numbers, test status, start times, run times, and test names. When conducting a search, only the TRs that are already in the table will be considered. If the user applies filters before conducting a search, the search will only consider the filtered TRs.
Search & Filter( ![]() ): On clicking this option, it enables column filtering. User can filter test runs column wise.
): On clicking this option, it enables column filtering. User can filter test runs column wise.
- Delete(
 ): On clicking delete button, it will delete all selected TR’s from server. If no TR is selected, then validation error will be displayed.
 - Archive Test Runs(
 ): This archive/unarchive all the selected TR’s. If no TR is selected, then validation message will be displayed.
 - Lock Test Runs(
 ): This lock/unlock all the selected TR’s. If no TR is selected, then validation message will be displayed.
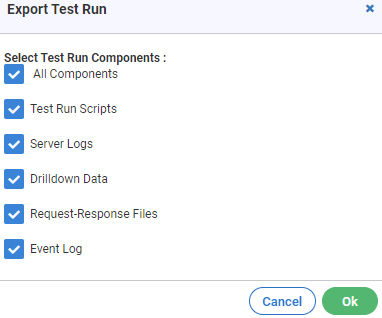
 - Download Table: Complete Test Run table will be downloaded. User need to selected download format which can be word, excel or PDF.
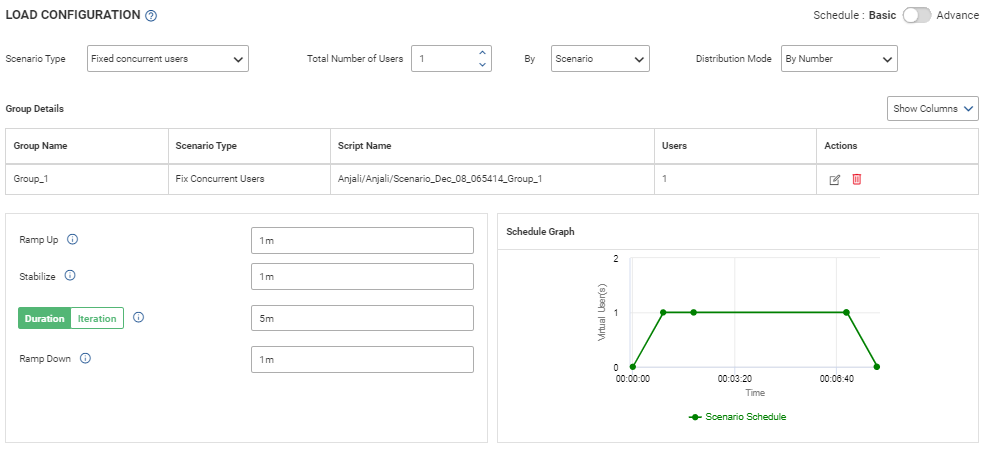
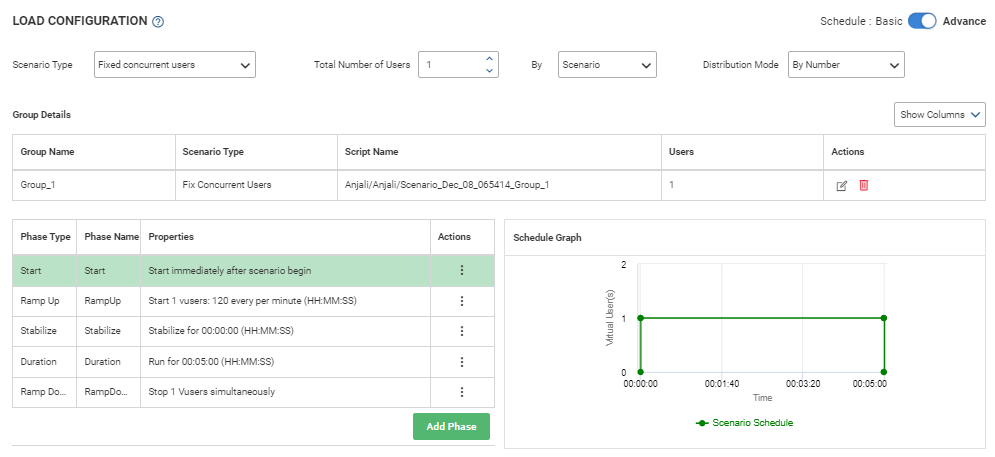
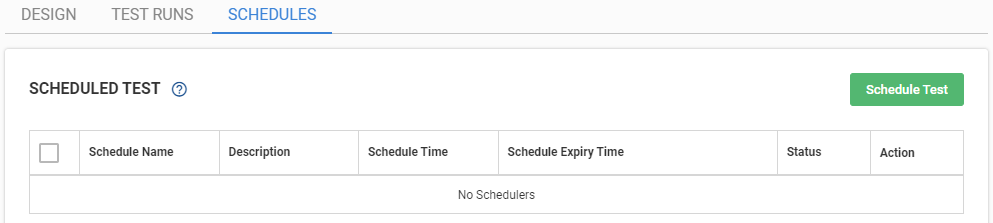
Schedule Test
Schedule test allows users to schedule test execution for the current scenario. The test is completed on the basis of pre-condition inputs and scheduled time. Scheduler will allow user to schedule test execution for current scenario. It has the following columns:
- Schedule Name:Shows the schedule name of the scenario.
- Description: It is the description provided by the user at time of scheduling the test .
- Schedule Time: The time when the test is to be executed.
- Schedule Expiry time: The time when the scheduler needs to be stopped.
- Status: Shows the status of the scheduled test.
Action: Provide the option to edit or delete the scheduled test.
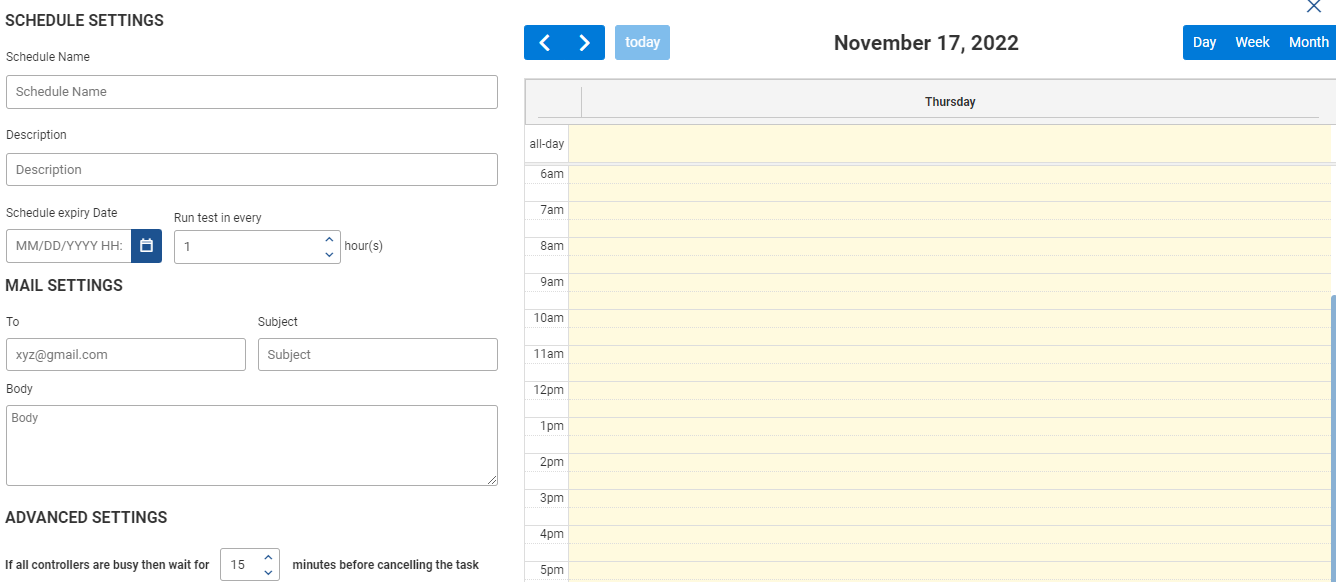
- If you click the settings icon
 , following page opens.