In additional settings we have the following heading:
- Logs & Reports
- Pass/Fail Criteria using Check Profile Rules
- Report
- Percentile Data
- Event Log
- Advanced Settings
- Transactions
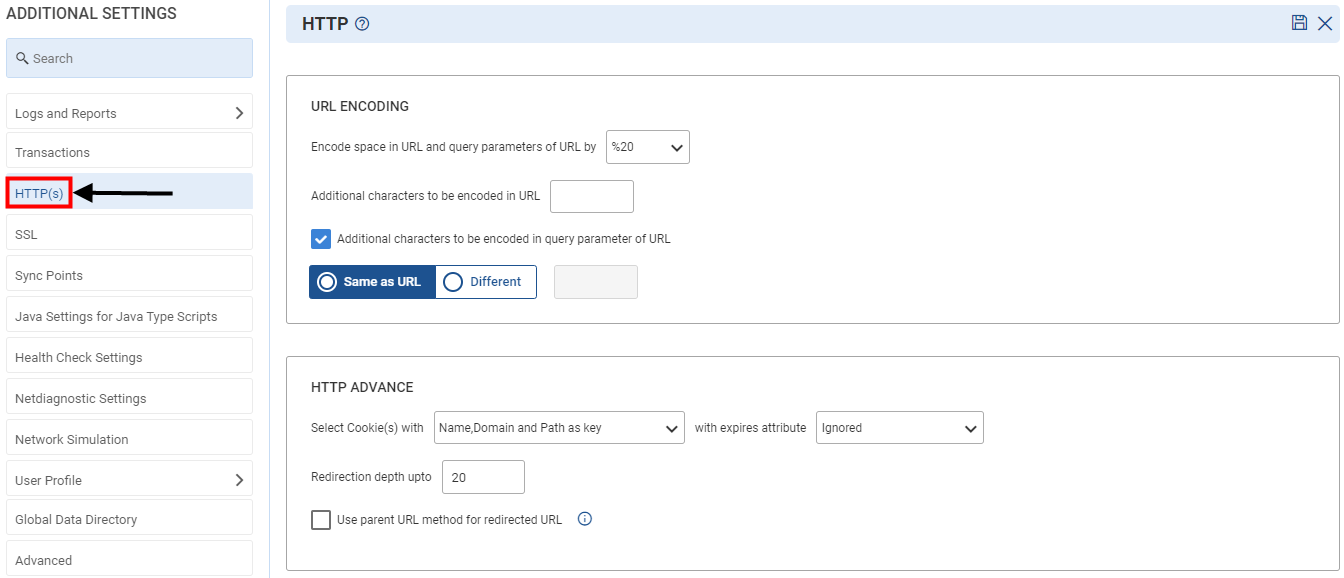
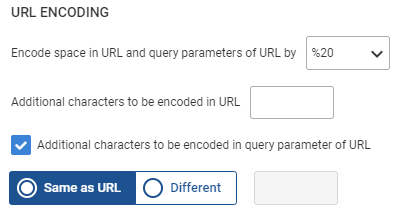
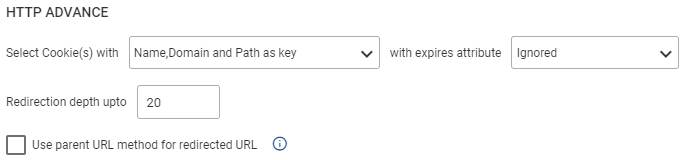
- HTTP(s)
- SSL
- Sync Points
- Java Settings for Java Type Script
- Health Check Settings
- Netdiagnostic Settings
- Network Simulation
- User Profile
- Profile
- Location
- Access
- Browser
- Screen Size
- Global Directory
- Advanced
Let us discuss on the above in details.
Logs and Reports
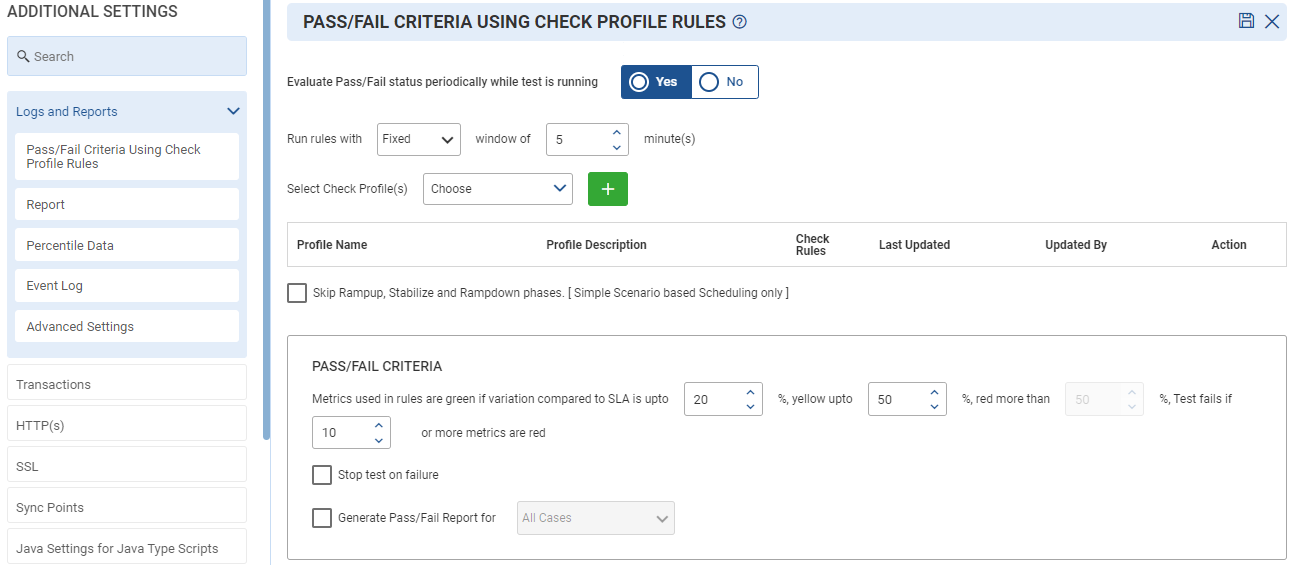
Pass/Fail Criteria Using Check Profile Rules
Every load test should have a pass/fail status. This can be easily done using check profile rules. Rules can be evaluated periodically while the test is running to get the real-time status of the test. You can use this to stop the test from failing to avoid time and resource wastage.
For overall test status, rules can be evaluated at the end of the test. Detailed pass/fail report highlights metrics as green, yellow, or red for quick root cause analysis.
In this, we have the following two ways to evaluate:
- Evaluate Pass/Fail status periodically while test is running.
- Run rules for overall Pass/Fail criteria.
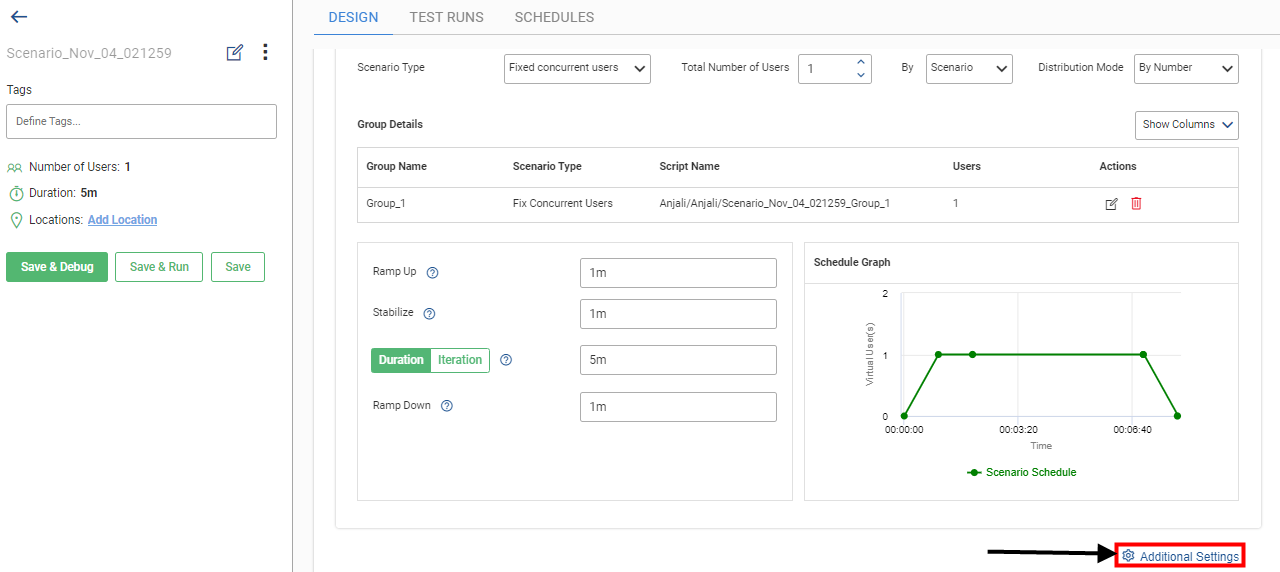
To setup logs and reports, click the Additional Settings ![]() in Scenario Page as shown in below figure.
in Scenario Page as shown in below figure.
- You can also check the box available if you want to stop the test in case of failure.
- You can check the box, if you want to generate a report in case of:
- All cases
- Failure Cases
Run Rules for overall Pass/Fail criteria
To apply the same CheckRules as the periodic case check the available box.
Once the above conditions are applied then select the profile from the drop-down if any are available or from the local directory.
Once all the above conditions are selected, the following details are available:
- Profile Name: It shows the profile name.
- Profile Description: Describe the profile selected.
- Check Rules: This column checks the rules applied to the profile.
- Last Updated: It is the time when the profile was last updated.
- Updated by: Shows the name of the person or team updated on the profile.
- Action: It is used to edit or delete the profile selected.
- Show metrics of baseline testruns in the pass/fail report.
In this, you can select the scenario and the test run in the respective baseline.
Note: You can also override the check profile SLA by selecting the check box available with the respective baseline by choosing them from the dropdown.
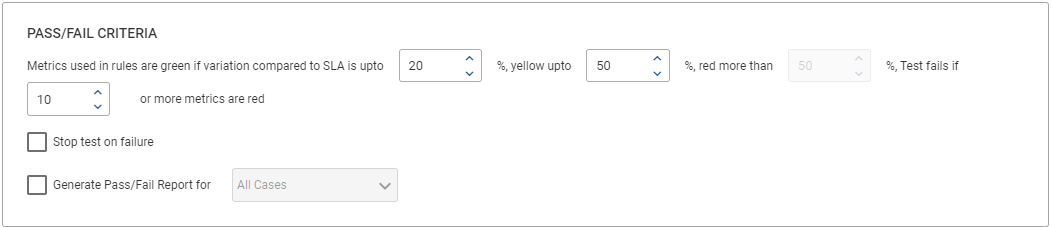
Pass/Fail Criteria
- Metrics used in rules are:
- Green if SLA is upto 20%
- Yellow if SLA is 21% – 50%
- Red, if SLA is more than 50%
NOTES
- You can also check the given box if you want to skip the Ramp up, Stabilize and Ramp down phases. It will show Simple Scenario-based Scheduling only.
- You can also override the check profile SLA by selecting the check box available with the respective baseline by choosing them from the dropdown.
Reports
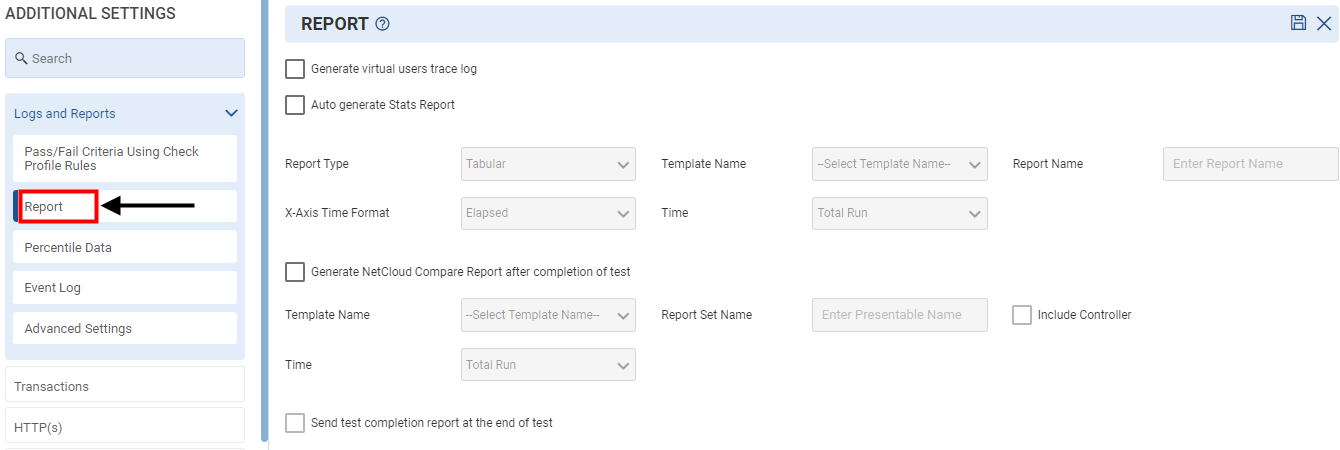
To setup Logs and Reports, click the Additional Settings ![]() in Scenario Reports as shown in Figure 116. On the additional settings page, click on Logs and Reports and select Reports as shown in below figure.
in Scenario Reports as shown in Figure 116. On the additional settings page, click on Logs and Reports and select Reports as shown in below figure.
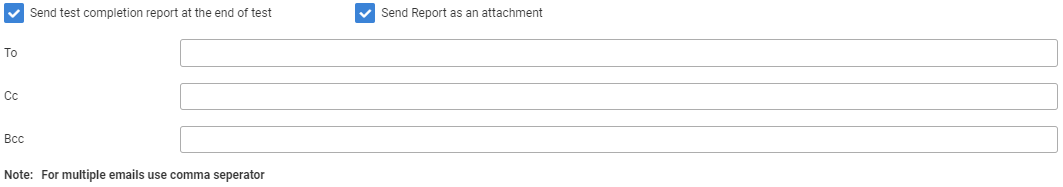
The attachment has the following information:
- TR number
- Machine and Controller
- Scenario
- Start time of TestRun
- Duration of TestRun
Note: For multiple emails use comma separator.
Percentile Data
Percentile data provides insight into the distribution of metrics values. A percentile is the value of a variable below which a certain percent of observations fall. Therefore, the 20th percentile is the value (or score) below which 20 percent of the observations are found. This setting is used to have the graphical representation of the percentile report in the UI analysis window. The user needs to select the Generate Percentile Data check box and specify the duration after which the percentile data is to be generated.
To setup Logs and Reports, click the Additional Settings ![]() in Scenario Reports as shown in Figure 116. On the additional settings page, click on Logs and Reports and select Percentile as shown in below figure.
in Scenario Reports as shown in Figure 116. On the additional settings page, click on Logs and Reports and select Percentile as shown in below figure.
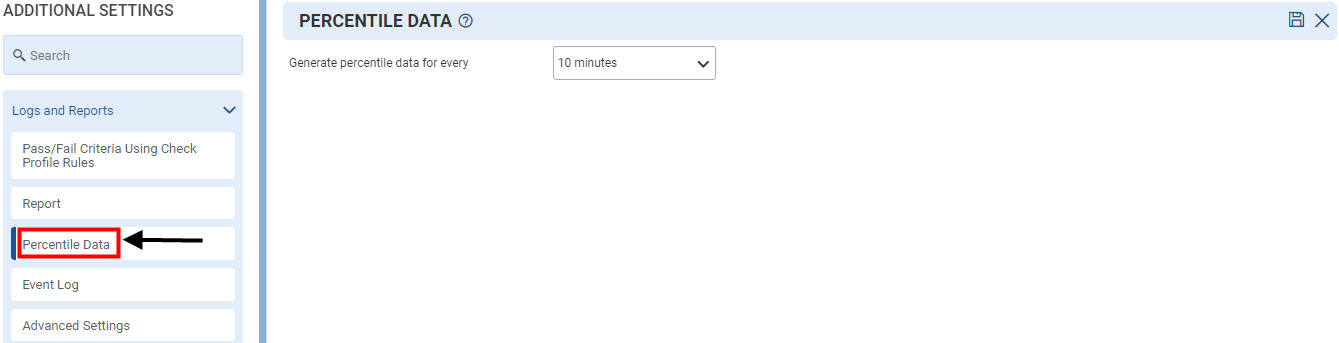
The time interval can be any of the following:
- 10 seconds
- 1 minute
- 10 minutes
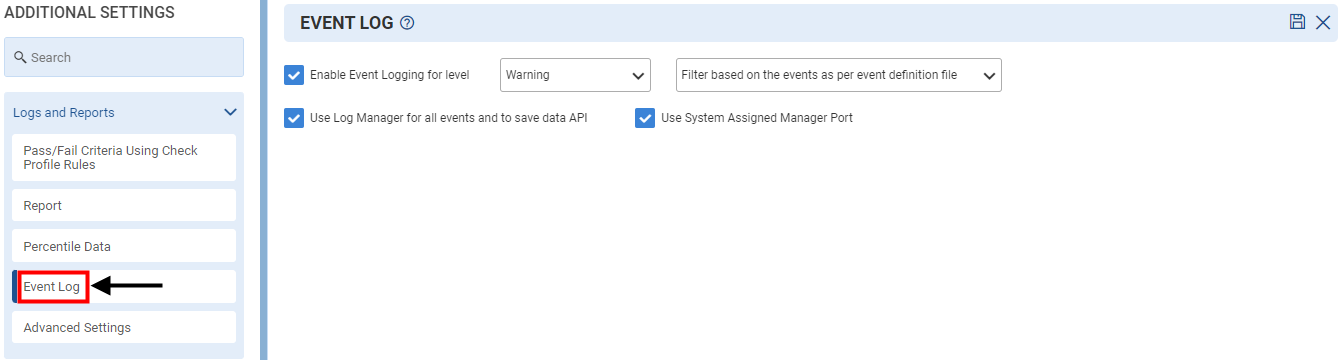
Event Log
Event log is a log of occurrence or happening of a particular task or program, such as the completion of an asynchronous input/output operation. A task may wait for an event or any of a set of events or it may (request to) receive asynchronous notification that the event has occurred.
To access Event Log, click the Additional Settings ![]() in Scenario Reports as shown in Figure 116. On the additional settings page, click on Logs and Reports and select Event Log as shown in below figure.
in Scenario Reports as shown in Figure 116. On the additional settings page, click on Logs and Reports and select Event Log as shown in below figure.
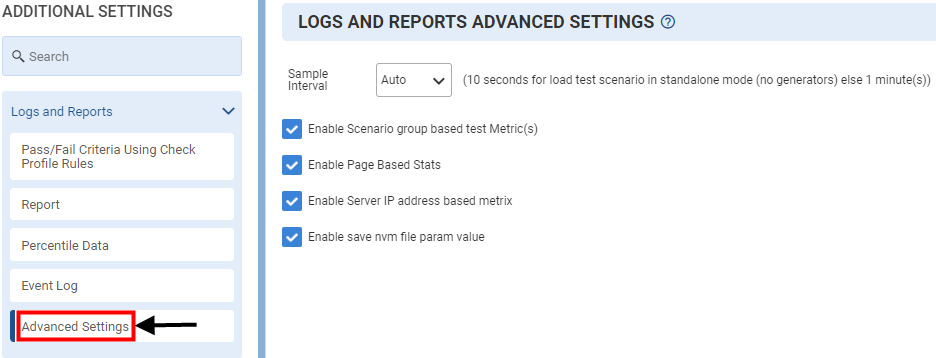
We have the following options in the Advanced settings of Logs and Reports:
- Sample Interval: It is the time interval in which the logs and reports are refreshed. By default, the interval is selected as Auto. 10 secs is selected for the load test scenario in standalone mode (no generators) else it is 1 min.
- Enable Scenario group-based test metric(s): When enabled, the dashboard displays Test metrics data based on specific groups of the Scenario.
- Enable Page Based Stats: When enabled, Real Browser User (RBU) page stats metrics are displayed on the dashboard.
- Enable Server IP address-based metrics: It helps to get the resolved IPs at run time in web-dashboard from which the request is being served (Sent/Sec).
- Enable save nvm file param value: When enabled, save nvm file value is displayed.
Transactions
Here user can perform transaction-related settings. There are two sub-sections under this:
- Pages as Transaction
- Advance Transaction
To access Transaction, click the Additional Settings ![]() in Scenario Reports as shown in Figure 116. On the additional settings page, select Transactions as shown in below figure.
in Scenario Reports as shown in Figure 116. On the additional settings page, select Transactions as shown in below figure.
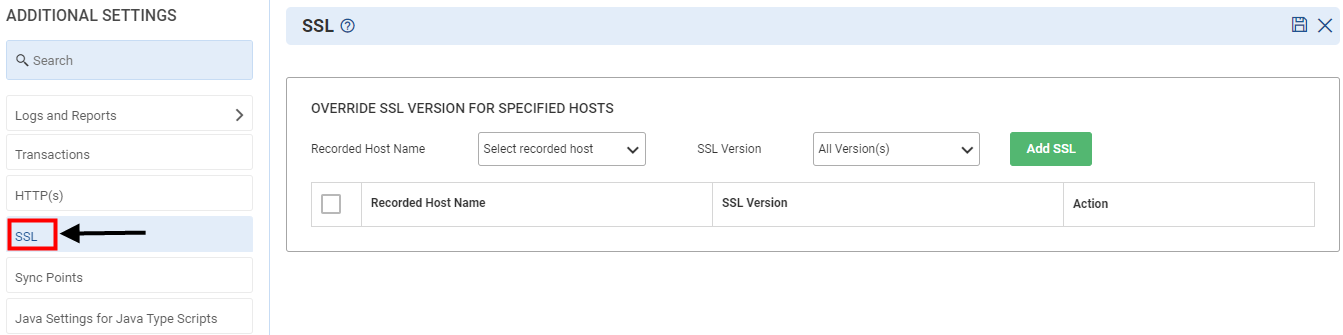
SSL Option
Override SSL version for specified hosts: By default, SSL/TLS version is assigned for all hosts from the field given above. It overrides the existing default SSL version with the selected SSL version for specified hosts.
SSL Options
- Recorded Host Name: It is the hostname of the recorded script. In case there is no recorded hostname then the host/IP is to be mentioned.
- SSL Version: Select the required SSL/TLS version from the drop-down list which you want to apply on the above hostname.
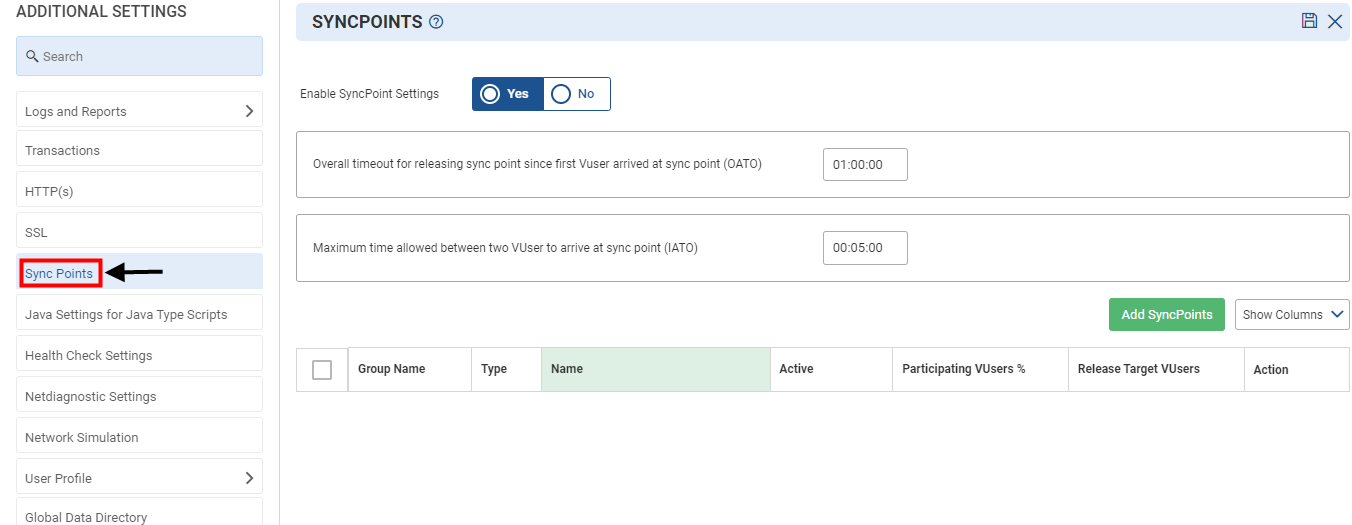
Sync Point
Sync points mean ‘meeting points’. A Sync point creates an intense user load on the server at a time to measure server performance under load. It helps to see how a particular transaction of an application responds with loads. For example, to test a bank server, the user could create a scenario that contains two Sync points as ‘Deposit’ and ‘Withdraw’. The first Sync point ensures that 1000 Vusers simultaneously deposit cash. The second Sync point ensures that another 1000 Vusers simultaneously withdraw cash. To measure how the server performs when only 500 Vusers deposit cash, the user can deactivate the withdraw Sync point, and instruct 500 Vusers to participate in the deposit Sync point only.
To access Sync Point, click the Additional Settings![]() in Scenario Reports as shown in Figure 116. On the additional settings page, select Sync Point as shown in below figure.
in Scenario Reports as shown in Figure 116. On the additional settings page, select Sync Point as shown in below figure.

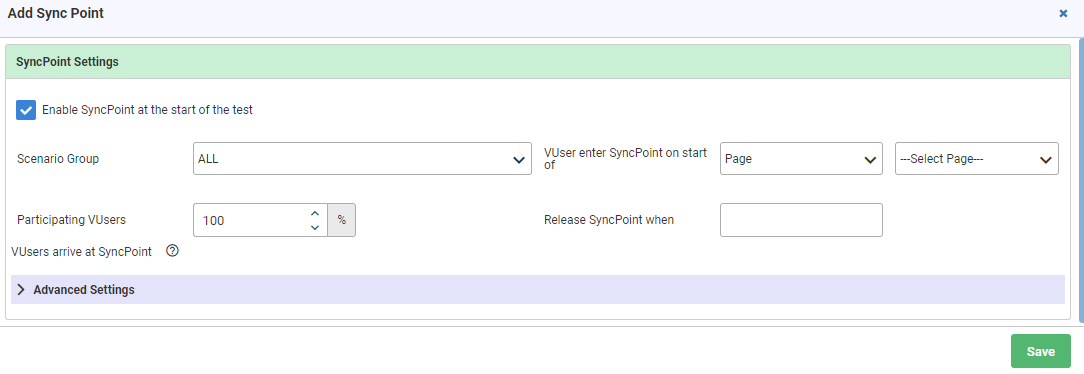
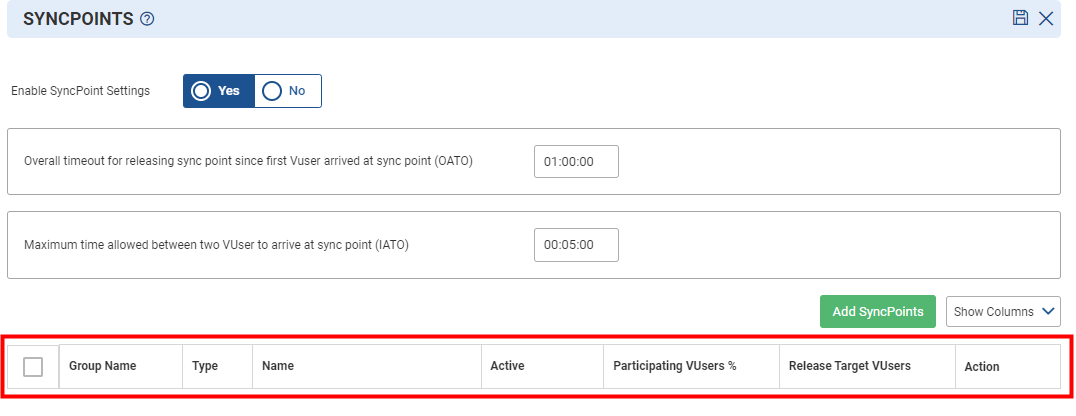
- Group Name: It shows the name of the group.
- Type: Specify the type of sync point.
- Name: Specify the name of the object (transaction/page/script/custom) on which SyncPoint is applied.
- Active: Shows whether the sync point is enable or disabled.
- Participating Vusers%: Percentage of Vusers participated for a specific Sync point. This percentage is calculated over the total number of Vusers in case of ALL groups.
- Release Target Vusers: Specifies the number of Vusers that should reach a Sync point for releasing that Sync point.
- Action: To add, release, update, delete, activate or deactivate the Sync point.
- Mode: It is the way in which the Sync point is going to be released. This could be done either automatically or manually.
- Release Type: It shows how the Vusers will be released
- Schedule: It defines when the VUsers are released after they have reached their respective Sync point.
- Script: Specify all the scripts that are part of SyncPoint. Multiple script names can be provided as comma separated.
- Once all the above fields are filled, click the Save Changes
 icon at the top right corner of the page.
Java Setting for Java Type Scripts
This section is used to perform the Java setting, if the user is using the java type script in the scenario. In this case, the user needs to set some arguments for the execution of java type script.
To access Java Settings, click the Additional Settings ![]() in Scenario Reports as shown in Figure 116. On the additional settings page, select Java Settings as shown in below figure.
in Scenario Reports as shown in Figure 116. On the additional settings page, select Java Settings as shown in below figure.
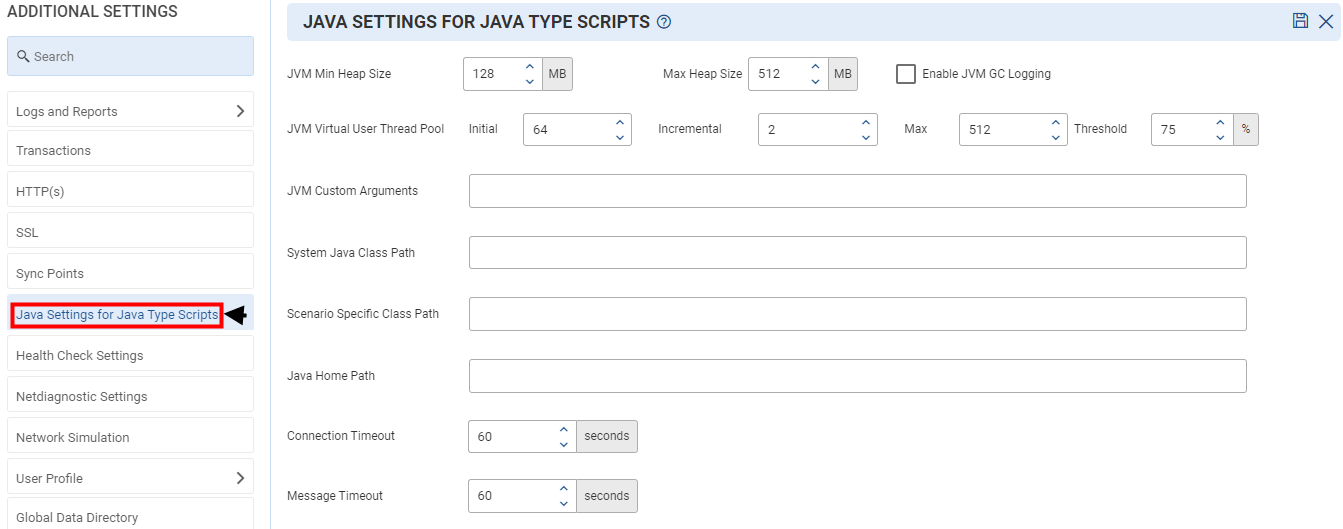
Java Settings Option
- JVM Min and Max Heap Size: Java program executes in JVM and uses a heap of memory to manage the data. User can set minimum and maximum heap sizes accordingly.
- JVM Virtual User Thread Pool: Specify the minimum and the maximum number of threads that are reserved for requests from applications. The thread pool is dynamically adjusted between these two values.
- JVM Custom Arguments: This is used for passing multiple arguments and setting NJVM custom arguments.
- System Java Class Path: The classpath is the path that the Java runtime environment searches for classes and other resource files. This is used to set the NJVM system classpath. The System class maintains a Properties object that describes the configuration of the current working environment.
- Scenario Specific Class Path: This is also used to set the NJVM system class path. In this, a third party is also used.
- Java Home Path: JAVA_HOME is an environment variable (in UNIX terminologies), or a PATH variable (in Windows terminology). This is used to set the NJVM Java Home path. Set the NJVM_JAVA_HOME environment variable to point to the JRE installation directory.
- Connection Timeout: Connection time is the time for which NVM has to wait for NJVM to connect. The maximum time is 60 seconds. After 60 seconds, the connection breaks.
- Message Timeout: Message timeout means when LOAD TEST sends a Request and the Server did not respond within the given time then error is displays as Timeout.
Once all the fields are filled click the save changes icon![]() at the top right corner.
at the top right corner.
Health Check Settings
To access Health Check Settings, click the Additional Settings![]() in Scenario Reports as shown in Figure 116. On the additional settings page, select Health Check Settings as shown in below figure.
in Scenario Reports as shown in Figure 116. On the additional settings page, select Health Check Settings as shown in below figure.
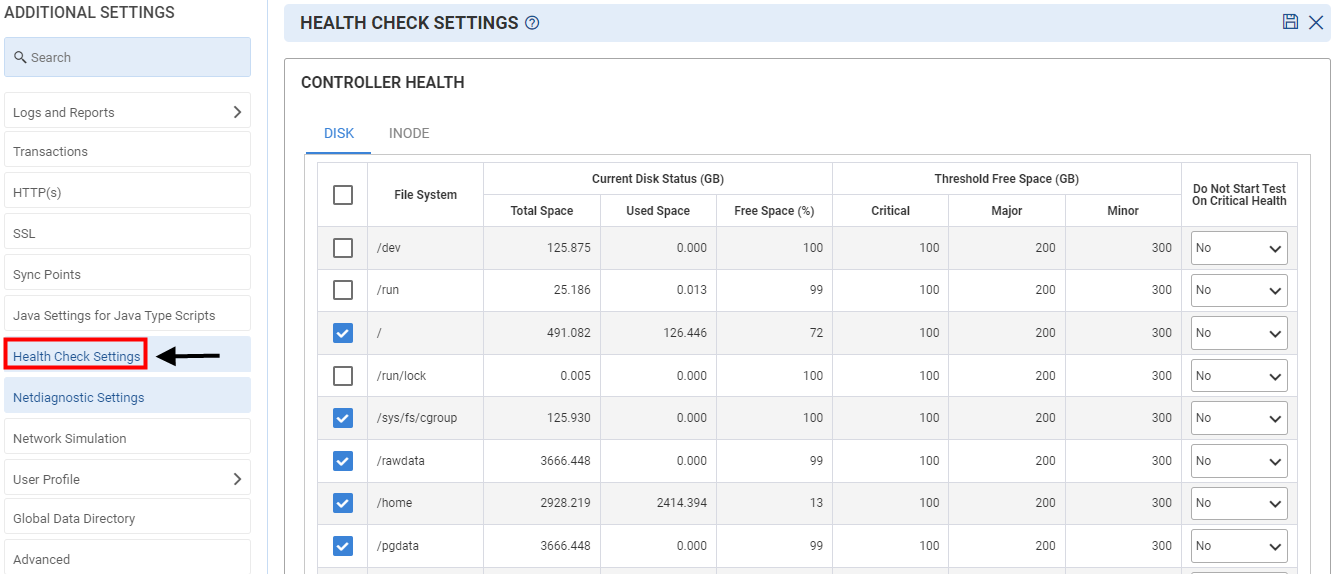
The Health Check Settings window contains the following sections:
- Controller Health
- Generator Health
- Other Settings
Controller Health
Disk
This section contains information on the disk space status, such as what is the total space of the disk for a particular file system, how much disk space is in use, and what is the free space currently.
Disk Options
- File System: It contains a list of file systems available in NSAppliance/NDAppliance.
- Current Disk Status: This field shows the total space, used space, and free space (in %) of the disk.
- Threshold Free Space: The user can set the following threshold Free Space values (in %) for the disk:
- Critical: It is used to specify the critical value (in %) below which the test should not run.
- Major: It is used to specify that the free disk space percentage is nearing the critical value (in %) and that it has reached the major threshold.
- Minor: It is used to specify that the free disk space percentage has just reached the minor threshold value (in %).
- Start Test: Specifies whether the user wants to stop the test or not if the critical value is reached.
INode
In file system, an index node, informally referred to as an INode, is a data structure used to represent a file system object, which can be one of various things including a file or a directory. This section contains information on INode space, such as what is the total number of INodes allocated for a particular file system, how many INodes are in use, and what is the free INodes (in %) currently.
INode Options
- File System: It contains a list of files system available in NSAppliance/NDAppliance.
- Current INode Status (GB): This field displays total INodes, used INodes and free INodes (in %).
- Threshold Free Space- User can set following threshold Free Space values (in %) for INode:
- Critical: It is used to specify the critical value (in %) below which the test should not run.
- Major: It is used to specify that the free INodes percentage is nearing the critical value (in %) and that it has reached the major threshold.
- Minor: It is used to specify that the free INodes percentage has just reached the minor threshold value (in %).
- Start Test: It is used to specify whether the user wants to stop the test or not if the critical value is reached.
Generator Health Options
- Enable Generator Health Check before the start of the test. The test will not start, if any Generator Health Check fails.
- Enter Min free disk size space in GB. By default, it is 10 GB.
- Enter Max CPU utilization in terms of %.
- Enter Min Available Memory in GB. By default, it is 4 GB.
- Enter Min Interface speed in mbps.
Other Settings
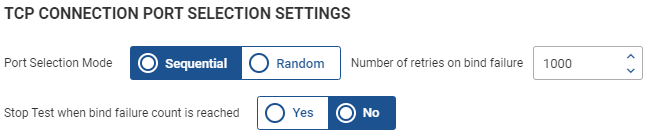
Wait for connection to clear if reached a limit
In this section, a user can configure the number of connections allowed at a time while running a test. If it exceeds the specified limit, further connections are not established until the existing connections are released in the network.
Once all the above fields are filled, click the Save Changes ![]() icon at the top right corner of the page.
icon at the top right corner of the page.
NetDiagnostics Settings
Here the user needs to configure the NetDiagnostics setting for the scenario to configure the monitor and collect the data for monitoring. To access NetDiagnostics Settings, click the Additional Settings ![]() in Scenario Reports as shown in Figure 116. On the additional settings page, select NetDiagnostics Settings as shown in below figure.
in Scenario Reports as shown in Figure 116. On the additional settings page, select NetDiagnostics Settings as shown in below figure.
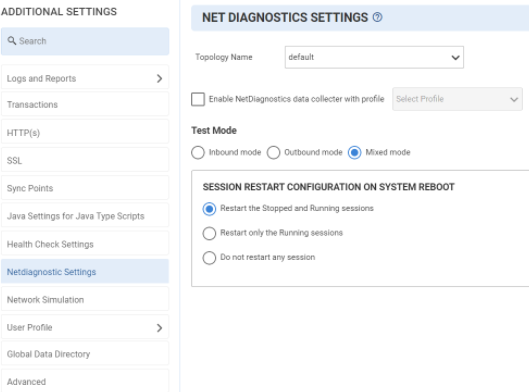
NetDiagnostics Settings Option
- Topology Name: Select the existing topology of the monitors.
- Enable NetDiagnostics data controller with profile: Select the profile which was created previously. Profiles are a set of configuration files that help ND Collector to identify the agent specific configuration.
- Test Mode:
- Inbound Mode: In inbound mode, The connection is made between CMON Agent and LoadTest.
- Outbound Mode: In outbound mode, Net Diagnostic Controller(NDC) works as a server and CMON works as Client. CMON create connection with NDC. The first connection made b/w NDC and CMON is called “Control Connection”. After the first connection the CMON prepares itself to process and send the data to NDC. This connection is known as “Data Connection”. Now NDC will send the data to LoadTest.
- Mixed Mode: This indicates the test will run in mix mode which may be the inbound or outbound method.
Session Restart Configuration on System Reboot
Select any of the following options:
- Restart the Stopped and Running sessions: After the system reboot, it will restart stopped and running sessions.
- Restart only the Running sessions: After the system reboot, it will restart all the running sessions.
- Do not restart any session: After the system reboot it will not restart any session.
Once all the above fields are filled, click the Save Changes ![]() icon at the top right corner of the page.
icon at the top right corner of the page.
Network Simulation
Network simulation is a technique where a program models the behavior of a network either by calculating the interaction between the different network entities (hosts/packets, etc.) using mathematical formulas, or actually capturing and playing back observations from a production network. To access Network Simulation, click the Additional Settings ![]() in Scenario Reports as shown in Figure 116. On the additional settings page, select Network Simulation as shown in below figure.
in Scenario Reports as shown in Figure 116. On the additional settings page, select Network Simulation as shown in below figure.
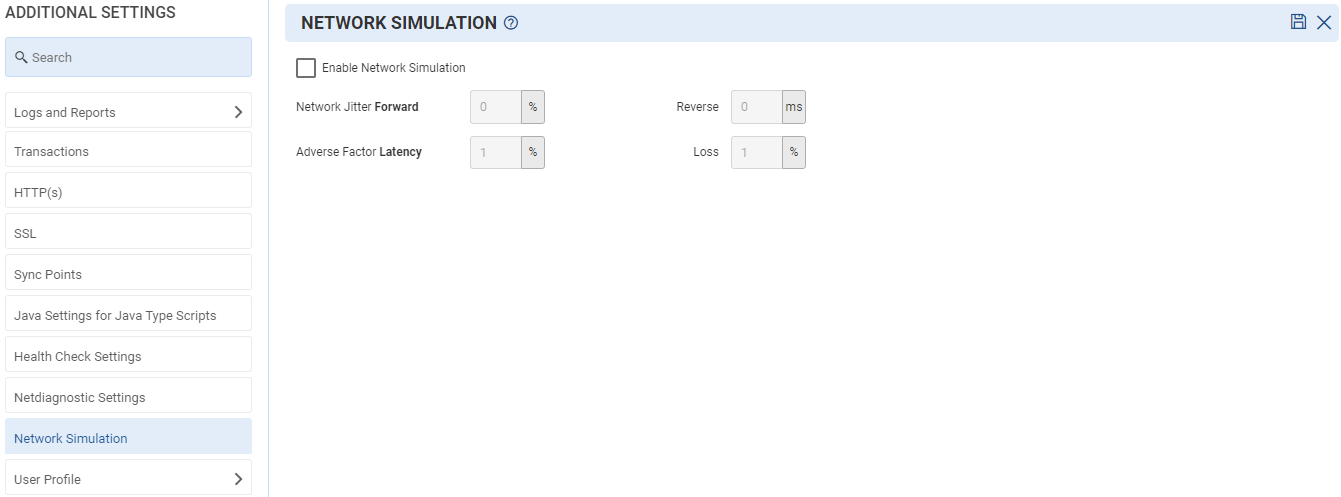
Network Simulation Option
Provide details in the following fields for Network Simulation:
- Enable Network Simulation:When enabled, user is simulated on different bandwidth and location.
- Jitter:Jitter is defined as a variation in the delay of received packets. The sending side transmits packets in a continuous stream and spaces them eventually apart. Because of network congestion, improper queuing, or configuration errors, the delay between packets can vary instead of remaining constant. User have the following fields for jitter:
- Network Jitter Forward:It is any deviation in, or displacement of, the signal pulses in a high-frequency digital signal from server to client.
- Reverse:Specify the time difference of packets received at client side.
- Adverse Factory Latency:Adverse factor for latency and packet loss: It is the variable percentage for latency and packet loss from server to client and vice versa.
- Loss (%):Specify the packet loss in %.
Once all the above fields are filled, click the Save Changes icon at the top right corner of the page.
User Profile
All users belonging to a scenario group share same common characteristics. These characteristics include:
- Network Access method employed by the user to access the web application e.g., 56 K dial-up modem, 512K DSL, cable modem, T1 etc.
- Geographic location of the users. For example, East Cost, mid-west, Asia etc. Geographic location affects the number of hops, packet loss etc.
- Web Browser Used by users, such as NetScape4, IE 5.0 etc.
A common virtual user characterization of a scenario group is called User Profile. User Profile is used for WAN-ENV simulation and can be designed accordingly. User Profile can be designed with desired Location, Access, Browser and Co-located User for scenario groups.
A scenario group is associated with a single User profile. But multiple scenario groups may share same user profile. This happens in the situation when such scenario groups have different test script associated with them.
If the WAN Simulation is on, one important thing that needs to be defined for actual server is the physical location of the server (SUT) when deployed in production environment. By default, it is set to San Francisco.
By default, Internet simulation is disabled. So, all user profiles just boil down to a LAN. To use the real Internet simulation:
- Enable the WAN simulation as described below.
- Use the appropriate User profile in defining the Scenario groups.
- Define the Location of the Server as described in the Server Configuration Section below.
There are following sections under this:
- Profile
- Location
- Edit Access
- Browser
- Screen Size
A common virtual user characterization of a scenario group is called a User Profile. To access User Profile, click the Additional Settings ![]() in Scenario Reports as shown in Figure 116. On the additional settings page, select User Profile as shown in below figure.
in Scenario Reports as shown in Figure 116. On the additional settings page, select User Profile as shown in below figure.
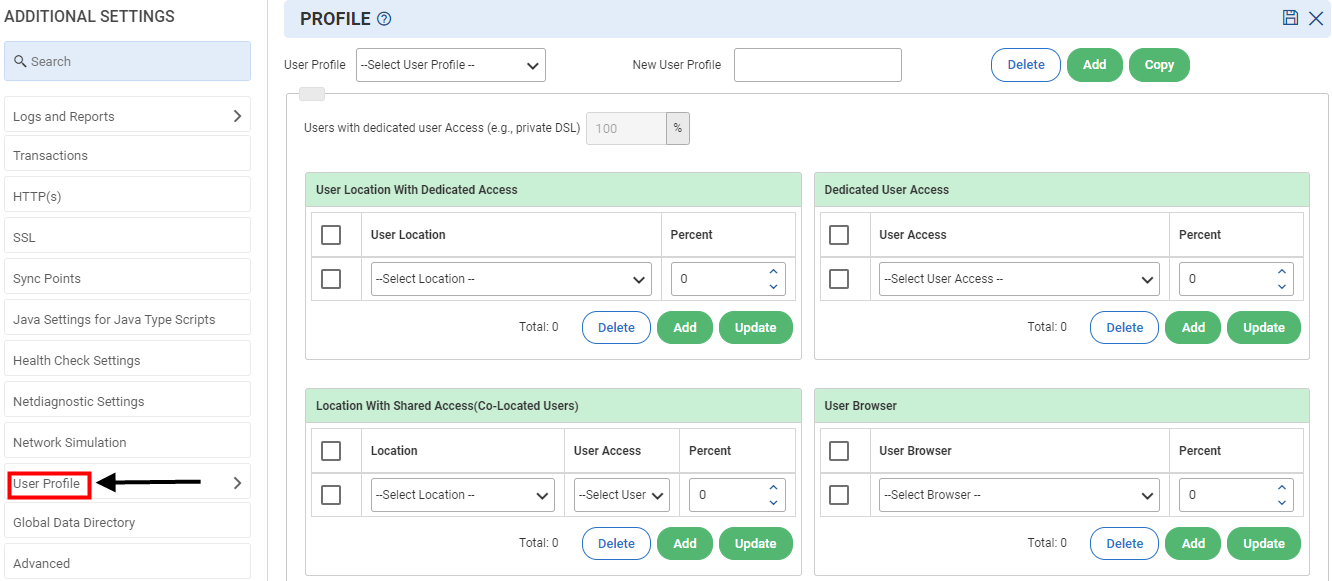
Profile
User Profile window is divided in to two frames:
- User Profile Management Frame
- User Profile Details Frame
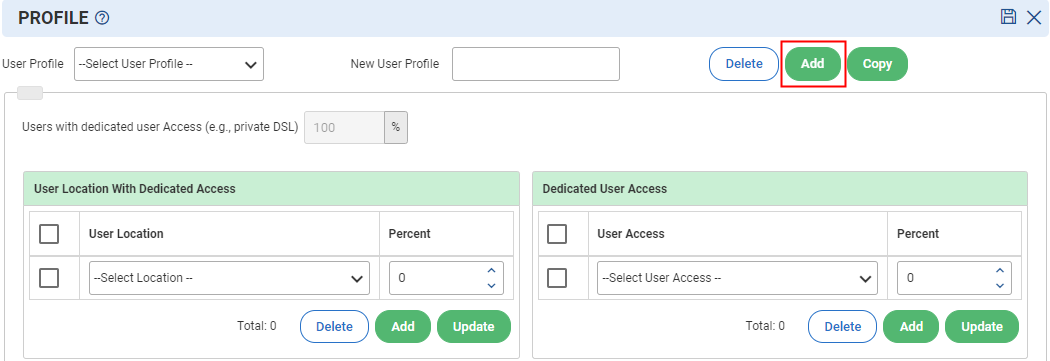
User Profile Management Frame
A common virtual user characterization of a scenario group is called a User Profile. There are the following options:
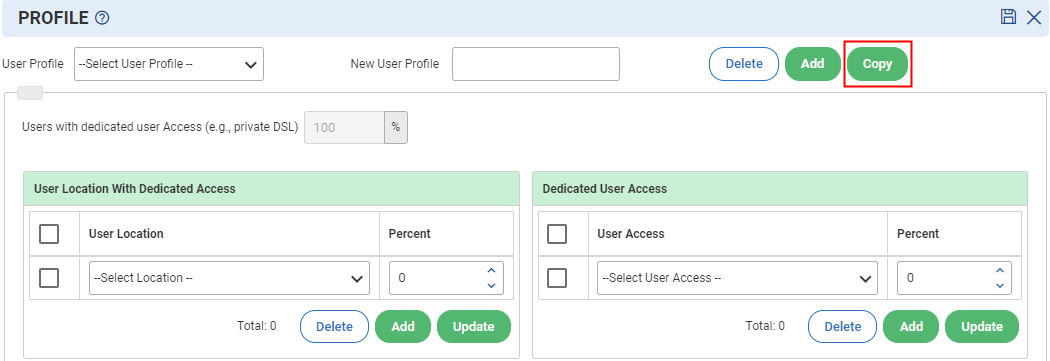
With this frame, the user can perform following operations:
- Select a user profile
- Add a user profile
- Copy a user profile
- Delete a user profile
- To Select User Profile- Select the pre-existing user profile from the drop-down available.
To Add a User Profile:
- Enter new user profile in the New User Profile
- Click the Add
 button.
 - After clicking Add button, user gets the User Profile with its default values.
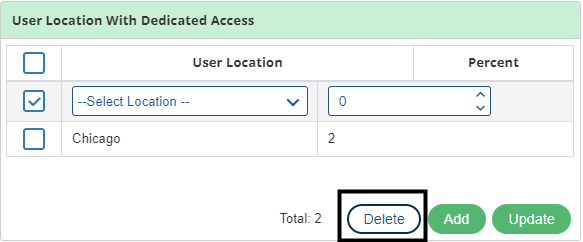
- Click the Delete The location gets deleted.
User can delete multiple locations at a time by selecting multiple rows. |
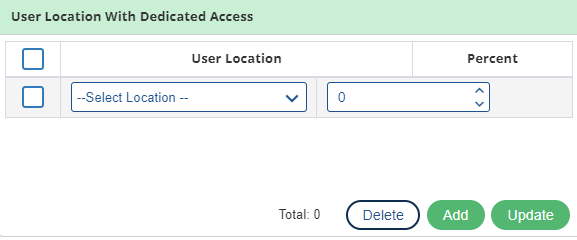
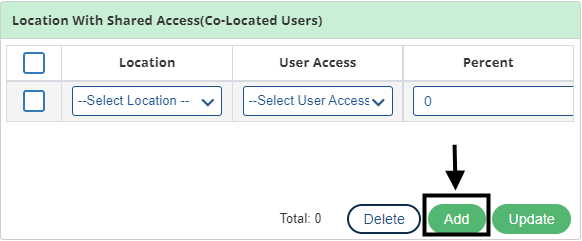
- To Update a Location from User Location with Dedicated Access frame:
Select a row to be updated. Here, user can update percentage of users
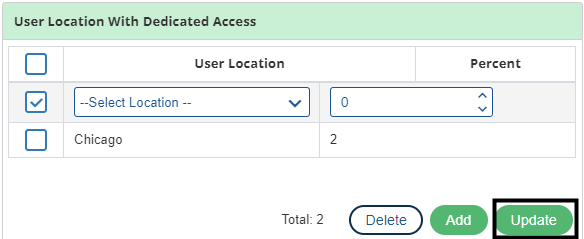
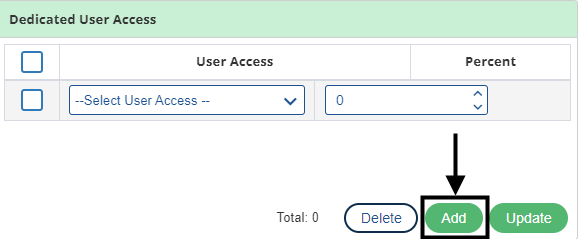
2. Set percent value to selected user access.
3. Click the Add The user access gets added in the list.
Total percent of added accesses should be 100. |
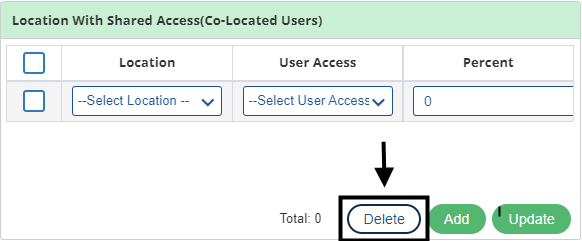
To Delete an Access from Dedicated User Access frame:
- Select access row that needs to be deleted.
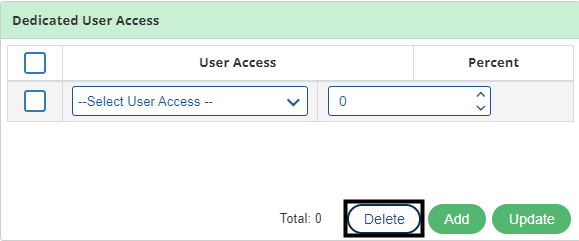
- Click the Delete The access gets deleted.
User can delete multiple Accesses at a time by selecting multiple rows. |
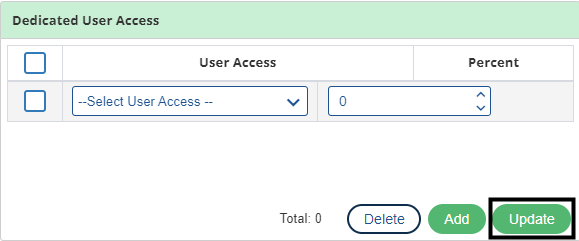
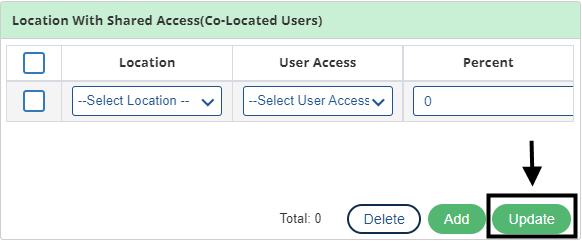
To Update an Access from Dedicated User Access frame:
- Select a row from the drop-down list to be updated.
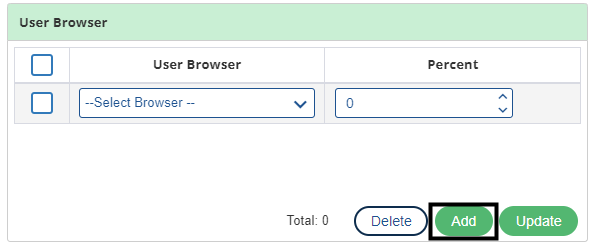
2. Click the Add button, the browser gets added in the list.
Total percent of added browsers should be 100. |
To Delete a Browser from User Browser frame:
- Select browser row that needs to be deleted.
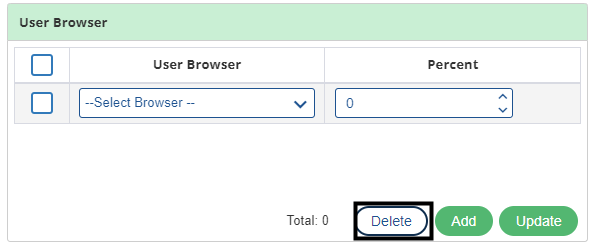
2. Click the Delete The browser gets deleted.
User can delete multiple Browsers at a time by selecting multiple rows. |
To Update a Browser from User Browser frame:
- Select browser row that needs to be updated.
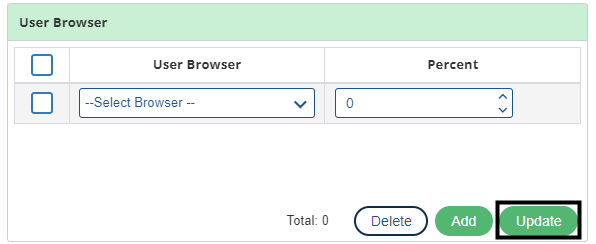
- Update the Percent value and click the Update The percent value gets updated.
Click the Save Changes![]() icon on the top right corner of the page
icon on the top right corner of the page
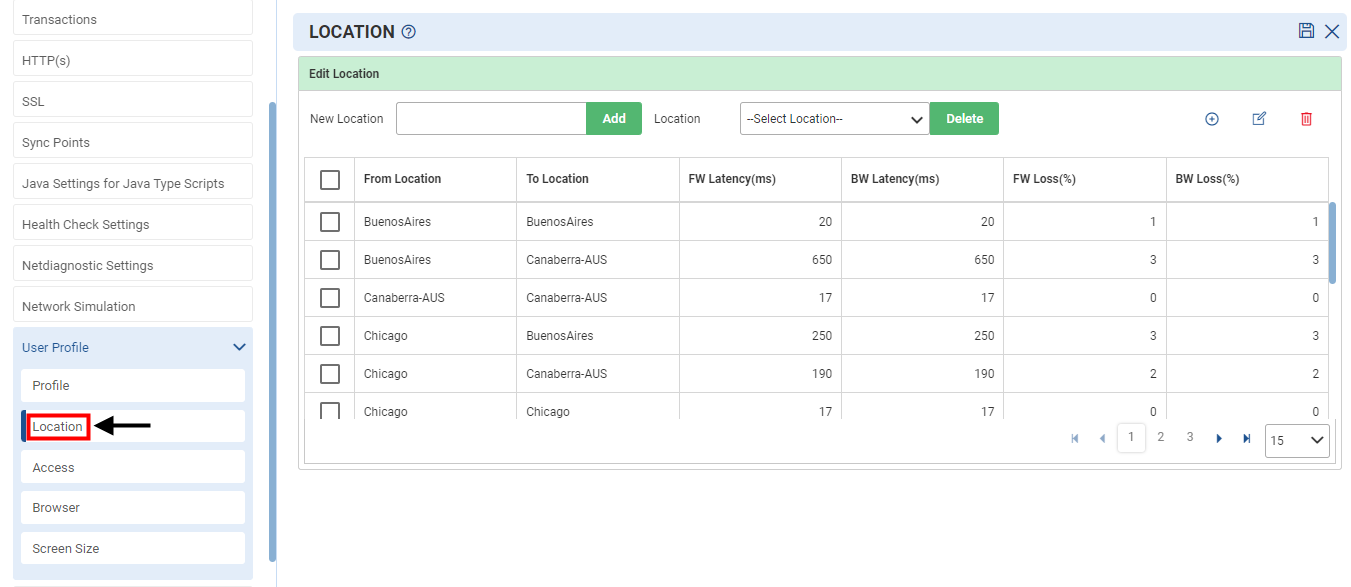
Location
This section is used to add/delete/update a location. To setup Location (User Profile), click the Additional Settings ![]() in Scenario Reports as shown in Figure 116. On the additional settings page, click on User Profile and select Location as shown in below figure.
in Scenario Reports as shown in Figure 116. On the additional settings page, click on User Profile and select Location as shown in below figure.
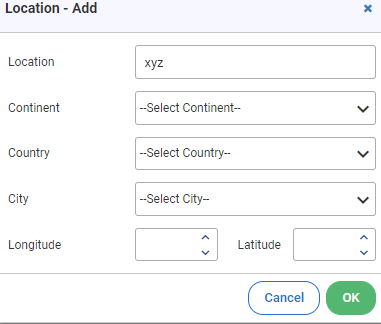
2. Add the location details, such as continent/country, city, longitude, and latitude.
Click OK. The location gets added to the list.
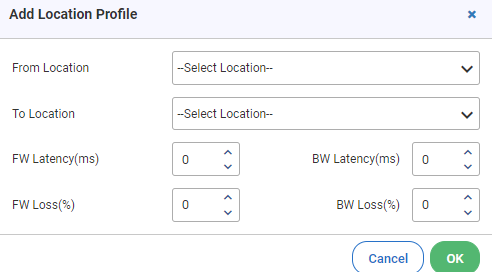
Mapping of Locations
User can map the location with forward and backward latency and forward and backward loss.
Steps to map a location:
- Select a location and click Add icon
 .
. - Set values of ‘From Location’, ‘To Location’, ‘Forward Latency’, ‘Backward Latency’ and Loss for both the servers to be mapped and then click the OK.
Note: User can also Edit![]() or delete
or delete ![]() location by clicking the or icon respectively as per the requirement.
location by clicking the or icon respectively as per the requirement.
Access
Network Access method employed by the user to access the web application. This section is used to add/delete/update network access. This section is used to add/delete/update a location. To setup Access (User Profile), click the Additional Settings ![]() in Scenario Reports as shown in Figure 116. On the additional settings page, click on User Profile and select Access as shown in below figure.
in Scenario Reports as shown in Figure 116. On the additional settings page, click on User Profile and select Access as shown in below figure.
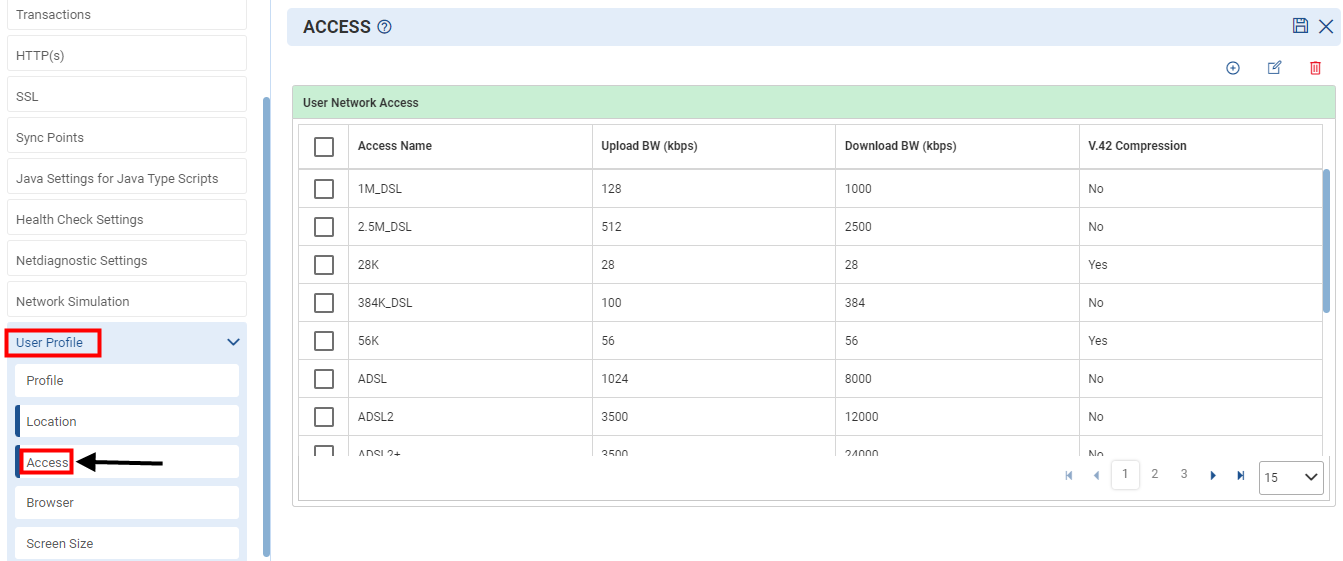
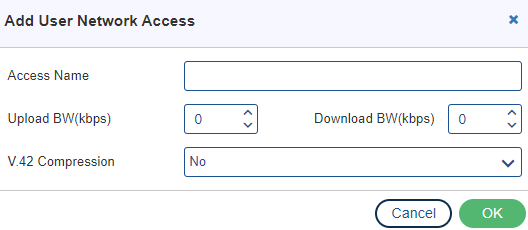
2. Click the Add button, the record gets added to the list.
Note: The user can update the upload bandwidth and download bandwidth settings.
User can also Edit![]() or delete
or delete ![]() access by clicking the or icon respectively as per the requirement.
access by clicking the or icon respectively as per the requirement.
Click the Save Changes ![]() icon on the top right corner of the page.
icon on the top right corner of the page.
Browser
Web Browser used by users, such as NetScape4, IE 5.0, etc. This section is used to add/delete/update a browser. To setup Browser (User Profile), click the Additional Settings ![]() in Scenario Reports as shown in Figure 116. On the additional settings page, click on User Profile and select Browser as shown in below figure.
in Scenario Reports as shown in Figure 116. On the additional settings page, click on User Profile and select Browser as shown in below figure.
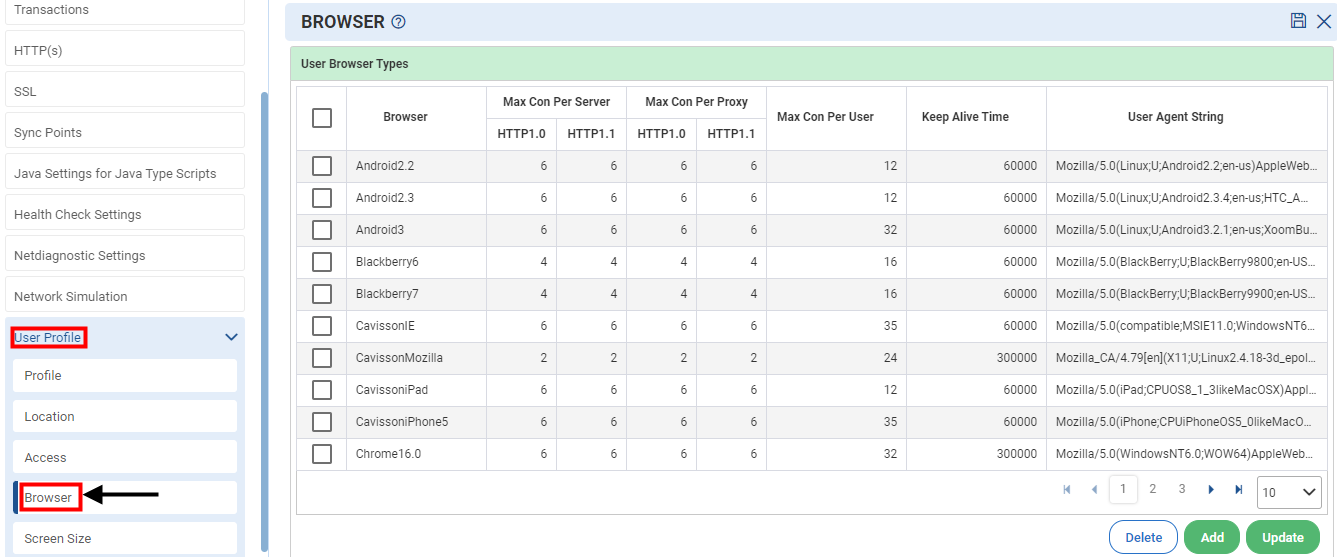
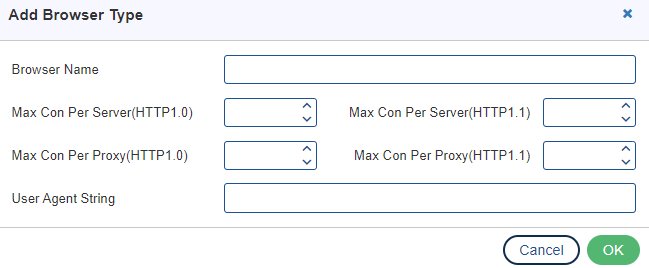
- Click OK button, the user browser gets added.
Click the Save Changes ![]() icon on the top right corner of the page.
icon on the top right corner of the page.
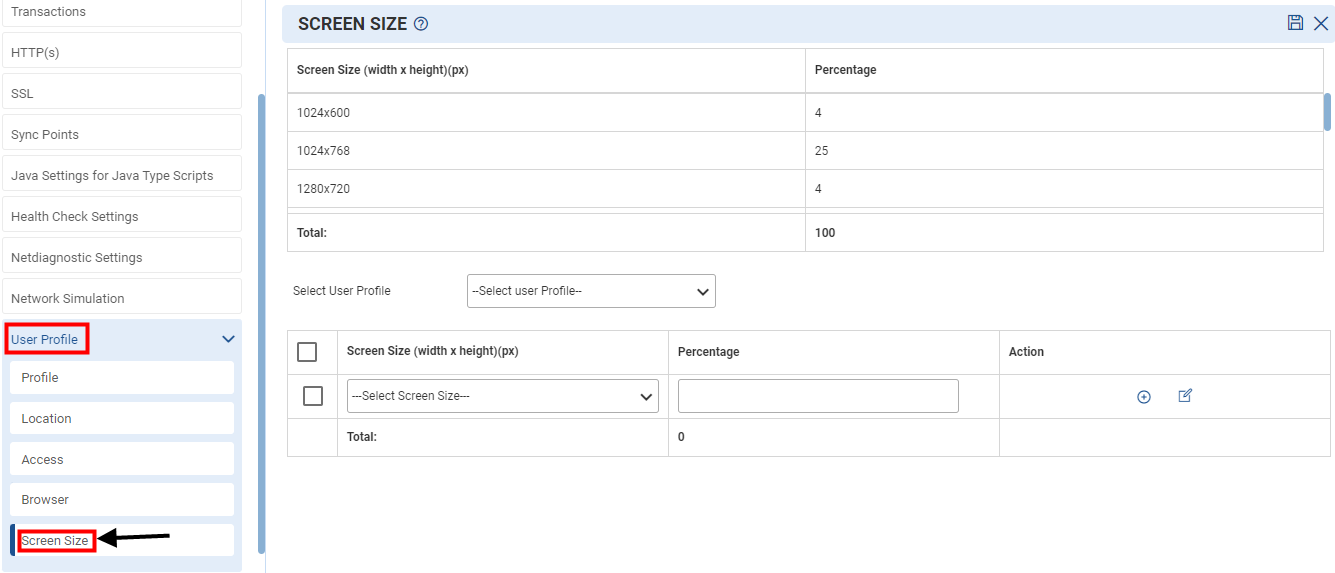
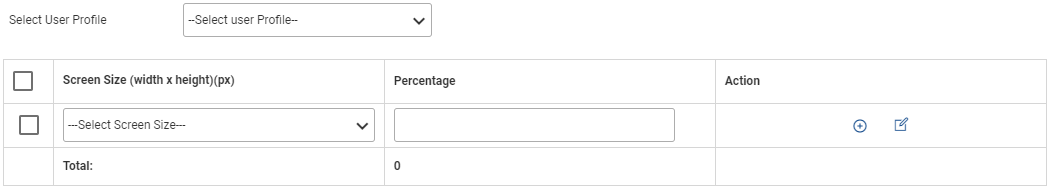
Screen Size
This provides the screen size, such as 1920*1080 where 1920 is (width * height) and 1080 is the pixels. This section is used for editing a screen size. To setup Screen Size (User Profile), click the Additional Settings![]() in Scenario Reports as shown in Figure 116. On the additional settings page, click on User Profile and select Screen Size as shown in below figure.
in Scenario Reports as shown in Figure 116. On the additional settings page, click on User Profile and select Screen Size as shown in below figure.
User can also Edit ![]() or delete
or delete ![]() Screen Size by clicking the or icon respectively as per the requirement.
Screen Size by clicking the or icon respectively as per the requirement.
Click the Save Changes ![]() icon on the top left corner of the page once all the fields are filled.
icon on the top left corner of the page once all the fields are filled.
Global Data Directory
To access Global Data Directory, click the Additional Settings ![]() in Scenario Reports as shown in Figure 116. On the additional settings page, select Global Data Directory as shown in below figure.
in Scenario Reports as shown in Figure 116. On the additional settings page, select Global Data Directory as shown in below figure.
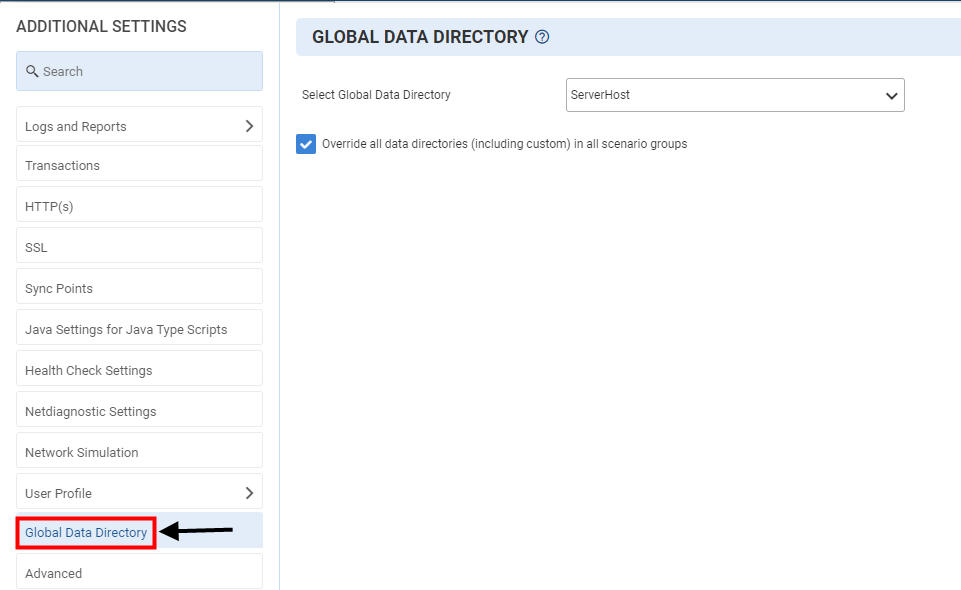
Global Data Directory Option
- Select Global Data Directory: Users can select any data directory that will use in the script by default.
- Override all data directories (including custom) in all scenario groups: If you override the data directory, the data files of all file parameters are taken from the specified directory. If no file is found, it will be taken from the data directory specified in the file parameter and then from the script directory. By enabling the options user can override the data directory in every group with the default data directory.
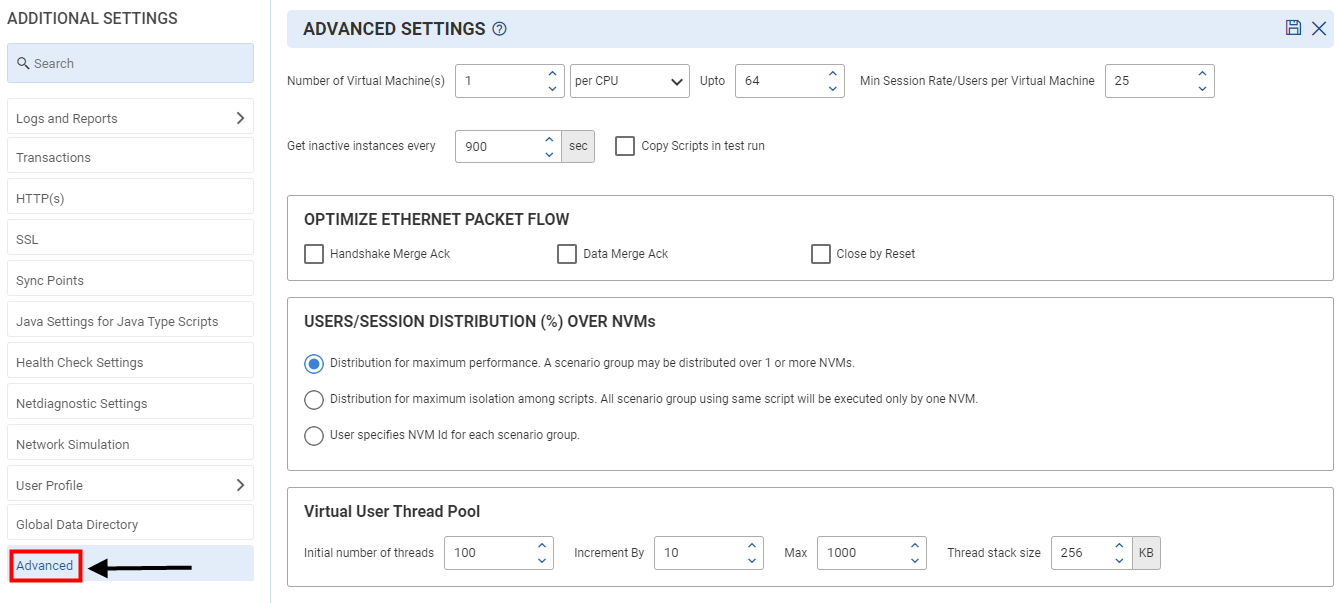
Advanced
To access Advanced Settings, click the Additional Settings in Scenario Reports as shown in Figure 116. On the additional settings page, select Advanced Settings ![]() as shown in below figure.
as shown in below figure.