Click on ![]() for Automation details. You get the following page once you click on the icon.
for Automation details. You get the following page once you click on the icon.
In Automation, in the left panel we have the following headings:
- Summary
- Test Suite
- Test Case
- Test Report
- Check Profile
Let us discuss them in details:
Summary
In Automation, once you click the Summary Icon ![]() , you get the following fields:
, you get the following fields:

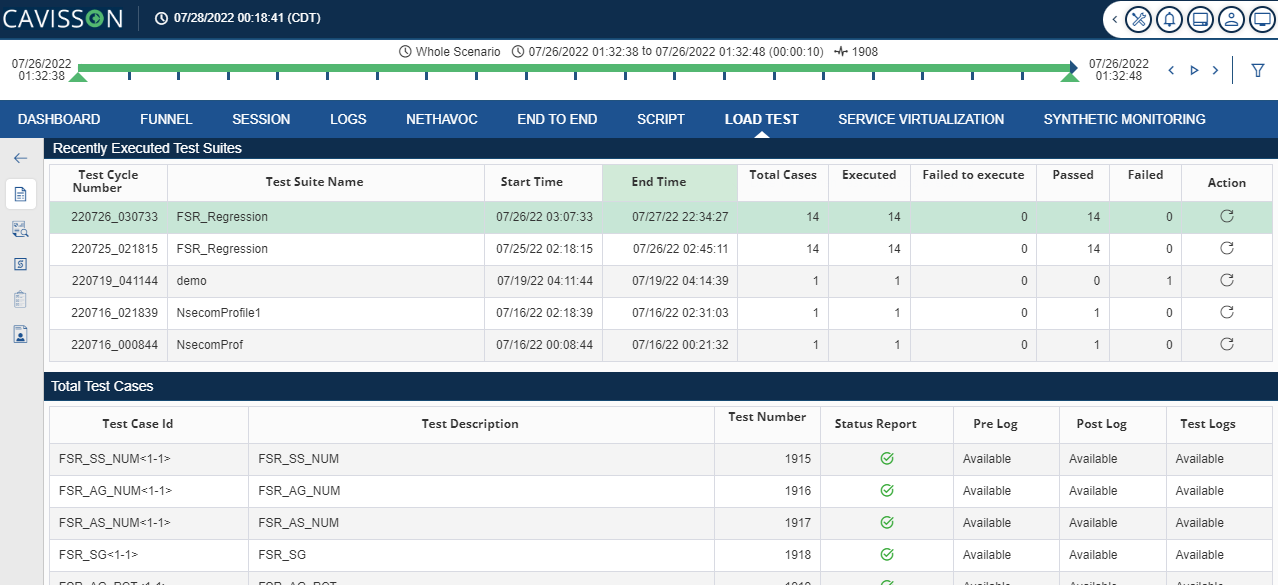
- Recently Executed Test Suites
- Test cycle Number: This is a unique number which generates on every test suite execution.
- Test Suite Name: Specifies the name of the suit.
- Start Time: Date/Time when test Suite start executing.
- End Time: Date/Time when test Suite stops executing.
- Total Cases: It shows the total number of test cases associated.
- Executed: It shows cases that are successfully executed.
- Failed to execute: It shows case which fails to execute.
- Passed: Specifies the cases passed.
- Failed: Shows the cases which are failed.
- Action: Determine the action to be executed.
- Total Test Cases
- Test Case ID: This is the unique number which generates for every test case.
- Test Description: It shows the description of the test.
- Test Number: Unique number for the test executed for a particular test case.
- Status Report: Status of test case in Progress/Pass/Fail.
- Pre-Log: It determines whether the logs of prescript are available or not.
- Post Log: It shows whether the logs of postscript are available.
- Test Log: It shows whether test logs are available or not.
Test Suite
In Automation, once you click the Test Suite![]() Icon , you get the following fields:
Icon , you get the following fields:
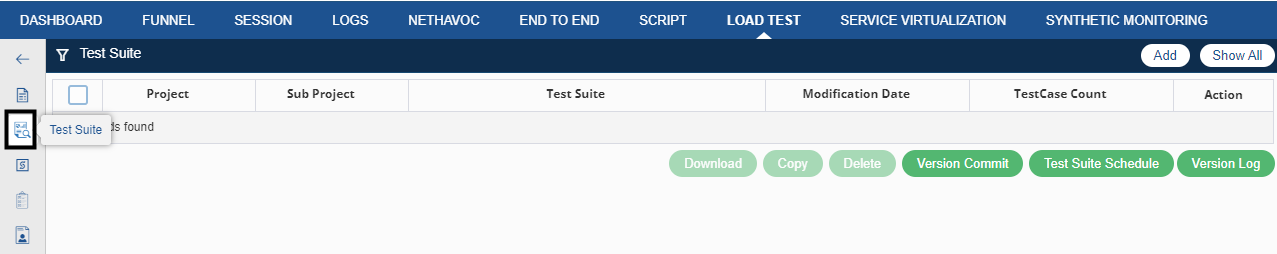
- Project- Project is the directory.
- Sub-Project- Sub Project is the directory.
- Test Suite- Specifies the name of the suit.
- Modification Date-It shows the time and date when test suite is modified.
- TestCase Count- Shows the number of testcase count.
- Action: It shows the action taken for a test suite.
Add Test Suite
To Add a Test Suite, click the ![]() button. The following window will open
button. The following window will open
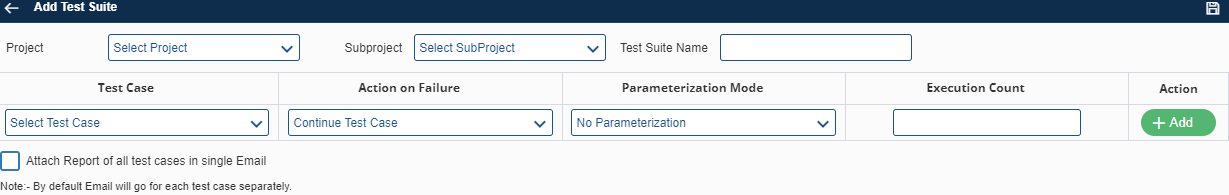
Following are the fields to be filled to add the test suite:
- Project: Select the project from the drop-down.
- Subproject: Select the sub-project from the drop-down.
- Test Suite Name: Specifies the name of the suit.
- Test Case: Select the test case from the drop-down.
- Action on Failure: Decide whether to continue or abort the test in case of failure.
- Parameterization Mode: Select the mode based on which parameterization is done
- Execution Count: Enter the number of counts to be executed.
Once all of the above fields are filled, click on ![]() icon on top right corner to save the test suite.
icon on top right corner to save the test suite.
Test Case
In Automation, once you click the Test Case Icon , you will get the following figure.
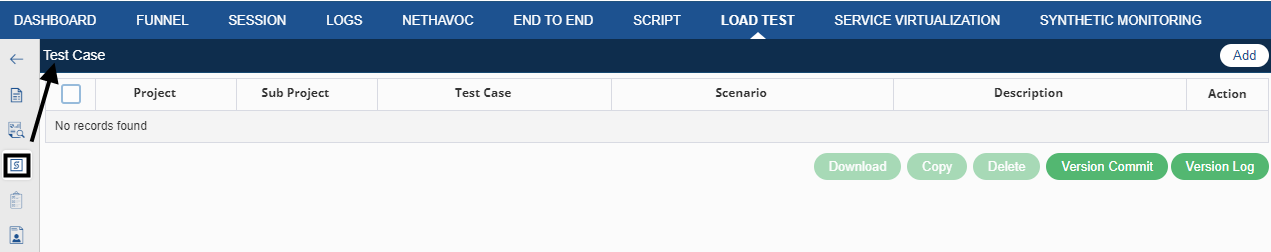
You have the following fields in the test case:
- Project: It is the directory.
- Subproject: It is also directory.
- Test Case: Here the test name added is mentioned.
- Scenario: Specifies the name of the scenario.
- Description: Describe the test running.
- Action: Shows the number of actions that can be taken against the test.
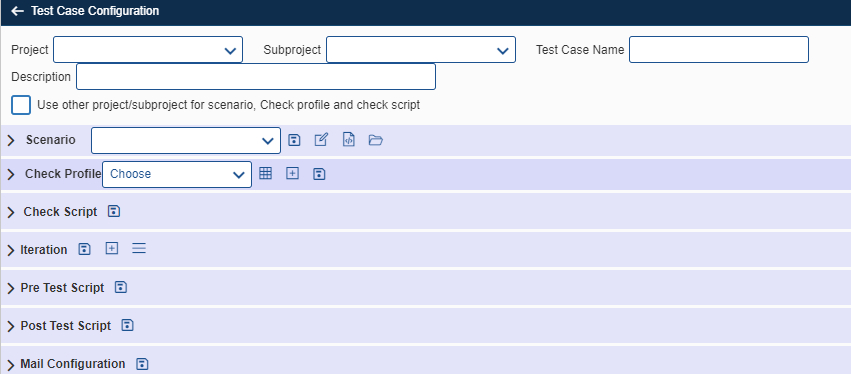
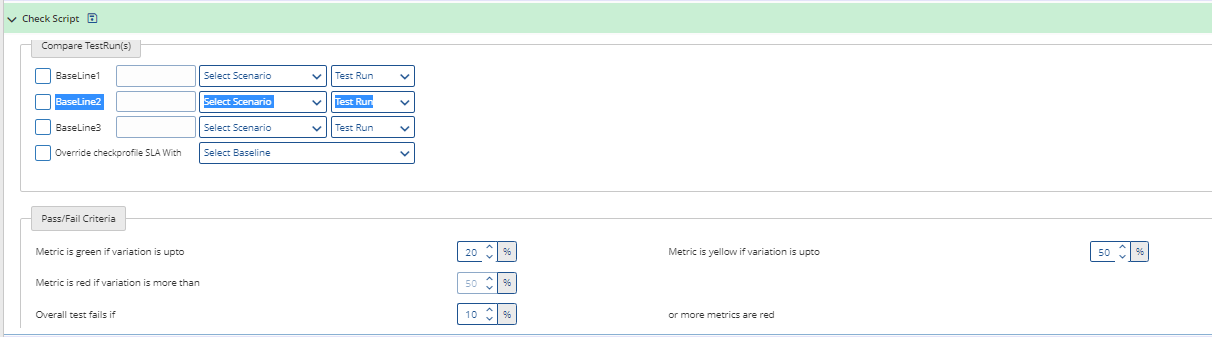
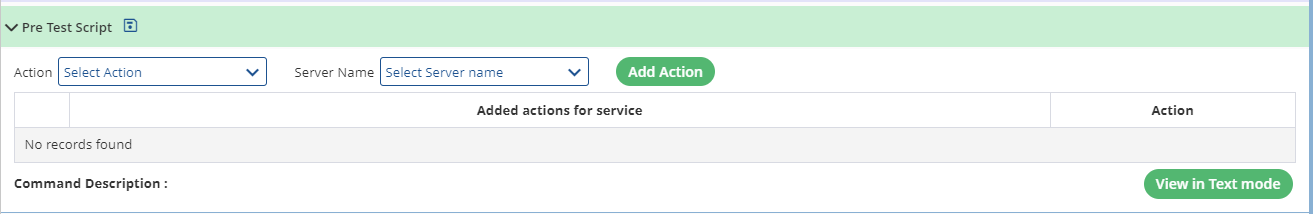
Add Test Case
To Add a Test Case, click the ![]() button. The following window will open.
button. The following window will open.

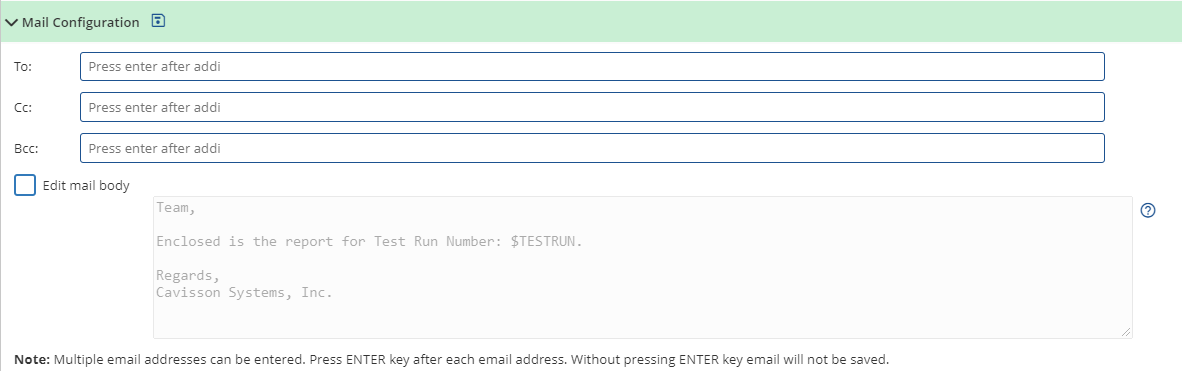
Note: Multiple email addresses can be entered. Press ENTER key after each email address. Without pressing ENTER key email will not be saved.
Test Reports
In Automation, once you click the Test Report Icon![]() , you will get the following figure.
, you will get the following figure.
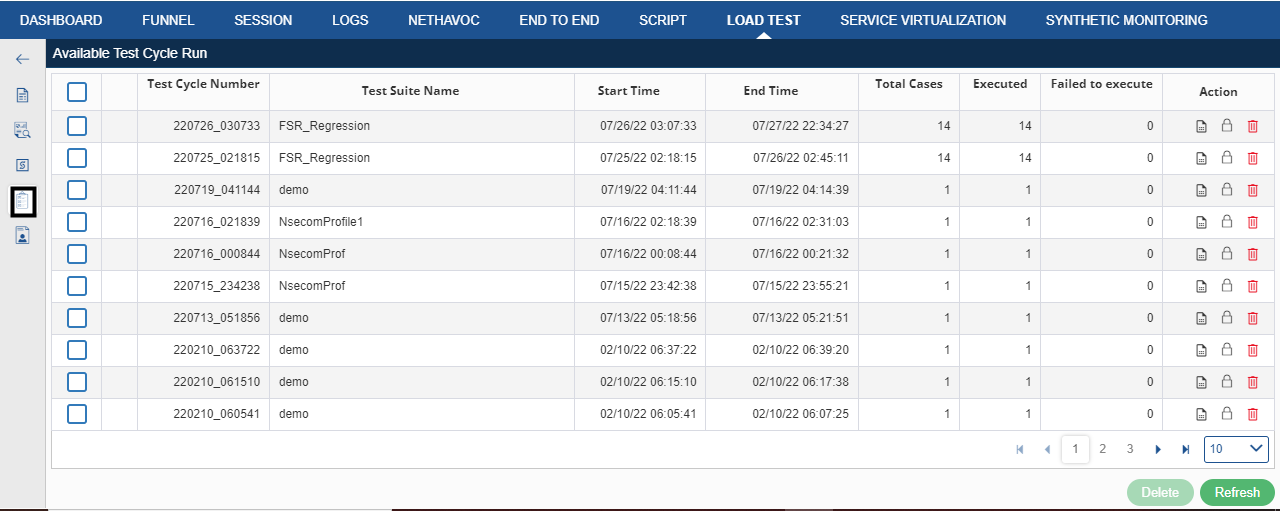
Following are the fields available on Test Report Page:
- Test Cycle Number: This is the unique number which generates on every suite execution.
- Test Suite Name: Specifies the test suite name.
- Start Time: It shows the start time of the test run.
- End Time: It shows the end time of test execution.
- Total Cases: Total number of test cases associated.
- Executed: Shows the cases which are successfully executed.
- Failed to execute: Cases that are failed to execute.
- Action: Shows various actions like showing logs, locking test cycle number, and deleting test cycle number.
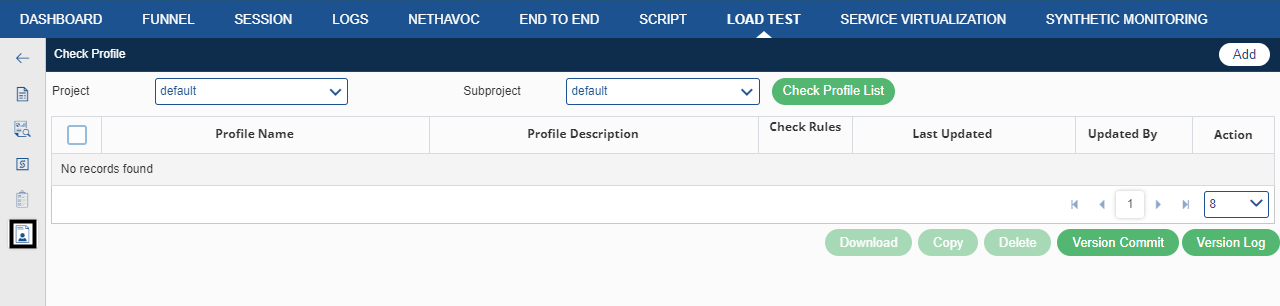
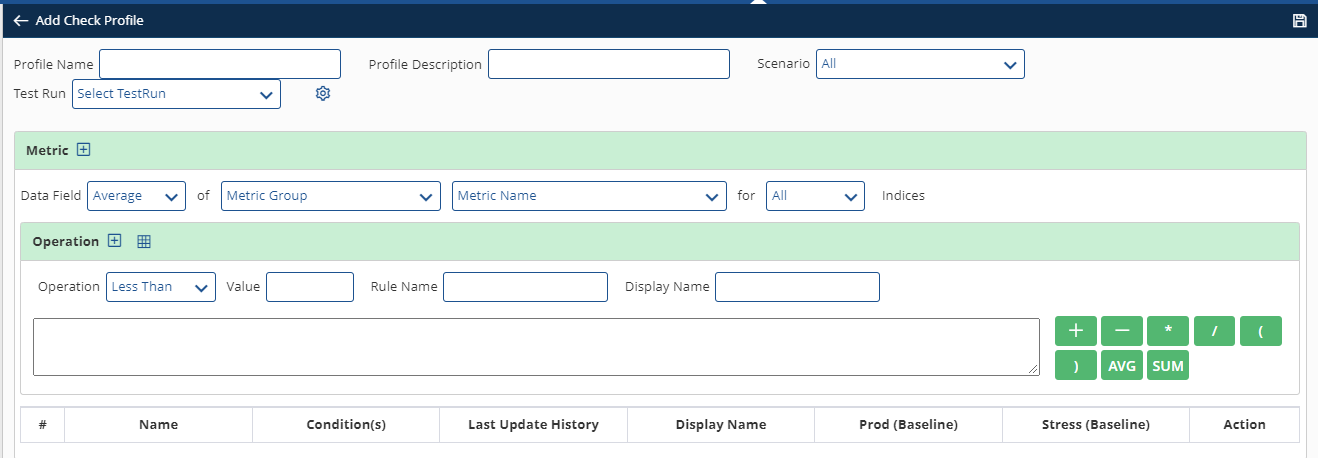
Check Profile
In Automation, once you click the Check Profile![]() Icon , you will get the following figure.
Icon , you will get the following figure.