Accessing Funnel Page

After login, on the Home page, click the Funnel tab at the top panel. The Funnel page with a default business process appears, and in the example below, that of an E-commerce platform appears as shown in Figure 3.

The figure below shows the business process funnel of the end-user-facing application. The business process is divided into different stages through which a user has to go through. Stages or the processes of a funnel change based on the selected platform that is for an e-commerce website we have different stages and for any other domain like a banking transaction we have different stages.

Figure 3: Funnel Overview page

As you can see from the Funnel page, the page is divided into two sections. The left section consists of the stage of the business process that is defined while creating a business process and the right section shows the detail of this stage. For explanation purposes, each stage is explained in the subsequent sections with the example of an e-commerce application.

Applying a Funnel Filter

To see the data in the funnel, the user need to enter data of the required business process in Business process filter. Funnel filters are required to see the data from the last 1 hour to 1 year and you can customize those data according to the user’s need. To apply business process filters:

  1. Click the Business Process Filter icon  as shown in Error! Reference source not found.. The Business Process dialog box is displayed in Error! Reference source not found.
Figure 4: Business Process Filter Icon

2. Specify the required filter settings.

3. Click the Apply button or Reset Button.

 Below figure shows the business process filters.

Figure 5: Business Process Dialog Box

You can specify the following filters for analyzing a business process

  • Business Process Name: Select a business process that has been added and that you want to analyze.
  • Channel: It is the channel from where the site is accessed, such as Dotcom, mobile, POSF, or all. By default, the channel is selected as All.
  • User Segment: It is a group of users having some common behavior or attributes.
  • Time Filter– In the time filter you can select either of the following based on the requirement:
Figure 6: Time Filter
  • Last: It generates data against the selected business processes based on a particular duration. By default, the ‘’Last’ value is 1 day.
  • Custom: It generates data against the selected business process based on the specified dates and time range. You can specify the time duration containing the date range (in mm/dd/yy) and time range (in hh:mm: ss). All the steps within the business process that lie within that duration are generated. By default, the date ranges from the current date to the current date and the time ranges from (00:00:00) to (23:59:59).

Let us take an example of SA checkout to understand the funnel process.

SA Index Page

This stage shows the number of customers who have visited the website and the number of users who have actually gone to the next step of adding the item to the cart. It also denotes how many of them followed the next level of the business process and how many of them drop off from the business process.

Figure 7: Product Details

For example– As you can see from Figure 7, a total of 65 customers search for the product details but only 12 of them were able to move to the next step. The remaining users were unable to proceed to the next process mainly due to the following reasons:

  • Add to cart error
  • Feedback

Checkout

In this stage, you can see the number of users who have successfully added the product to the cart. It also denotes how many of them followed the next level of the business process and how many of them drop off from the business process.

Figure 8: Checkout

As per Figure 8, you can see that out of 23 users only 16 users were successfully able to go to the next stage. Due to technical errors on the website other users were not able to add items to the cart.

Shop

In this stage, you can see the number of users who shopped in the website. It also denotes how many of them followed the next level of the business process and how many of them drop off. Figure 9  out of 10 users, 9 were able to successfully proceed to the next stage.

Figure 9: Shop

Contact

In this stage, you can see the number of users who have provided the contact information.

Figure 10: Contact

As you can see from Figure 10 , none of the user provided their contact details.

Product

This process determines the number of users who have viewed the product and proceed to the next business process. It also denotes how many of them drop off from the business process.

Figure 11: Product

As we can see from Error! Reference source not found., out of 108 users only 12 were able to proceed to the next process. The reason for dropping off can be that the product is costly or the color user want is not available etc.

Add to Cart

In this stage, you can see the number of users who have successfully added the product to the cart. It also denotes how many of them followed the next level of the business process and how many of them drop off from the business process.

Figure 12:Add to Cart

As per the figure, you can see that out of 16 users 12 users were successfully able to go to the next stage. Due to technical errors on the website other users were not able to add items to the cart.

Order confirmation

This stage determines the number of users whose orders are confirmed. It also denotes how many of them followed the next level of the business process and how many of them drop off from the business process.

Figure 13:Order Confirmation

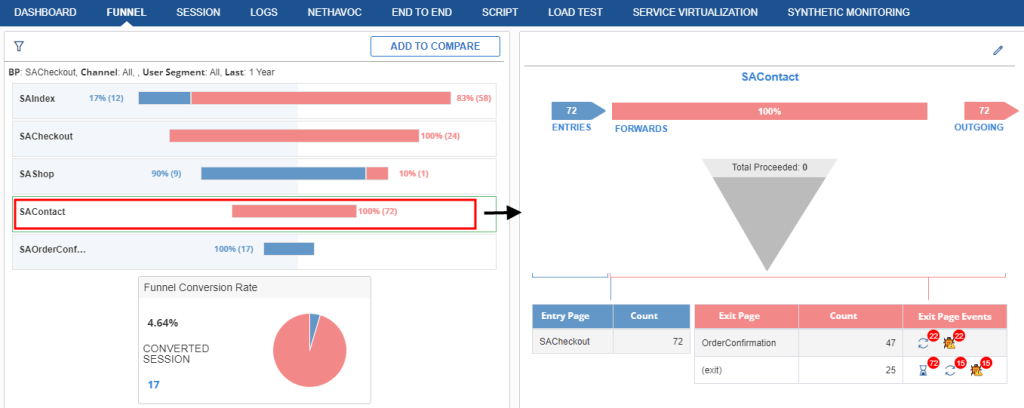
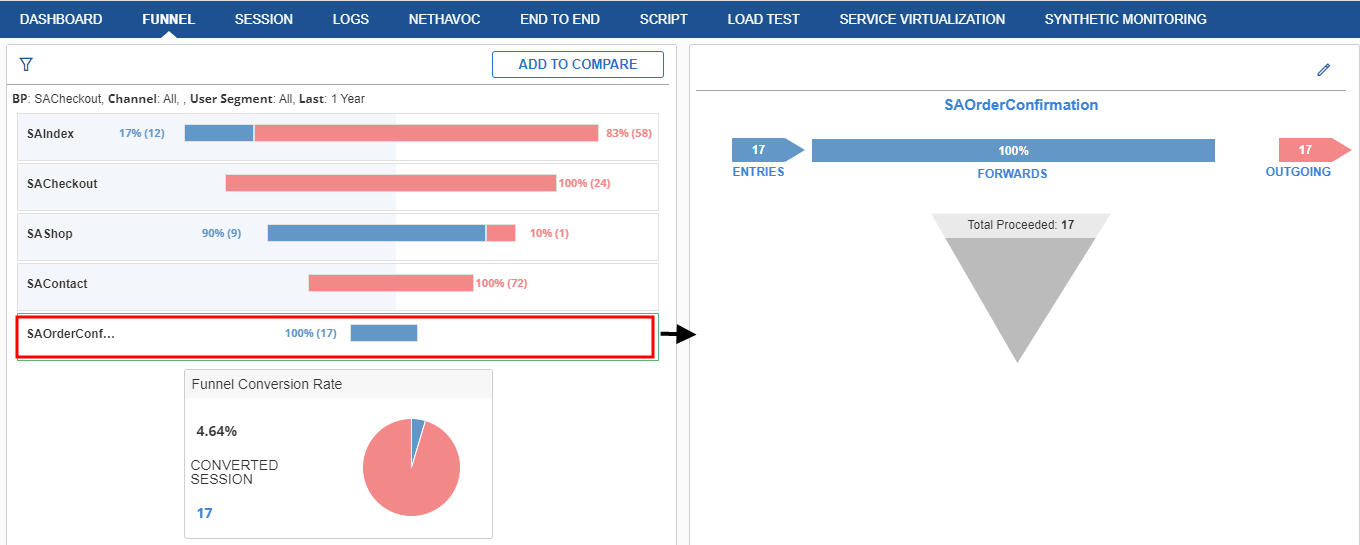
As you can see from Figure 13, all 17 users order were confirmed.

Quantifying Revenue Opportunities

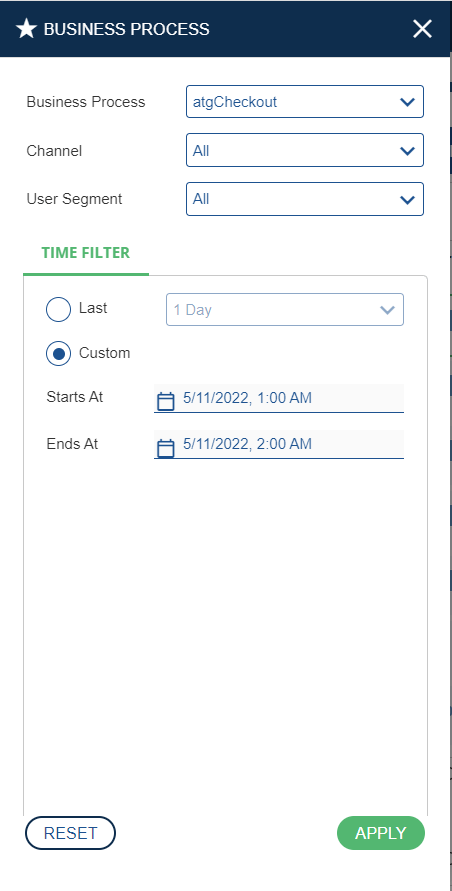
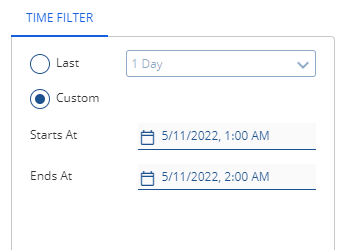
Quantifying Revenue Opportunities is done to check the effect on revenue in case the users are added or leave the website. As explained below, we change the values in the bar which changes the projected value and that quantify the revenue opportunities. You can quantify the revenue opportunities of a business process by viewing it in edit mode. To open the edit mode:

  1. Click the View Edit Mode icon as shown in Figure 14. A navigation bar is activated.
  2. Increase or decrease the values in the bar. Accordingly, the projected values get change which can quantify the revenue opportunities.
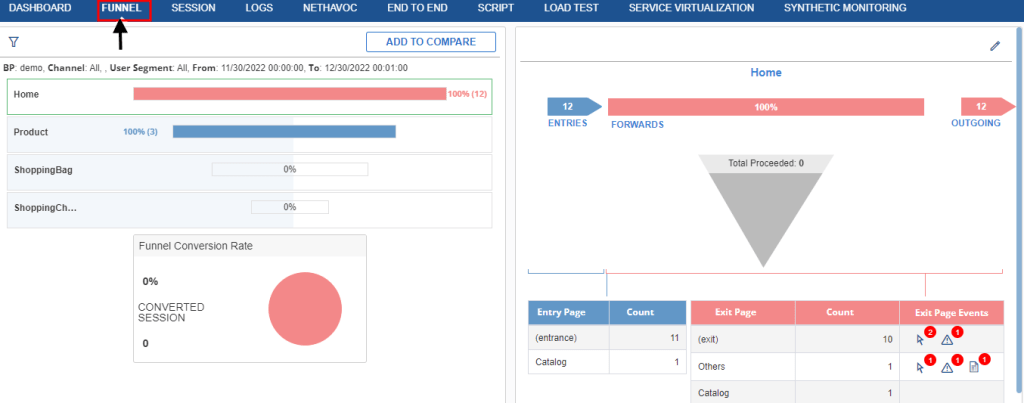
Figure 14: Home page with View Edit Mode Icon

Below is an example of this feature. As shown in Error! Reference source not found., on increasing the bar, the projected values, such as conversion rate, completed users, and revenue is also increased with the same ratio and you can quantify the revenue opportunities.

Figure 15: Navigation Bar Activated 

Analyzing a Business Process Funnel

The following figure depicts the funnel visualization of a business process:

Figure 16: Details of Process

Click the view mode icon . The following page opens.

Figure 17: Business Process Funnel(Edit Mode)

To understand the business process funnel, it is categorized into the following sections:

Section 1: The following figure displays the overall user entries that are forwarded and dropouts for that business process. It shows the conversion rate, the number of converted sessions, and the revenue value generated.

Figure 18: Conversion Details

Section 2: In the following, the Top entries to the system (for example, 154) via the defined business process are displayed.

Figure 19: Details

It also denotes how many of them (in percentage) followed the next level of the business process (for example, 64%) and how many of them (in percentage) drop off from the business process (for example, 36%). It also shows the outgoing users from that business process (for example, 57).

Section 3: The following section displays the pages from where the user went and their count (for example –cart:11, category:4, shipping :3:

Figure 20: Total Entries

Section 4: The following figure displays information about the pages where the user dropped off and the total count. It also shows the event that occurred for that page for the outgoing user for that business process.

Figure 21: Total Exit Details