Events/ Alerts

Overview

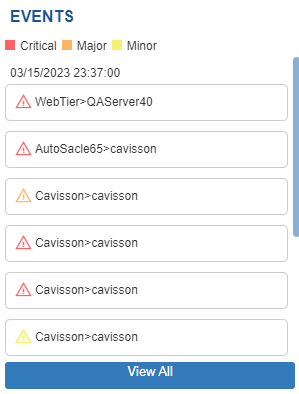
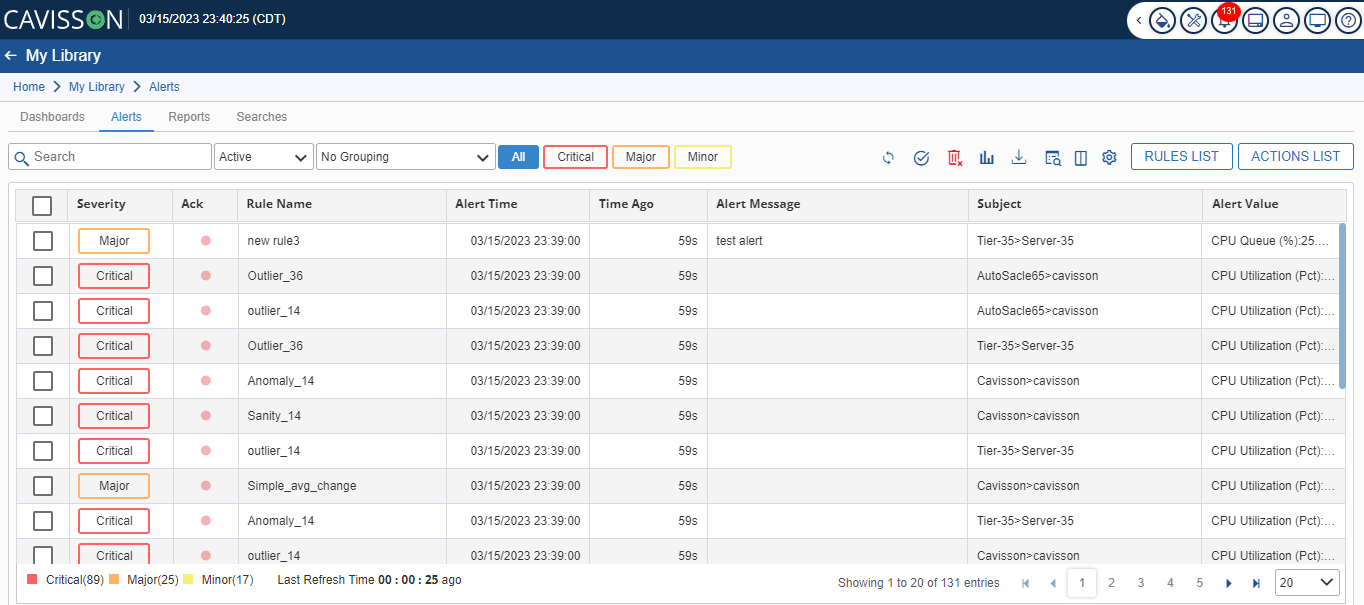
Cavisson products have in-build support of proactive alerting through which you are notified whenever a KPI (Key Performance Indicator metrics like CPU utilization, request per second, average response time, etc.) breaches the threshold configured as part of alert rules. This allows you to get early notification of performance degradation even before an actual issue happens. Using alerts, you can detect any kind of abnormal behavior of a server at multiple instance levels and be notified instantly without looking into the dashboard continuously.

How to Access

To Access events follow the below steps:

Enter the following URL https://10.10.xx.xx/UnifiedDashboard/#/login at the address bar of the browser and press ENTER. The login window is displayed.

Figure 1: Login Page

2.      Enter the Username and Password and click the Sign in button. The Product UI Home page is displayed as shown in below figure.

Figure 2: UI Home Page

You can access Events in different ways:

Option-1: From the Events button on the Top bar of the home page as shown in below figure.

Figure 3: Event

When you click View All, the Events window is displayed listing all the events as shown in below Figure.

Figure 4: Events Window

Option – 2: From User Options > My Library > Alerts as shown in below Figure.

Figure 5: Alert Window