In the Events section, you can perform the following basic operations which are discussed in details.
Basic Operations
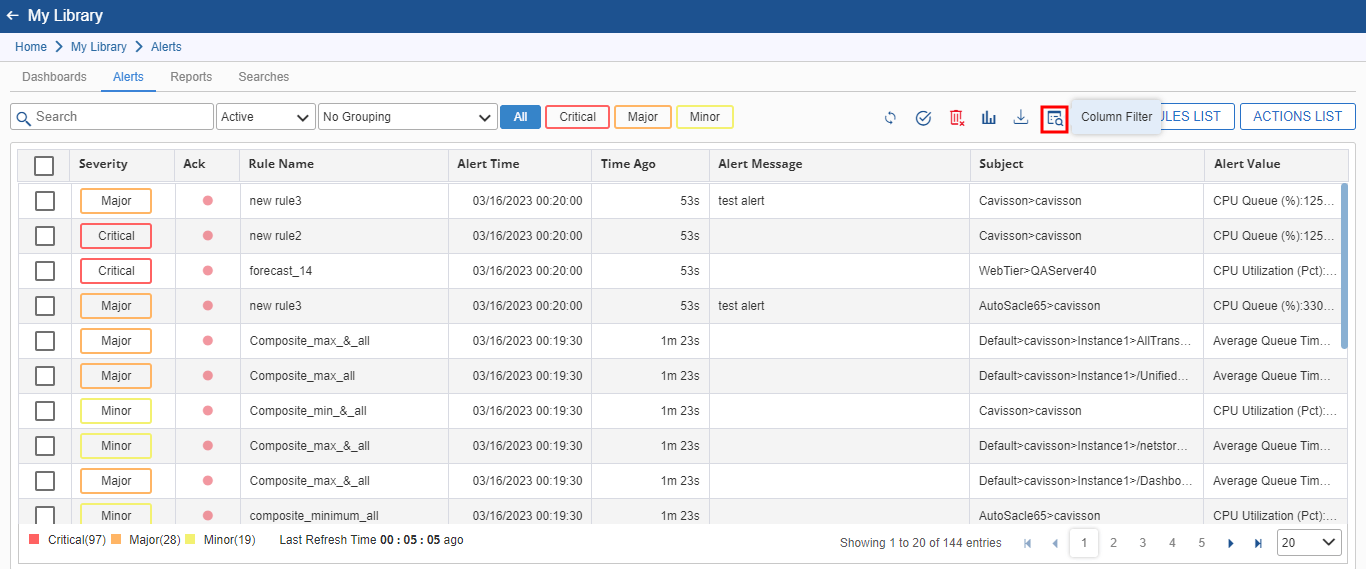
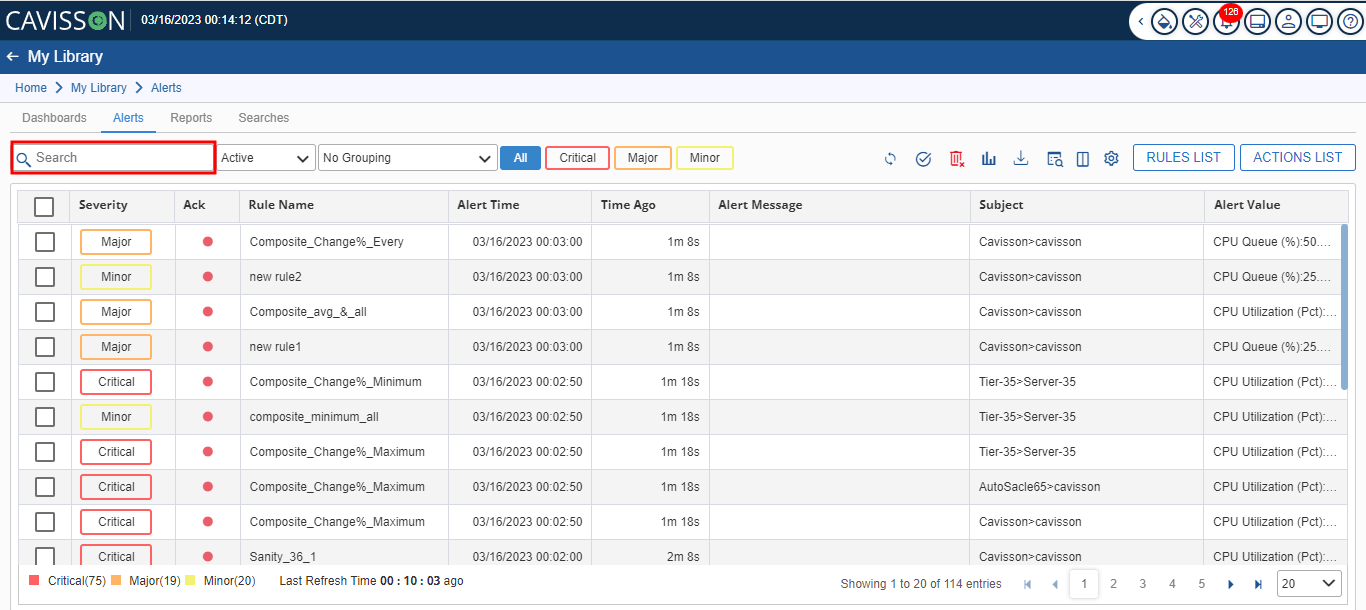
Search
In the search option ![]() , the user can search a particular alert by its Severity, Rule Name, Alert Message, and Subject.
, the user can search a particular alert by its Severity, Rule Name, Alert Message, and Subject.
You can search for an event from the list by using the Search feature. There are the following options for searching:
- Search by String. The mentioned string is searched in each column.
- Search by Category, such as: Active or History.
- Search by Levels, such as: No Grouping, Group by Subject at Level 1, Group by Subject at Level2.
- Search by Status, such as: All, Critical, Major, or Minor as shown in Below Figure.
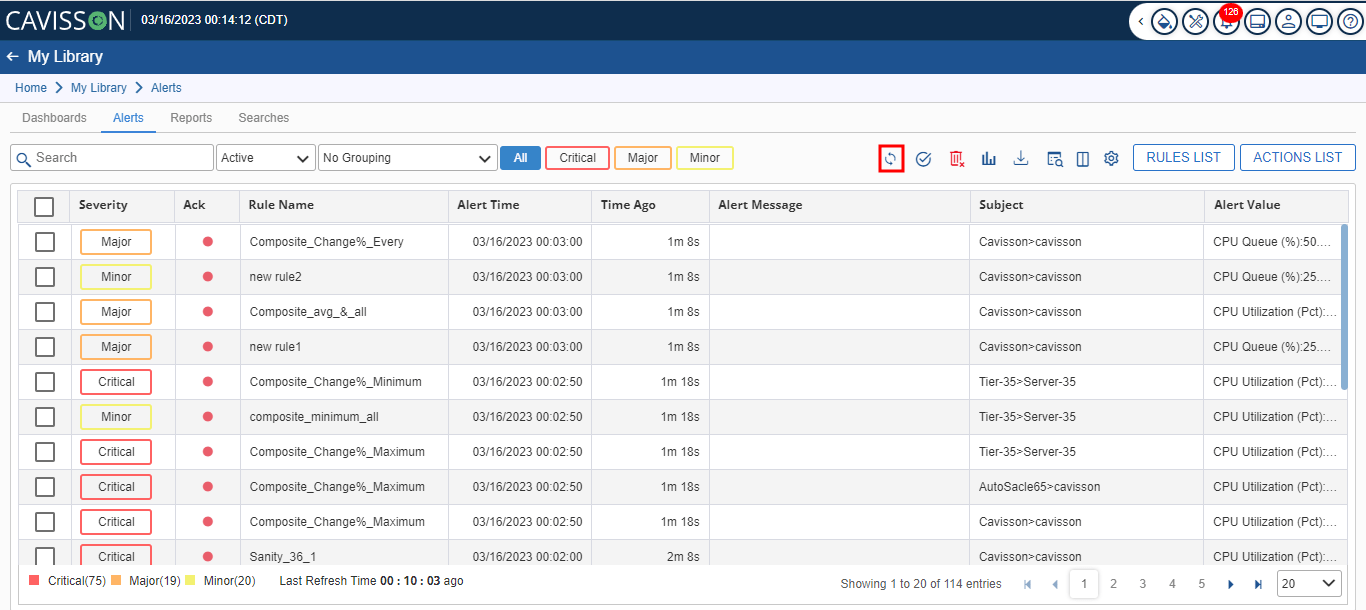
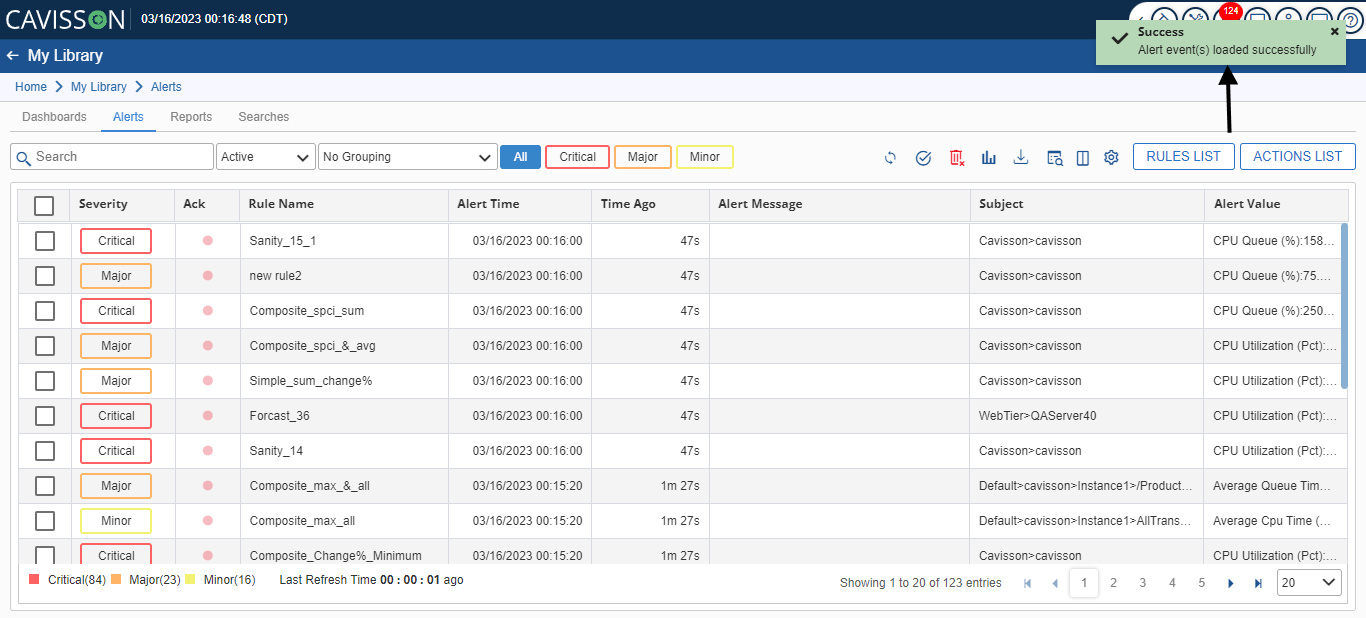
Refresh
While you click the Refresh Event button ![]() , the newly generated alerts will be updated and displayed on the Alert window. It also changes the values in the Time Ago field according to the current time. In the refresh event option, the user can refresh the alert events. A corresponding message will be generated upon selecting this option which indicates the Alert Event Loaded Successfully.
, the newly generated alerts will be updated and displayed on the Alert window. It also changes the values in the Time Ago field according to the current time. In the refresh event option, the user can refresh the alert events. A corresponding message will be generated upon selecting this option which indicates the Alert Event Loaded Successfully.
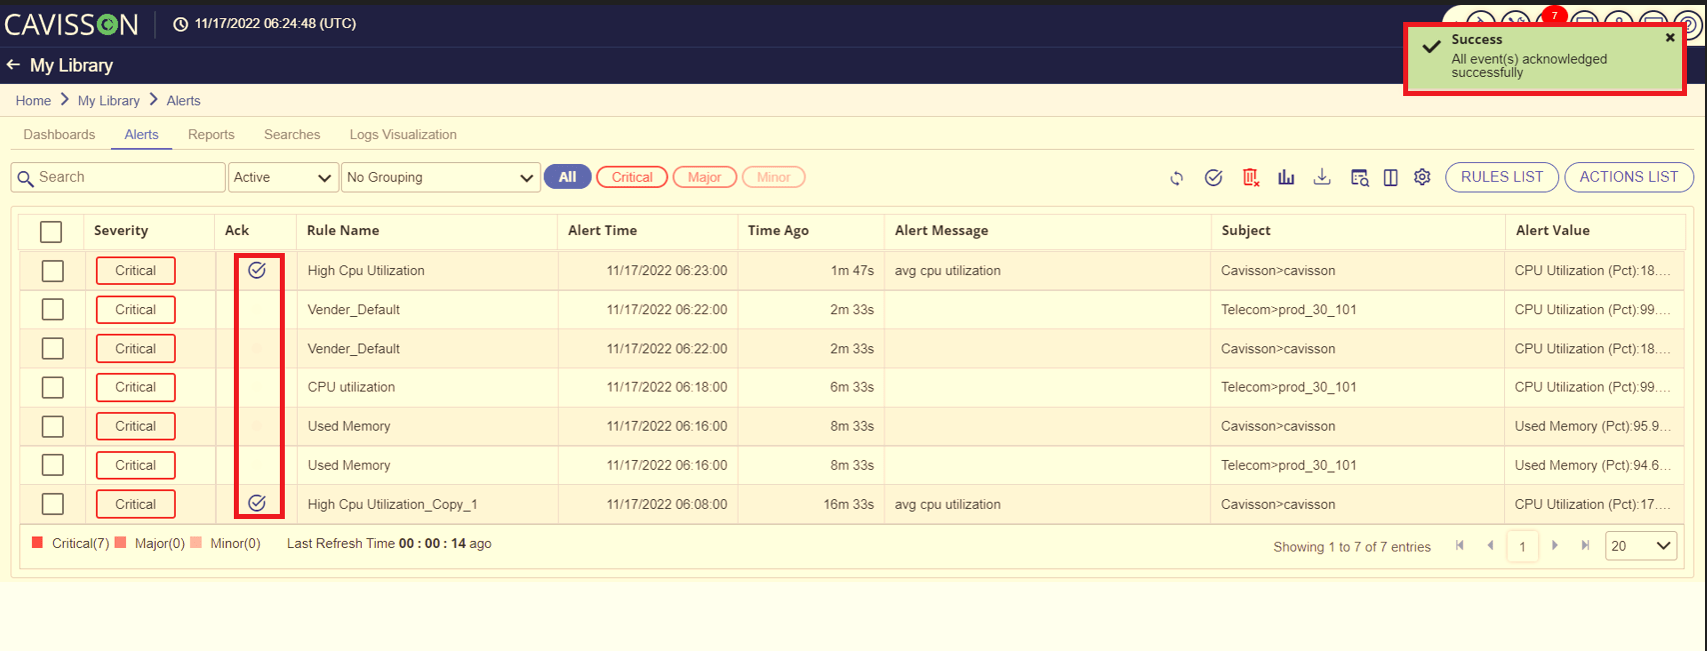
Note: In the acknowledge (Ack) option, a red dot![]() will keep on blinking until the user does not acknowledges the alert. Once the user acknowledges the alert it will stop blinking and a tick mark will
will keep on blinking until the user does not acknowledges the alert. Once the user acknowledges the alert it will stop blinking and a tick mark will![]() appear.
appear.
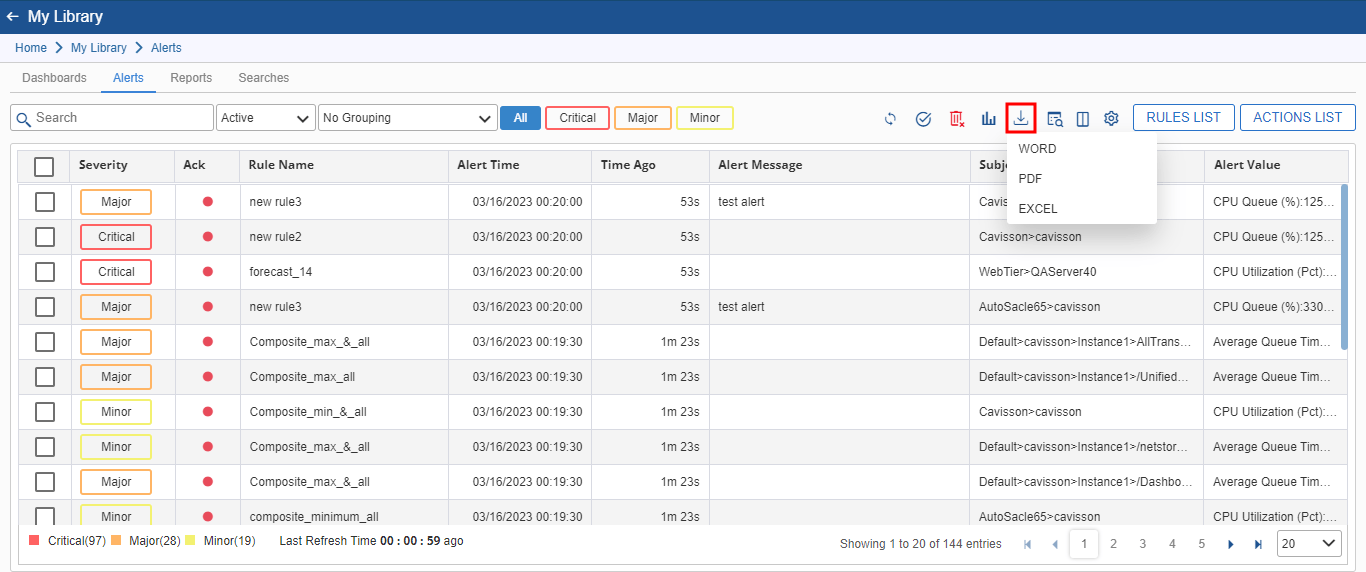
Force Clear Event
Force Clear Event is used to delete an event forcefully. To delete an event forcefully, the user has to select the corresponding severity checkbox and then they have to click on the Force Clear Event option. To clear alert(s) from the records, select the row and click the ![]() button as shown in Figure below.
button as shown in Figure below.
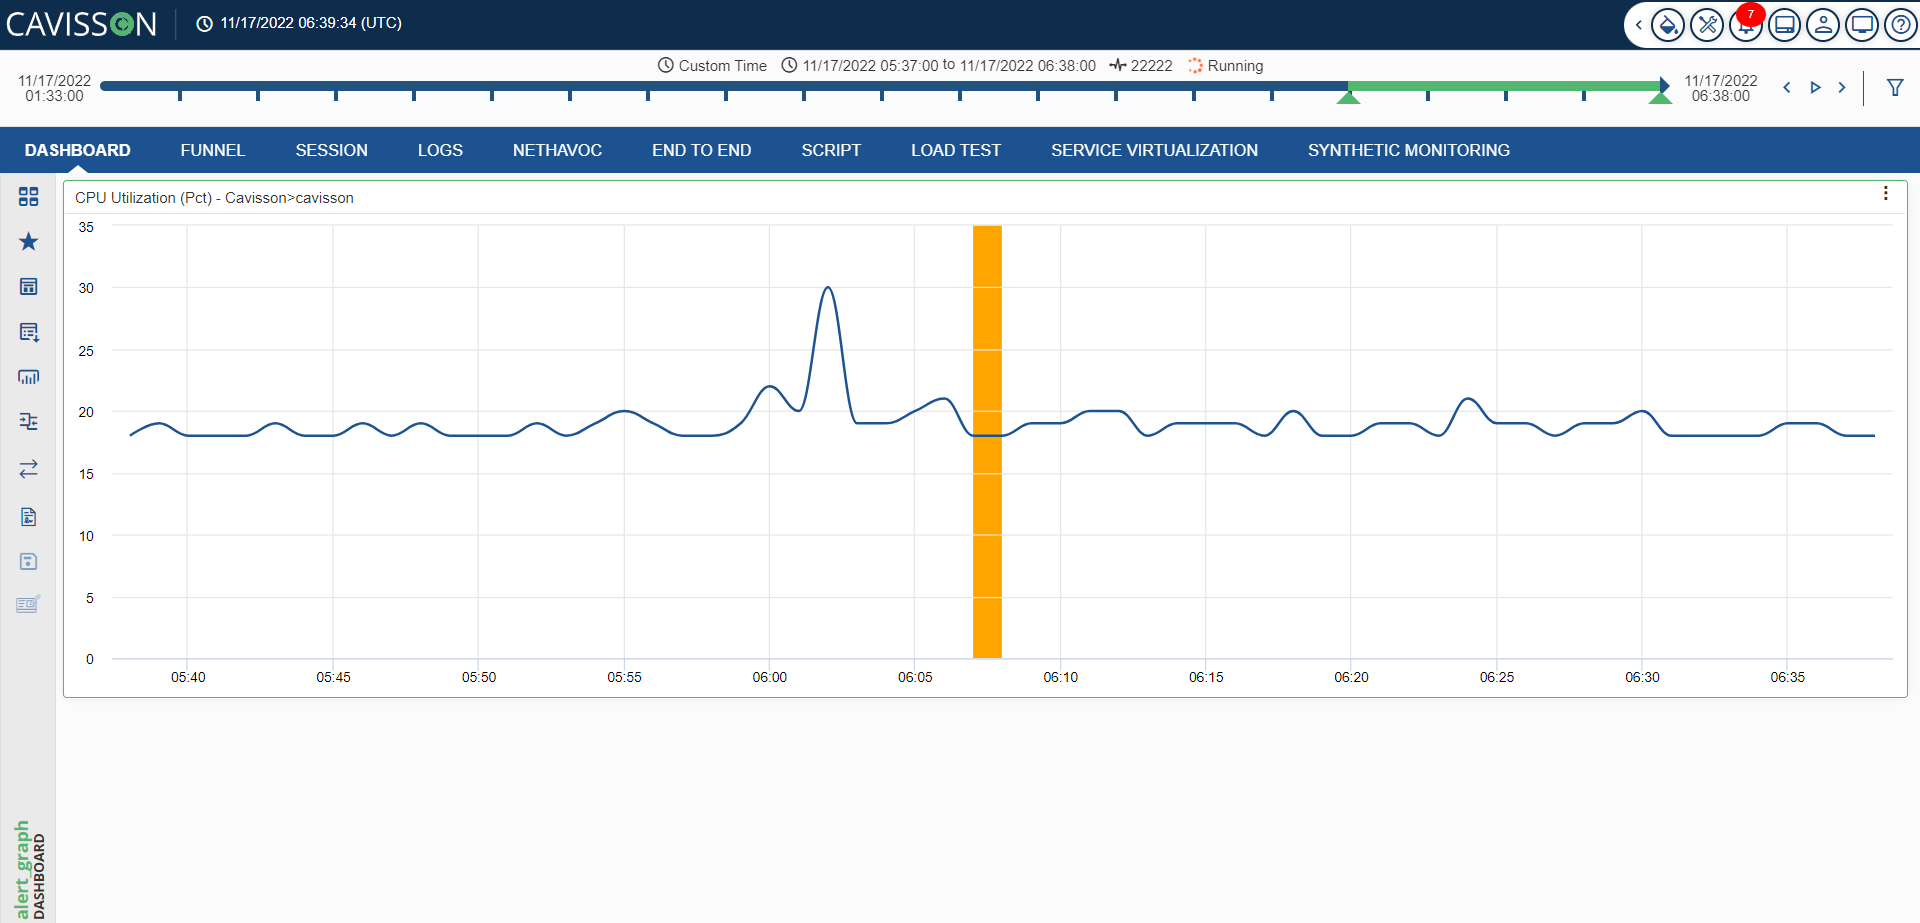
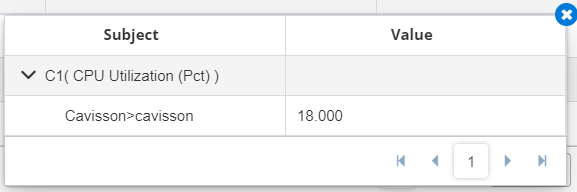
Open Graph
This option is used to open the corresponding graph for the particular alert on the dashboard. The user has to select the corresponding severity checkbox and then click on the Open Graph option.
You can open graphs in the Dashboard by clicking the![]() button. The period when the alert is generated is highlighted as shown in Figure below.
button. The period when the alert is generated is highlighted as shown in Figure below.