About Sessions
A Session is a sequence of activities that a visitor with a unique IP address spends on a website during a specified period. A visitor session begins on accessing the application and ends when the visitor quits the application. The number of visitor sessions on a site is used in measuring the amount of traffic a website gets. In a session:
- A visitor is someone who visits a tracked website page.
- A page view is when a tracked web page on your website is loaded.
- A session consists of all the visitor interactions during a given time. A session ends when a visitor exits your website, closes their browser, or after a few minutes of inactivity.
Types of Sessions
You can determine the period of a visitor session since the last request was sent (for example, 30 minutes). If the visitor returns to the site within that time, it is still considered an active session. If the visitor returns to the site after the allotted time period has expired, say an hour from the last request sent, then it is counted as a completed session.
Based on the duration of the visitor’s session, since the last request was sent, you can view Active Sessions, Completed Sessions, All, Struggling, and Healthy sessions.
Active Sessions
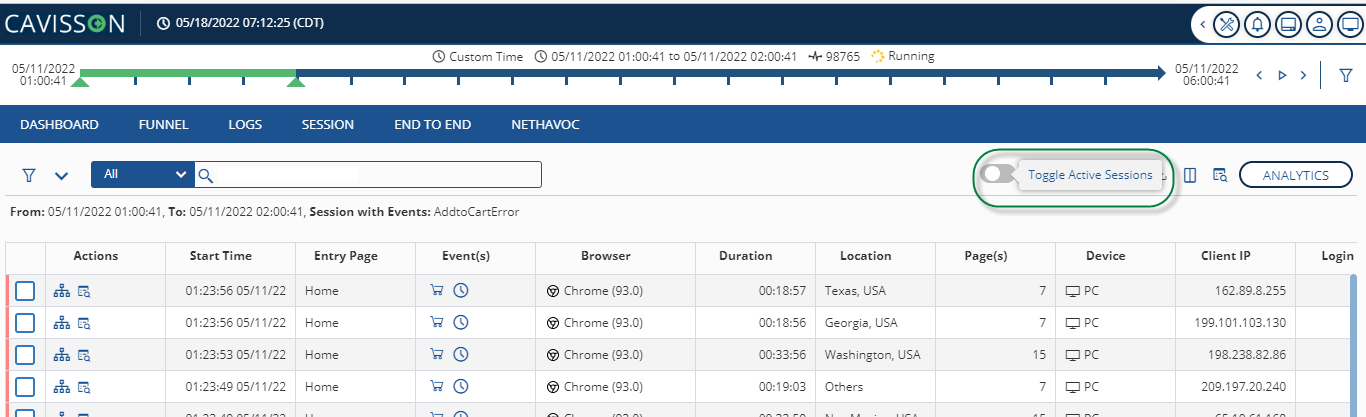
Active sessions are those sessions, which are currently in an active state. It means, a visitor is currently accessing the site and the time since the last request sent by the visitor is within the time limit specified for session expiration. If the visitor’s session time (since the last request was sent) goes beyond the session expiration time, it is considered a completed session.
By default, Session Window shows the details of the Completed sessions in the Session window. To view the list of active sessions, turn on the toggle button. as shown in Figure 3.
Completed Sessions
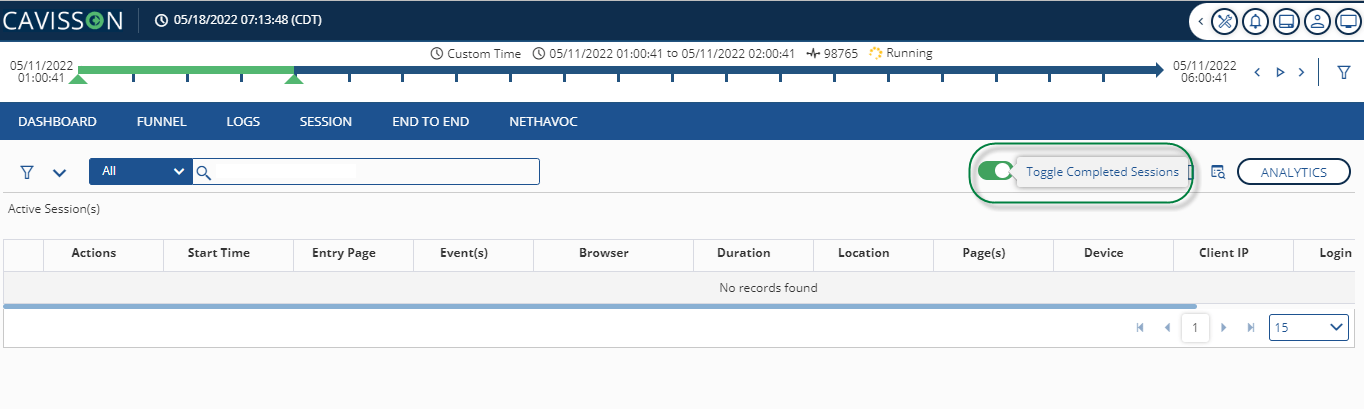
Completed sessions are those sessions, which are currently in the completed state. It means a visitor accessing the site has crossed the time specified by the user since the last request was sent.
By default, when the user navigates to the Session tab, the completed session is displayed as shown in Figure 4.
Struggling Sessions
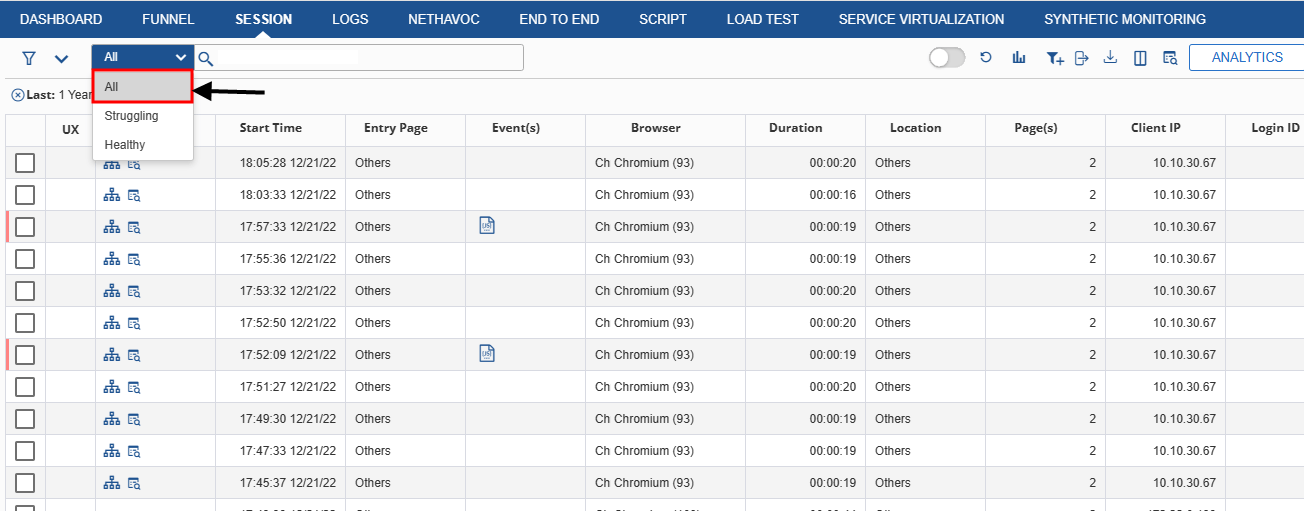
A struggling user is a visitor who faces some problems while accessing the site, such as cannot login to the site, cannot find the payment options while navigating the site so many times, cannot locate the items for which they are searching, and so on. All those sessions, which are related to a Struggling user, are Struggling User Sessions. Applying this filter generates a list of Struggling User sessions.
Select the Struggling option from the drop-down in the Session window as shown in Figure 6 to display a list of all the sessions where the user faced problems on your website.
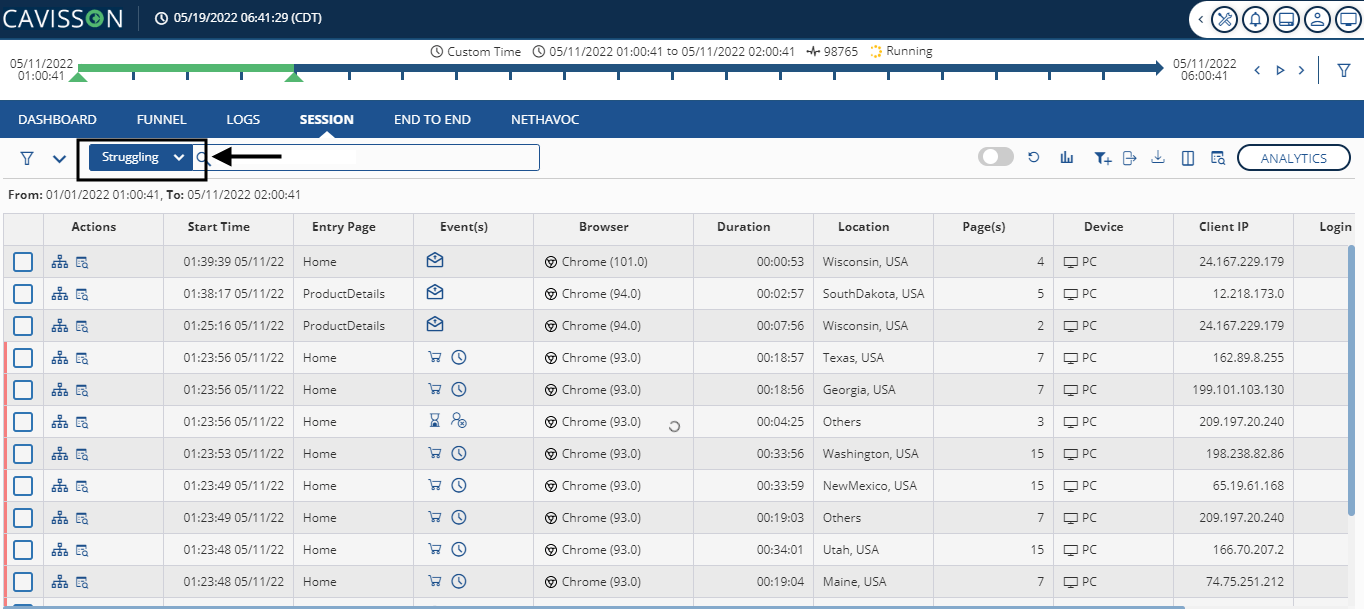
Note: The Black Arrow Line alongside the screen indicates the struggling sessions.
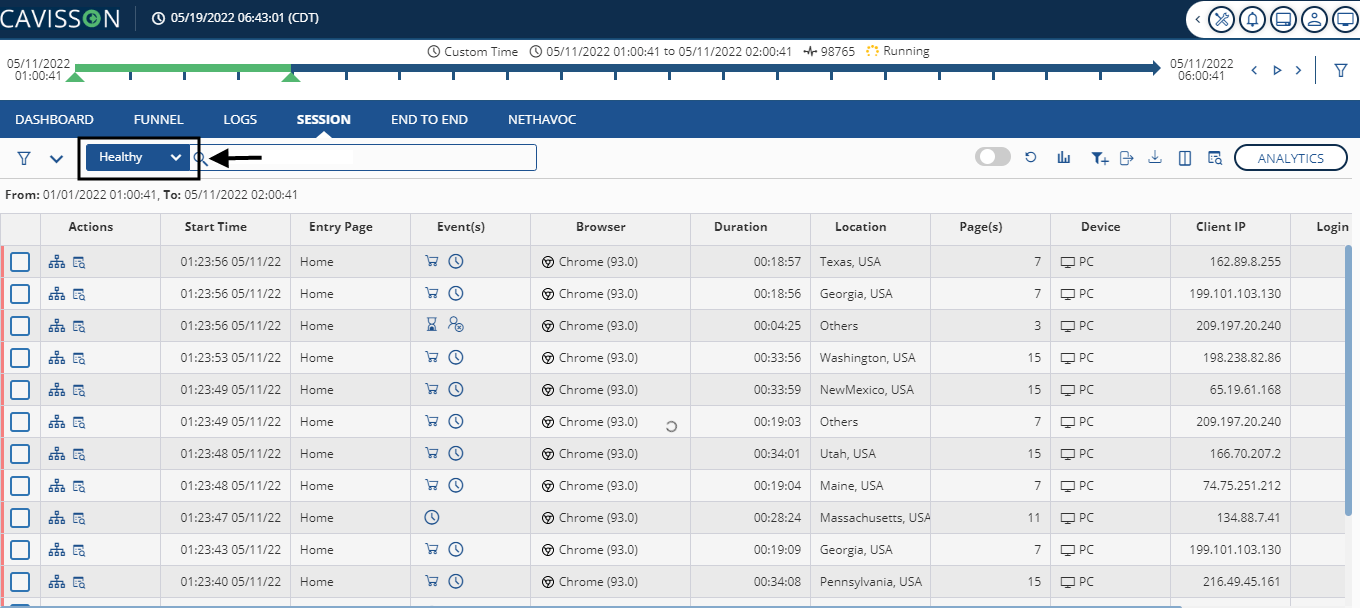
Healthy Sessions
In healthy sessions, users can access the site without having any bad user experience (high page response, errors, etc.) and are also able to complete the session successfully.
Select the Healthy option from the drop-down in the Session window as shown in Figure 7 to display a list of all the sessions where the user was able to successfully access the Website.
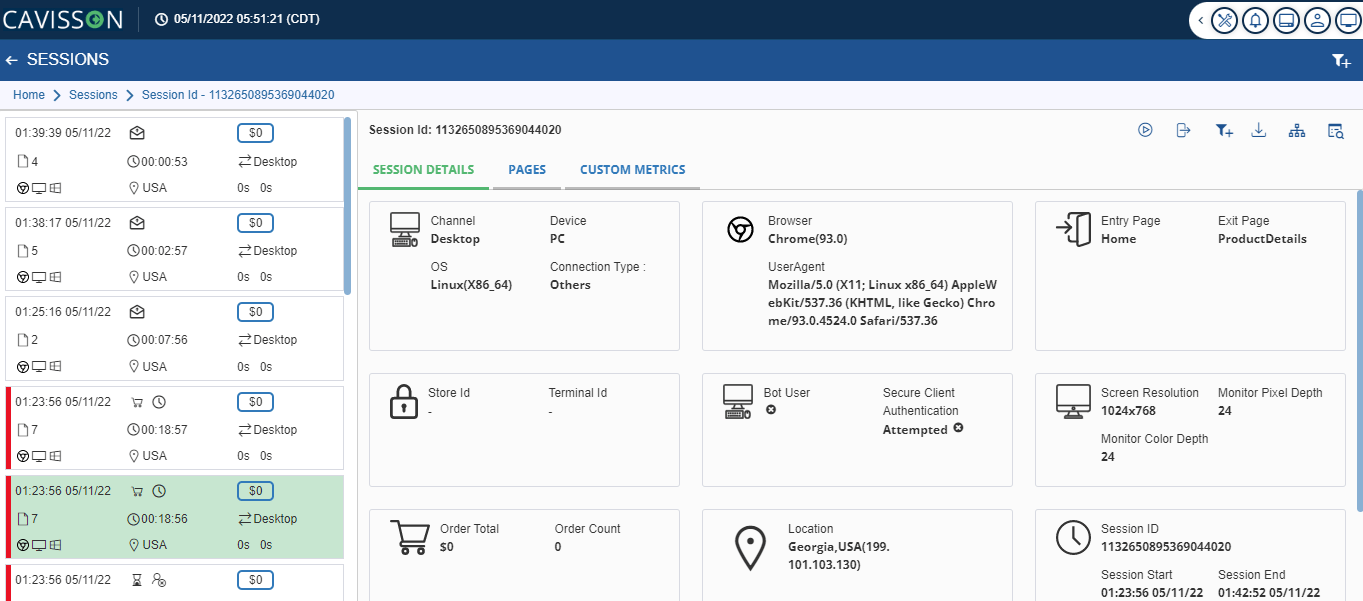
Attributes of a Session
After you select a session, the following attributes of the session are displayed as shown in Figure 8:
Column Name | Description |
Start Time
| Displays the time when the session started. The format is hh:mm: ss mm/dd/yy. By default, it is sorted in descending order, which means the latest session is at the top. |
Entry Page | Displays the page from where a visitor entered the site. When a visitor hits the site address on the browser, by default the home page is displayed. From there only, visitors can proceed and access the site. |
Events | Displays the event name. An event is a situation a visitor might face while accessing a site. For example – Items out of stock, items not found for international shipping, Invalid reward code, Invalid promo code, Coupon expired, Session expired, etc. |
Browser | Specifies the browser name from which the visitor is accessing the site. The browser name is displayed along with the version. For example – Firefox (24.0). |
Location | Displays the location from where the visitor is accessing the site. The location contains information on – Region, Location, and Client IP. |
Session Duration | Displays how long the session is performed. The format is hh:mm: ss. |
Last Page | Displays what was the last page visitor accessed on the site and exited from there. |
Device | Shows from which device the user is accessing the site. For example – PC, Laptop, iPad, Mobile, etc. |
Pages | Displays the number of pages recorded. |
Order Total | Shows the Order total. |
Session Reports
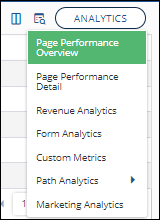
In the Session window, you can analyze the following types of reports:
- Page Performance Overview
- Page Performance Details
Page Performance Overview
The Page Performance Overview window provides a brief overview of all the pages of an application. In this window, you can view the page count, timing data, and exit rate of all the pages of an application.
To view the page performance overview:
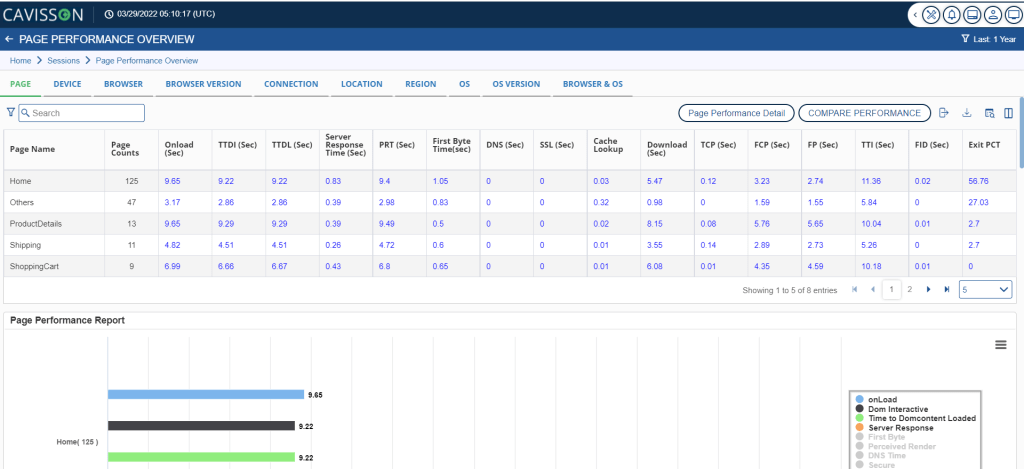
Select the Page Performance Overview option from the Analytics menu as in Figure 9
The Page Performance Overview window is displayed, as shown below in Figure 10.
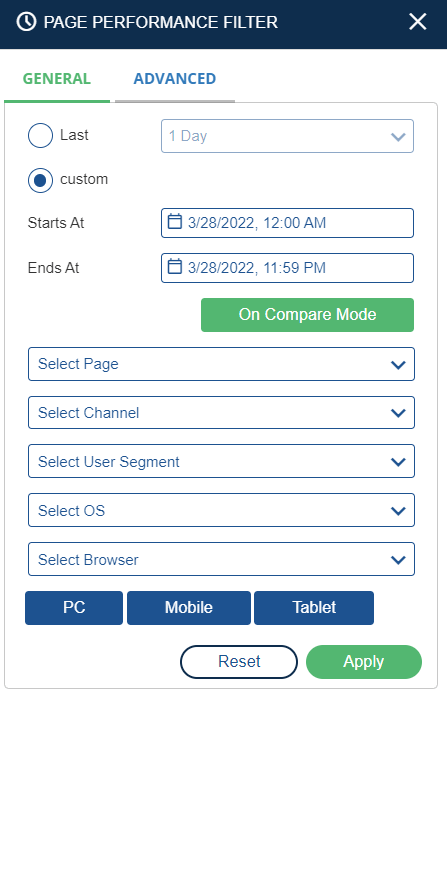
Specify the following filters:
- Last: Specify time filters, such as last duration (such as 15 minutes, 1 hour, 1 week, 1 day, 1 week, and so on).
- Custom: Specify the required date and time range.
- Select Page: This is the entry page from where the session is accessed.
- Select Channel: This is the channel from where the site is accessed, such as Dotcom, mobile, POSF, or all.
- Select User Segment: This is a group of users having some common behavior or attributes.
- Select Device: This denotes the device, such as a PC, mobile, or tablet on which the session is accessed.
- Select Operating System: This denotes the operating system used for accessing the site.
- Select Browser: This denotes the browser used while accessing the site.
- Advanced Filters: Click the Advanced Filter tab to apply some advanced level filters to include/exclude in the results.
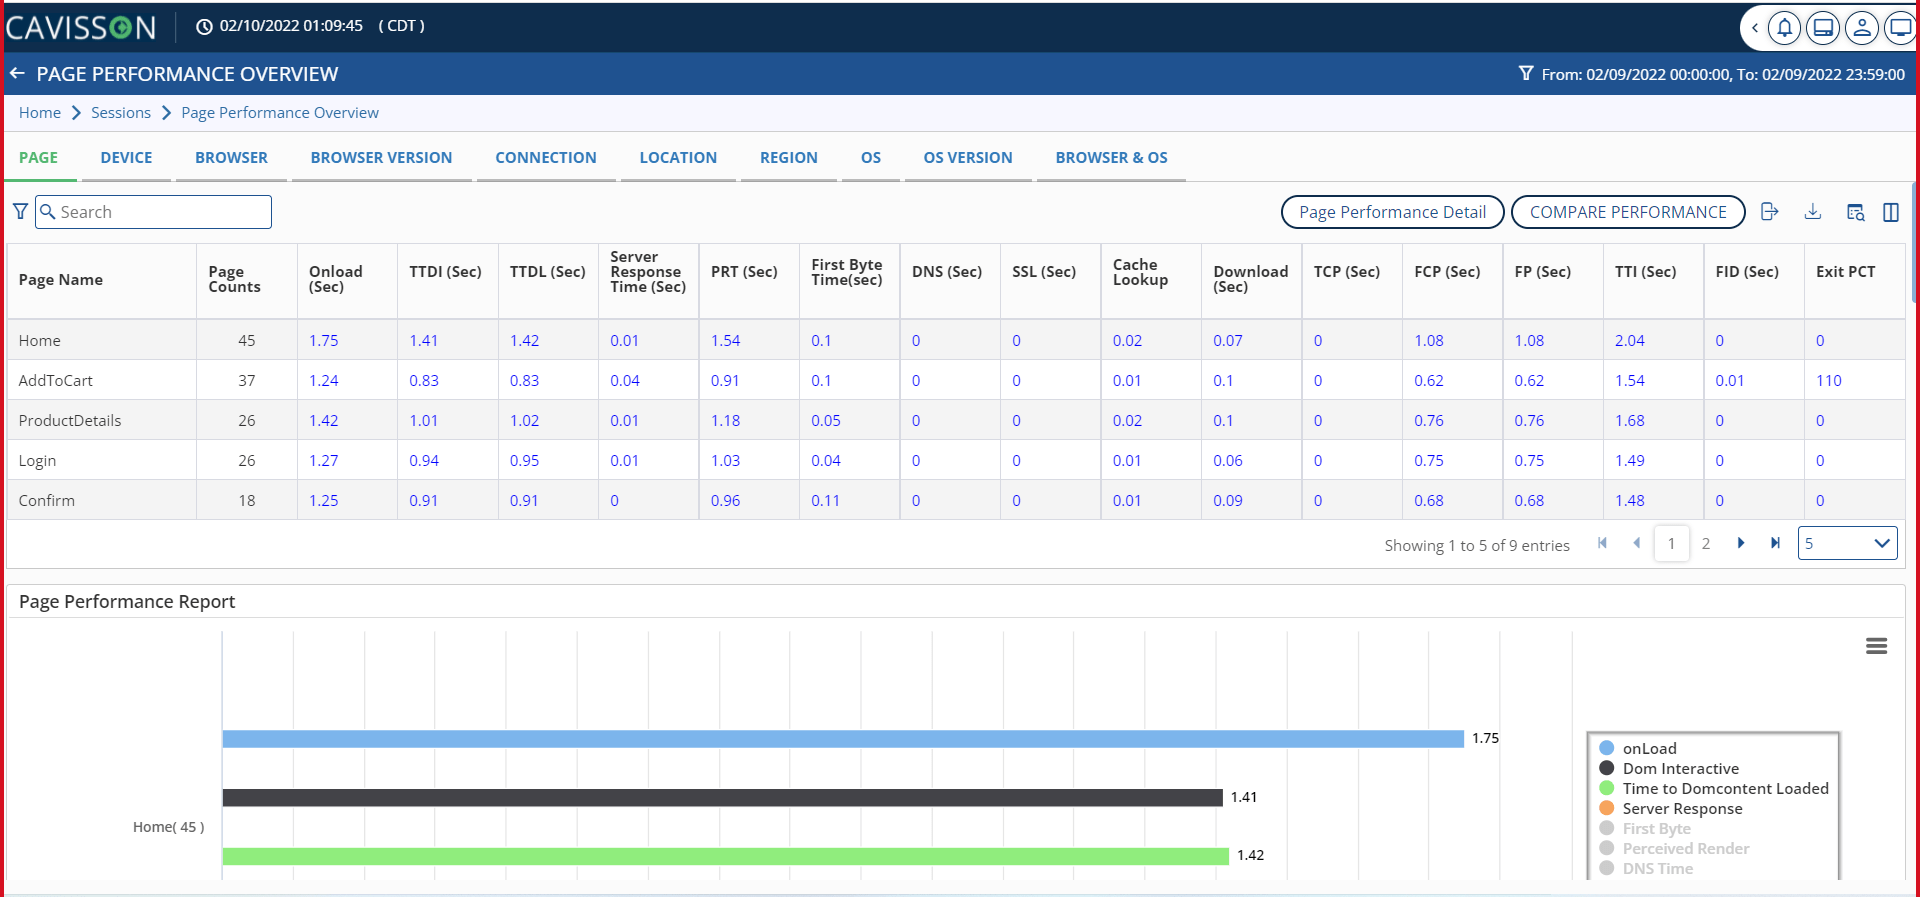
After applying filters, click the Apply button. The Page performance overview is displayed in tabular and graphical format as in Figure 12.
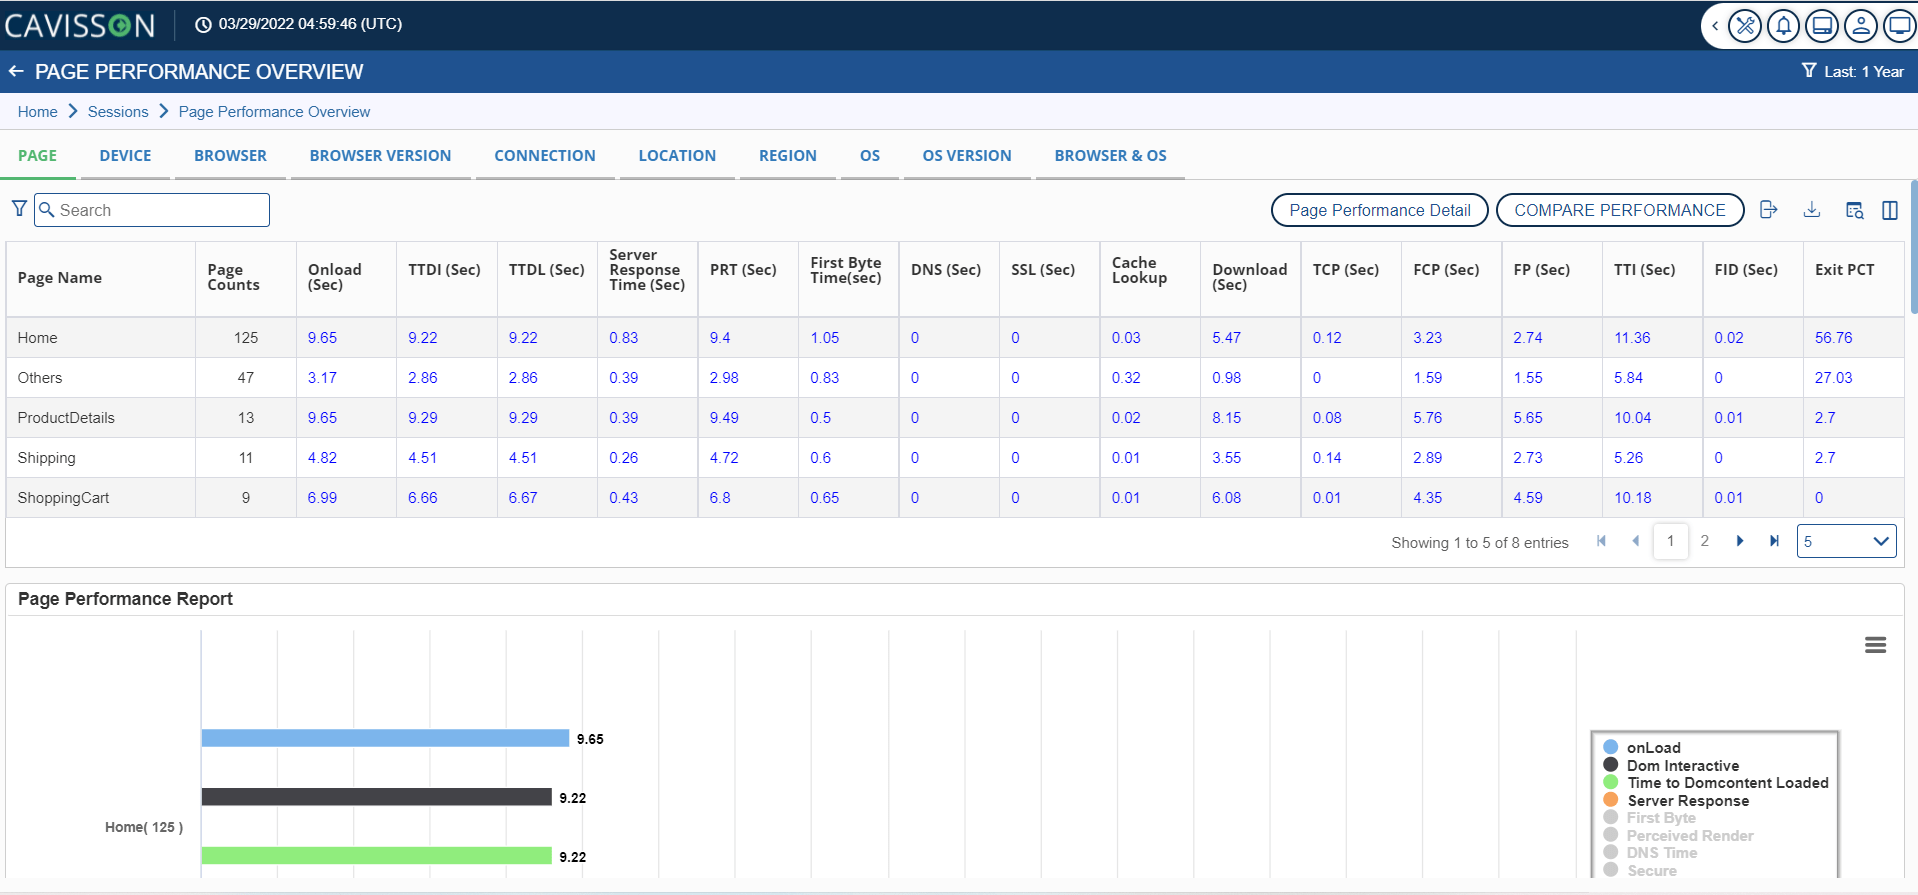
Page Performance Overview – Tabular Format
The tabular format displays information around pages, such as list of Page Name, Page Count, OnLoad time, Time to DOM interactive (TTDI), Time to DOM load (TTDL), Server Response Time, Perceived Render Time (PRT), First Byte Time, DNS lookup time, SSL, Cache Lookup time, main URL download time, connection time, and exit rate.
Page Performance Overview- Graphical Format
The graphical format of the displayed page performance information, such as Onload time, DOM interactive time, time to DOM content download, and other information in graphical format. On the Y-axis, there are pages, and on the X-axis, the value is defined in seconds. In the same manner, information about other tabs, such as Device, Browser, and rest is displayed.
The information is categorized in various tabs, such as Page, Device, Browser, Browser Version, Connection, Location, Region, Operating System, OS (versions), and Browser & OS. By default, the Page tab is displayed as shown in Figure 12. Let us discuss them in detail.
Device
Device tab shows the page performance according to the device used by the end users.
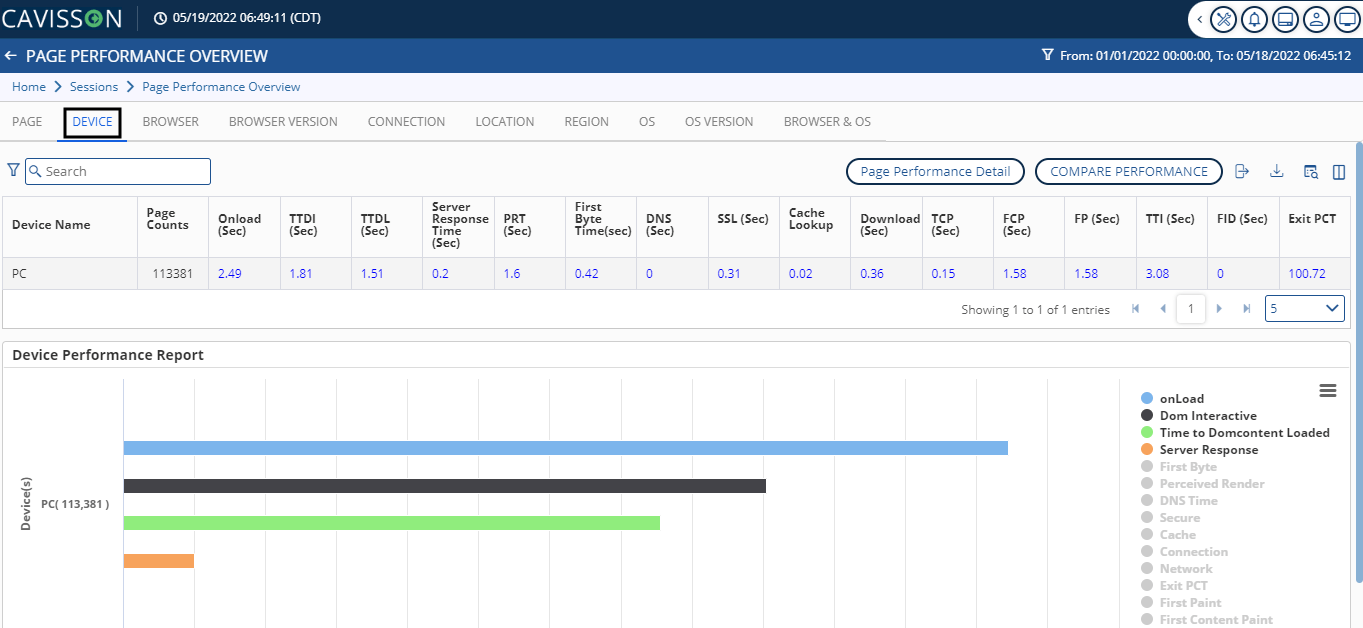
In the device tab, we can see the following options as we can see in Figure 14:
- Device Name-This shows from which device the user is accessing the website.
- Page Counts-It denoted the number of pages accessed in a session.
- Onload (Sec)- Onload time occurs when the processing of the page is complete and all resources of the page have finished downloading.
- TTDI (Sec)-It stands for Time to DOM interactive. This is the point where the browser has finished loading and parsing HTML.
- TTDL (Sec)-This stands for Time to DOM load. It is the point at which DOM is ready and there are no stylesheets blocking JavaScript execution.
- Server Response Time (Sec) – Server response time is the wait time of the main URL.
- PRT (Sec) – Perceived Render Time is the time when the viewpoint area of the client browser is visually complete.
- First Byte Time (Sec) -This is the total amount of time spent to receive the first byte response once it has been requested.
- DNS (Sec)- DNS resolution time is the time required to resolve the host name.
- SSL (Sec)-This is the time required for SSL negotiation.
- Cache Lookup– It is the time taken by the browser to look up the main URL in the browser cache.
- Download (Sec)-Total time taken in downloading the main URL response.
- TCP (Sec)- This is the time required for a TCP handshake. It does not include SSL/TLS negotiation.
- FCP (Sec)- First Content Paint Timestamp reporting the time when any content is painted i.e. something defined in the DOM.
- FP(sec)- First Paint timestamp reports when the browser started to render the page after navigation.
- TTI (Sec)- Time To Interactive is when the website is visually usable and engaging.
- FID (Sec)-First Input Delay (FID) measures the time from when a user first interacts with your site to the time when the browser is able to respond to that interaction.
- Exit PCT– It defines the number of users(percentage) exited from a session.
Browser
Specifies the browser name from which the visitor is accessing the site.
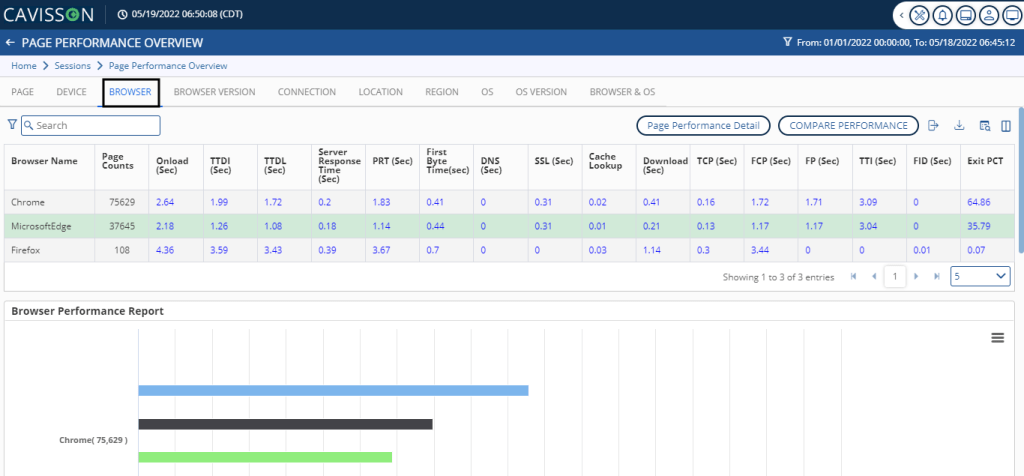
In the browser tab, we can see the following options as in Figure 15:
- Browser Name– This shows the browser name from which the visitor is accessing the site.
- Page Counts– This denotes the number of pages accessed in the session.
- Onload (Sec)- Onload time occurs when the processing of the page is complete and all the resources on the page have finished downloading.
- TTDI (Sec)– Dom interactive time is the point at which the browser has finished loading and parsing HTML, and the DOM (Document Object Model) has been built.
- TTDL (Sec)- DOM Content loaded time is the point at which the DOM is ready and there are no stylesheets blocking the JavaScript.
- Server Response Time (Sec)- Server Response Time is the wait time of the main URL.
- PRT (Sec)- Perceived Render Time is the time when the viewpoint area of the client browser is visually complete.
- First Byte Time (Sec)- This is the total amount of time spent to receive the first byte response once it has been requested.
- DNS (Sec)- DNS resolution time is the time required to resolve the host name.
- SSL (Sec)- This is the time required for SSL negotiation.
- Cache Lookup-This is the time taken by the browser to look up the main URL in the browser cache.
- Download (Sec)– Total time taken in downloading the main URL response.
- TCP (Sec)– This is the time required for a TCP handshake. It does not include SSL/TLS negotiation.
- FCP (Sec)– First Content Paint Timestamp reporting the time when any content is painted i.e something defined in the DOM.
- FP (Sec) – First Paint timestamp reports when the browser started to render the page after navigation.
- TTI (Sec)– Time to Interactive is when the website is visually usable and engaging.
- FID (Sec)– First Input Delay (FID) measures the time from when a user first interacts with your site to the time when the browser is able to respond to that interaction.
- Exit PCT– It defines the number of users (percentage) exited from a session.
Browser Version(s)
This displays the browser version of the browser from which the user is accessing the site. For example- Firefox (24.0).
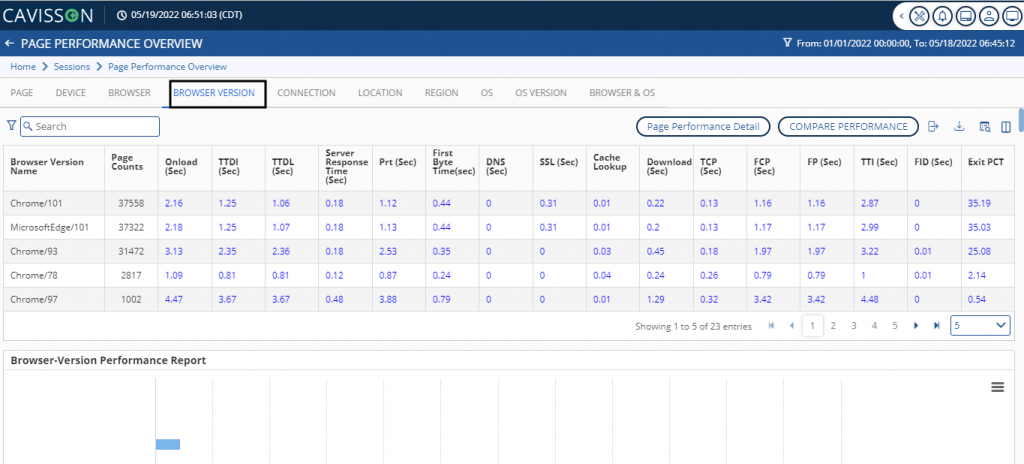
In the browser version tab, we can see the following options shown in Figure 16:
- Browser Version Name-Version of the browser which the user used to visit the website.
- Page Counts– It denoted the number of pages accessed in a session.
- Onload (Sec)– Onload time occurs when the processing of the page is complete and all resources of the page have finished downloading.
- TTDI (Sec)– It stands for Time to DOM interactive. This is the point where the browser has finished loading and parsing HTML.
- TTDL (Sec)– This stands for Time to DOM load. It is the point at which DOM is ready and there are no stylesheets blocking JavaScript execution.
- Server Response Time (Sec)– Server response time is the wait time of the main URL.
- PRT (Sec)– Perceived Render Time is the time when the viewpoint area of the client browser is visually complete.
- First Byte Time (Sec)– This is the total amount of time spent to receive the first byte response once it has been requested.
- DNS (Sec)– DNS resolution time is the time required to resolve the host name.
- SSL (Sec)– This is the time required for SSL negotiation.
- Cache Lookup– It is the time taken by the browser to look up the main URL in the browser cache.
- Download (Sec)– Total time taken in downloading the main URL response.
- TCP (Sec)– This is the time required for a TCP handshake. It does not include SSL/TLS negotiation.
- FCP (Sec)– First Content Paint Timestamp reporting the time when any content is painted i.e. something defined in the DOM.
- FP (Sec)– First Paint timestamp reports when the browser started to render the page after navigation.
- TTI (Sec)– Time to Interactive is when the website is visually usable and engaging.
- FID (Sec)– First Input Delay (FID) measures the time from when a user first interacts with your site to the time when the browser is actually able to respond to that interaction.
- Exit PCT– It defines the number of users (percentage) exited from a session.
Connection
It denotes the type of connection used, such as cable, dial-up, DSL, and so on.
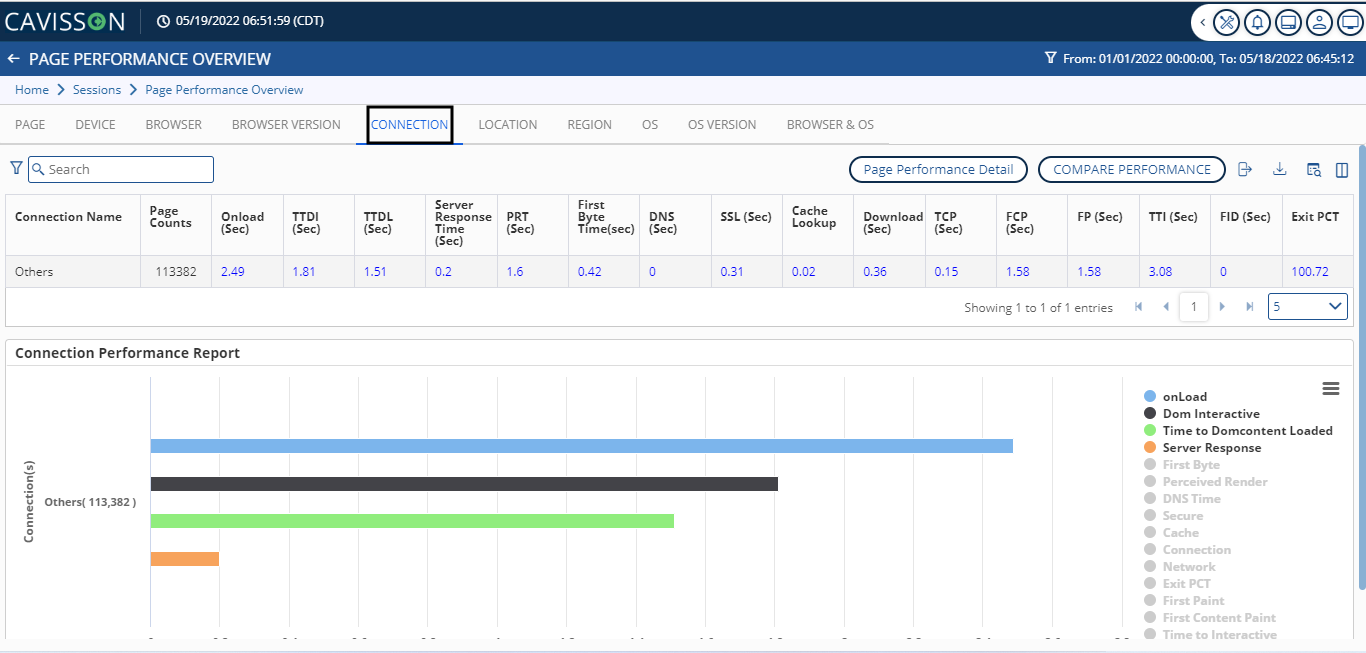
In the connection tab, we can see the following options as shown in Figure 17:
- Connection Name– Types of connection used such as cable, dial-up, DSL, and so on.
- Page Counts – This denotes the number of pages accessed in the session.
- Onload (Sec) – Onload time occurs when the processing of the page is complete and all the resources on the page have finished downloading.
- TTDI (Sec) – Dom interactive time is the point at which the browser has finished loading and parsing HTML, and the DOM (Document Object Model) has been built.
- TTDL (Sec) – DOM Content loaded time is the point at which the DOM is ready and there are no stylesheets blocking the JavaScript.
- Server Response Time (Sec) – Server Response Time is the wait time of the main URL.
- PRT (Sec) – Perceived Render Time is the time when the viewpoint area of the client browser is visually complete.
- First Byte Time (Sec) – This is the total amount of time spent to receive the first byte response once it has been requested.
- DNS (Sec) – DNS resolution time is the time required to resolve the host name.
- SSL (Sec) – This is the time required for SSL negotiation.
- Cache Lookup – This is the time taken by the browser to look up the main URL in the browser cache.
- Download (Sec) – Total time taken in downloading the main URL response.
- TCP (Sec) – This is the time required for a TCP handshake. It does not include SSL/TLS negotiation.
- FCP (Sec) – First Content Paint Timestamp reporting the time when any content is painted i.e. something defined in the DOM.
- FP (Sec) – First Paint timestamp reports when the browser started to render the page after navigation.
- TTI (Sec) – Time to Interactive is when the website is visually usable and engaging.
- FID (Sec) – First Input Delay (FID) measures the time from when a user first interacts with your site to the time when the browser is actually able to respond to that interaction.
- Exit PCT- It defines the number of users (percentage) exited from a session.
Location
It displays the location from where the visitor is accessing the site.
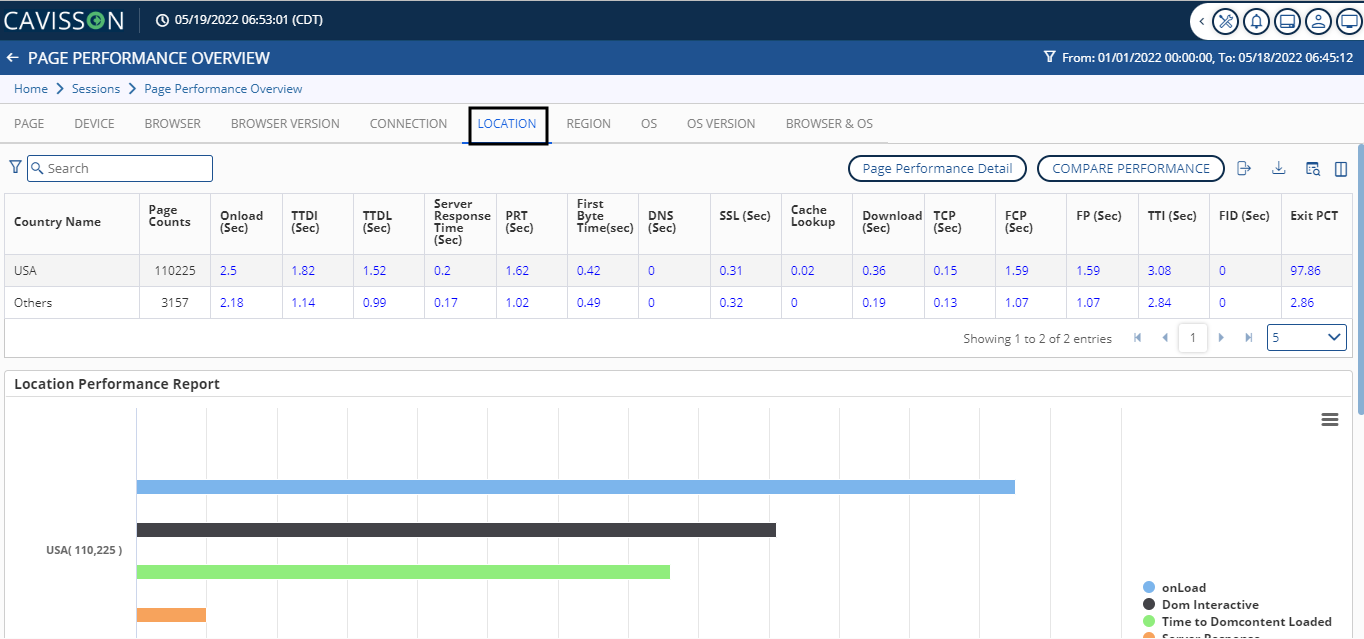
In the location tab, we can see the following options as shown in Figure 18:
- Country Name– It shows the country where the transaction is taking place.
- Page Counts– This denotes the number of pages accessed in the session.
- Onload (Sec) – Onload time occurs when the processing of the page is complete and all the resources on the page have finished downloading.
- TTDI (Sec)– Dom interactive time is the point at which the browser has finished loading and parsing HTML, and the DOM (Document Object Model) has been built.
- TTDL (Sec) – DOM Content loaded time is the point at which the DOM is ready and there are no stylesheets blocking the JavaScript.
- Server Response Time (Sec) – Server Response Time is the wait time of the main URL.
- PRT (Sec) – Perceived Render Time is the time when the viewpoint area of the client browser is visually complete.
- First Byte Time (Sec) – This is the total amount of time spent to receive the first byte response once it has been requested.
- DNS (Sec) – DNS resolution time is the time required to resolve the host name.
- SSL (Sec)– This is the time required for SSL negotiation.
- Cache Lookup – This is the time taken by the browser to look up the main URL in the browser cache.
- Download (Sec)– Total time taken in downloading the main URL response.
- TCP (Sec)– This is the time required for a TCP handshake. It does not include SSL/TLS negotiation.
- FCP (Sec)– First Content Paint Timestamp reporting the time when any content is painted i.e., something defined in the DOM.
- FP (Sec)– First Paint timestamp reports when the browser started to render the page after navigation.
- TTI (Sec)– Time to Interactive is when the website is visually usable and engaging.
- FID (Sec)– First Input Delay (FID) measures the time from when a user first interacts with your site to the time when the browser is actually able to respond to that interaction.
- Exit PCT– It defines the number of users (percentage) exited from a session.
Region
Region is a part of the location from where the visitor is accessing the site.
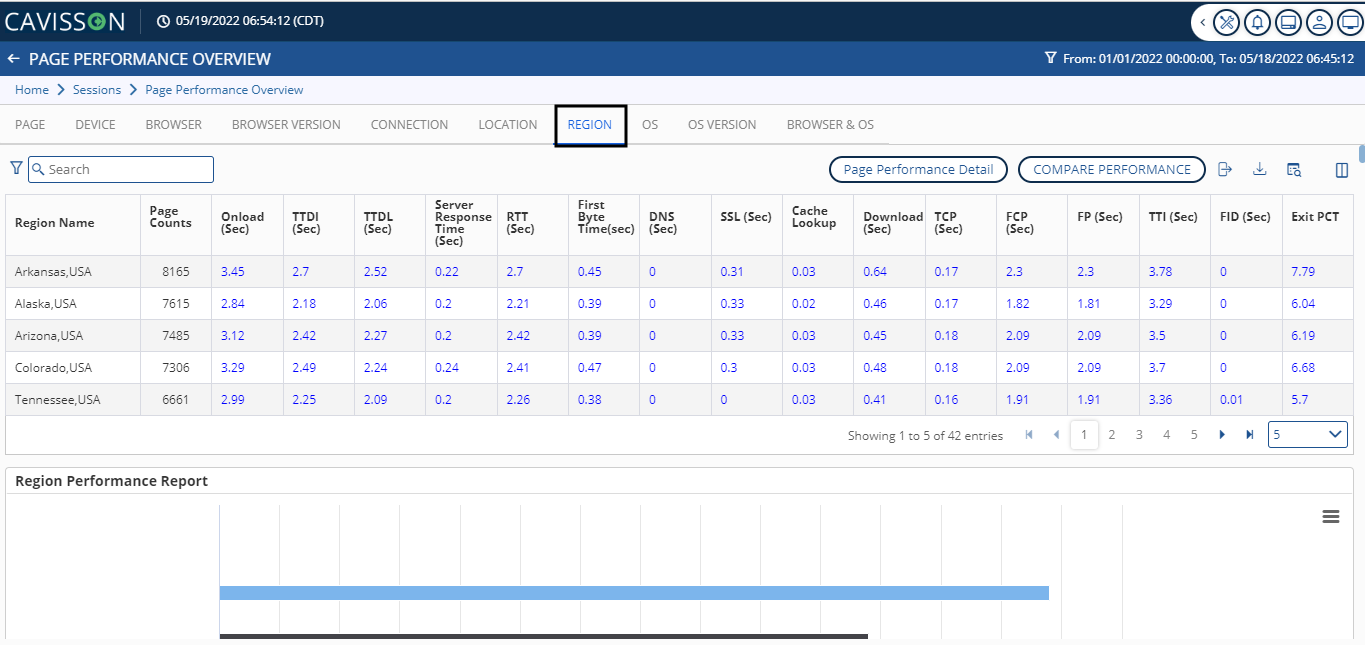
In the region tab, we can see the following options:
- Region Name– It is the area where the transaction takes place.
- Page Counts – This denotes the number of pages accessed in the session.
- Onload (Sec) – Onload time occurs when the processing of the page is complete and all the resources on the page have finished downloading.
- TTDI (Sec)– Dom interactive time is the point at which the browser has finished loading and parsing HTML, and the DOM (Document Object Model) has been built.
- TTDL (Sec)– DOM Content loaded time is the point at which the DOM is ready and there are no stylesheets blocking the JavaScript
- Server Response Time (Sec)- Server Response Time is the wait time of the main URL.
- RTT (Sec)– It is the round trip time.
- First Byte Time (Sec) – This is the total amount of time spent to receive the first byte response once it has been requested.
- DNS (Sec)– DNS resolution time is the time required to resolve the host name.
- SSL (Sec) – This is the time required for SSL negotiation.
- Cache Lookup– This is the time taken by the browser to look up the main URL in the browser cache.
- Download (Sec)– Total time taken in downloading the main URL response.
- TCP (Sec)– This is the time required for a TCP handshake. It does not include SSL/TLS negotiation.
- FCP (Sec)– First Content Paint Timestamp reporting the time when any content is painted i.e. something defined in the DOM.
- FP (Sec)- First Paint timestamp reports when the browser started to render the page after navigation.
- TTI (Sec)– Time to Interactive is when the website is visually usable and engaging.
- FID (Sec)– First Input Delay (FID) measures the time from when a user first interacts with your site to the time when the browser is actually able to respond to that interaction.
- Exit PCT – It defines the number of users (percentage) exited from a session.
OS
This denotes the platform from where the session is executed.
tus nec ullamcorper mattis, pulvinar dapibus leo.
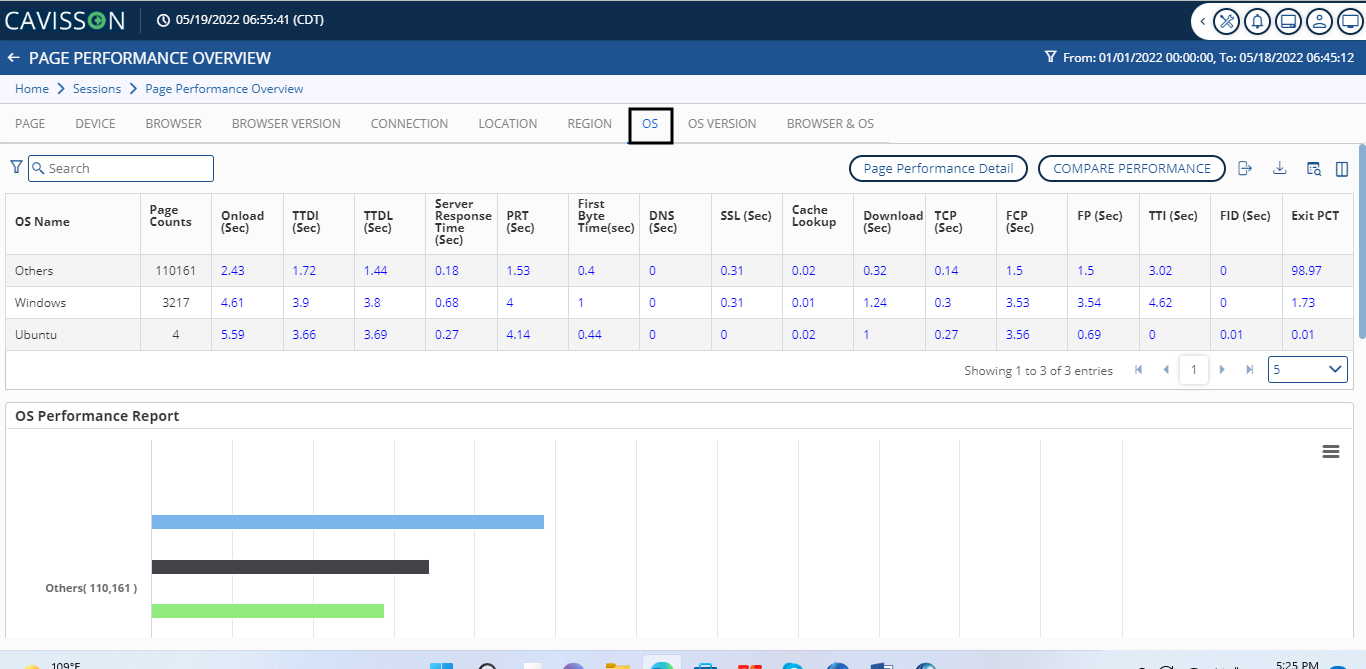
In the OS tab, we can see the following options as shown in Figure 20 :
- OS Name-Denotes the platform from where the session is executed. For e.g.- Windows, Linux, etc.
- Page Counts– This denotes the number of pages accessed in the session.
- Onload (Sec)– Onload time occurs when the processing of the page is complete and all the resources on the page have finished downloading.
- TTDI (Sec)– Dom interactive time is the point at which the browser has finished loading and parsing HTML, and the DOM (Document Object Model) has been built.
- TTDL (Sec)– DOM Content loaded time is the point at which the DOM is ready and there are no stylesheets blocking the JavaScript.
- Server Response Time (Sec)– Server Response Time is the wait time of the main URL.
- PRT (Sec)– Perceived Render Time is the time when the viewpoint area of the client browser is visually complete.
- First Byte Time (Sec)– This is the total amount of time spent to receive the first byte response once it has been requested.
- DNS(Sec)– DNS resolution time is the time required to resolve the host name.
- SSL (Sec)– This is the time required for SSL negotiation.
- Cache Lookup– This is the time taken by the browser to look up the main URL in the browser cache.
- Download (Sec)– Total time taken in downloading the main URL response.
- TCP (Sec)– This is the time required for a TCP handshake. It does not include SSL/TLS negotiation.
- FCP (Sec)– First Content Paint Timestamp reporting the time when any content is painted i.e. something defined in the DOM.
- FP (Sec)– First Paint timestamp reports when the browser started to render the page after navigation.
- TTI (Sec)– Time to Interactive is when the website is visually usable and engaging.
- FID (Sec)– First Input Delay (FID) measures the time from when a user first interacts with your site to the time when the browser is actually able to respond to that interaction.
- Exit PCT– It defines the number of users (percentage) exited from a session.
OS (versions)
It denoted the version of the operating system from where the session is executed. For e.g.- Window XP, Window 10, etc.
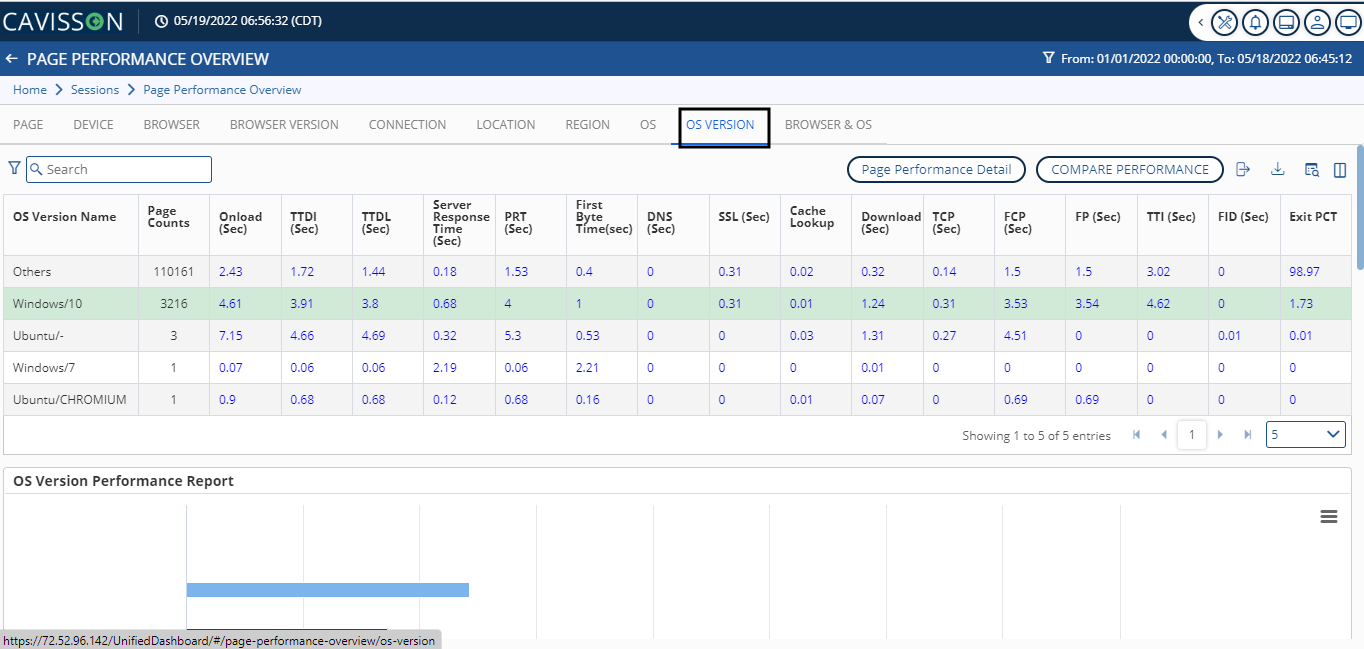
In the OS Version tab, we can see the following options as in Figure 21:
- OS Version Name- It denoted the version of the operating system from where the session is executed.
- Page Counts– This denotes the number of pages accessed in the session.
- Onload (Sec)– Onload time occurs when the processing of the page is complete and all the resources on the page have finished downloading.
- TTDI (Sec)– Dom interactive time is the point at which the browser has finished loading and parsing HTML, and the DOM (Document Object Model) has been built.
- TTDL (Sec)– DOM Content loaded time is the point at which the DOM is ready and there are no stylesheets blocking the JavaScript.
- Server Response Time (Sec)– Server Response Time is the wait time of the main URL.
- PRT (Sec)– Perceived Render Time is the time when the viewpoint area of the client browser is visually complete.
- First Byte Time (Sec)– This is the total amount of time spent to receive the first byte response once it has been requested.
- DNS (Sec)– DNS resolution time is the time required to resolve the host name.
- SSL (Sec)– This is the time required for SSL negotiation.
- Cache Lookup– This is the time taken by the browser to look up the main URL in the browser cache.
- Download (Sec)– Total time taken in downloading the main URL response.
- TCP (Sec)– This is the time required for a TCP handshake. It does not include SSL/TLS negotiation.
- FCP (Sec)– First Content Paint Timestamp reporting the time when any content is painted i.e. something defined in the DOM.
- FP (Sec)– First Paint timestamp reports when the browser started to render the page after navigation.
- TTI (Sec)– Time to Interactive is when the website is visually usable and engaging.
- FID (Sec)– First Input Delay (FID) measures the time from when a user first interacts with your site.
- Exit PCT– It defines the number of users (percentage) exited from a session.
Browser & OS
It denotes the browser and the operating system from where the user is operating.
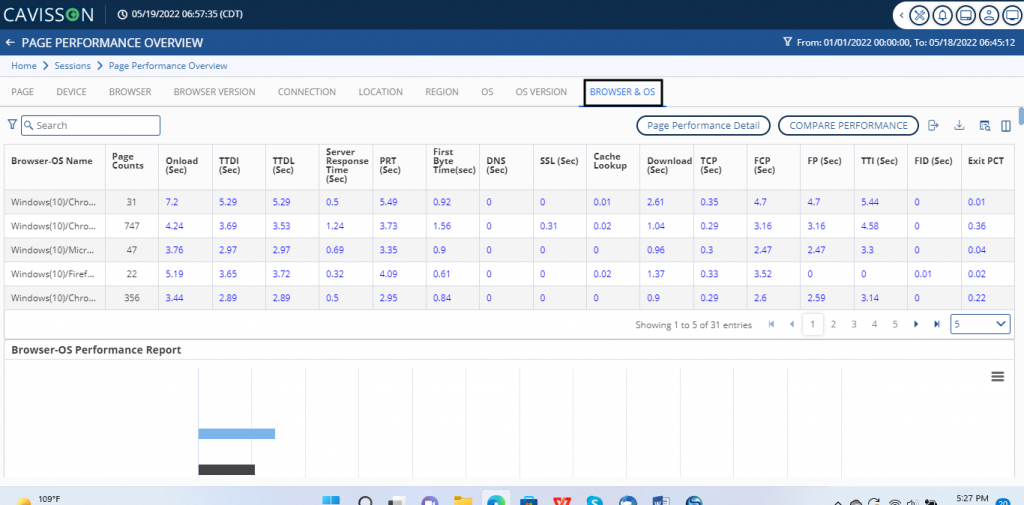
In the Browser & OS tab, we can see the following options as in Figure 22:
- Browser-OS Name- It denotes the browser and the operating system from where the user is operating
- Page Counts– This denotes the number of pages accessed in the session.
- Onload (Sec)– Onload time occurs when the processing of the page is complete and all the resources on the page have finished downloading.
- TTDI (Sec)– Dom interactive time is the point at which the browser has finished loading and parsing HTML, and the DOM (Document Object Model) has been built.
- TTDL (Sec)– DOM Content loaded time is the point at which the DOM is ready and there are no stylesheets blocking the JavaScript
- Server Response Time (Sec)– Server Response Time is the wait time of the main URL.
- PRT (Sec)– Perceived Render Time is the time when the viewpoint area of the client browser is visually complete.
- First Byte Time (Sec)– This is the total amount of time spent to receive the first byte response once it has been requested.
- DNS (Sec)– DNS resolution time is the time required to resolve the host name.
- SSL (Sec)– This is the time required for SSL negotiation.
- Cache Lookup– This is the time taken by the browser to look up the main URL in the browser cache.
- Download (Sec)– Total time taken in downloading the main URL response.
- TCP (Sec)– This is the time required for a TCP handshake. It does not include SSL/TLS negotiation.
- FCP (Sec)– First Content Paint Timestamp reporting the time when any content is painted i.e. something defined in the DOM.
- FP (Sec)– First Paint timestamp reports when the browser started to render the page after navigation.
- TTI (Sec)– Time to Interactive is when the website is visually usable and engaging.
- FID (Sec)– First Input Delay (FID) measures the time from when a user first interacts with your site.
- Exit PCT– It defines the number of users (percentage) exited from a session.
Export as an XLS File
You can download the tabular view of the information in Excel file format by clicking the Export as XLS![]() icon.
icon.
Export Table as CSV
You can download the tabular view of the information in CSV format by clicking the Export Table as CSV![]() icon.
icon.
Print/Download Graphical View
You can print the graphical view format of the information and can download it in various formats, such as PNG, JPEG, PDF, or SVG vector images.
Page Performance Report
The Page Performance Report displays a page scatter map with various attributes and filters. You can select parameters, such as onload, TTDL, TTDI, DOM time, and so on. Based on the selection, you can also specify the maximum time and bucket size. To view the details of any instance, hover your mouse over it. A pop-up is displayed with details.
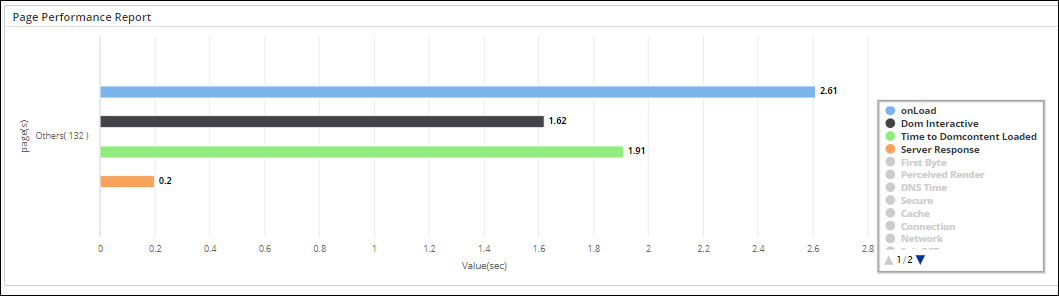
The Page Performance Report displays the following information related to the page being accessed as shown in Figure 23:
- OnLoad: Onload time is the total time consumed in the processing of a page and loading all the resources (images, CSS, etc.). This is the same time when DOM complete occurs and the JavaScript window onload event fires.
- DOM interactive: It is the point at which the browser has finished loading and parsing HTML, and the DOM (Document Object Model) has been built. The DOM is how the browser internally structures the HTML so that it can render it.
- Time to DOM Content Loaded: DOM content loaded time (DOM loaded or DOM ready for short) is the point at which the DOM is ready (i.e. DOM interactive) and there are no stylesheets blocking JavaScript execution. If there are no stylesheets blocking JavaScript execution and there is no parser blocking JavaScript, then this is the same as DOM interactive time.
- Server Response: Server response time is the wait time of the main URL. It is the time from the main URL request (last non-redirect) starts to the time when the first byte of the response is received.
- First Byte: Time to First Byte (TTFB) is the total amount of time spent to receive the first byte of the response once it has been requested. It is the sum of “Redirect duration”, “Connection duration”, and “Backend duration”. This metric is one of the key indicators of web performance.
- Unload: Time spent in unloading the previous document (if any).
- DOM Time: DOM time is the total time spent in processing DOM and rendering the page. It is the time from the main URL (last non-redirect) response received by the window onload event.
- Redirect: It is the time taken by the browser to fetch all redirect URLs, if there is any redirection in fetching the main URL.
- Cache LookUp: It is the time taken by the browser to look up the main URL in the browser cache.
- DNS: It is the average time required to resolve a hostname.
- TCP: It is the average time required for a TCP handshake. It does not include SSL/TLS negotiation.
- SSL: Time required for SSL/TLS negotiation.
- Main URL Wait time: Server response time is the wait time of the main URL. It is the time from the main URL request (last non-redirect) start to the time when the first byte of the response is received.
- Main URL Download time: Total time taken in downloading the main URL (last non-redirect) response.
Download Report
You can download the Page Performance Report in various formats including PNF, JPEG, PDF, or SVG vector image. To download the report:
- Click the Menu icon . The various download options are displayed, as shown in Figure 24 :
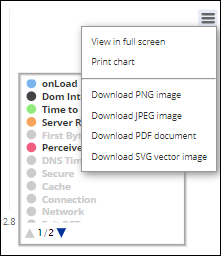
2. Select the required format for downloading the report.
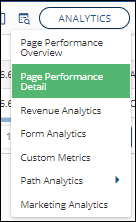
Page Performance Details
Using the Page Performance Detail analytics, you can analyze the page performance across multiple metrics. You can drill to any session causing a spike in the dashboard from a single page. Also, you can find the root cause for that spike using page performance details as it enables us to view all the details of the sessions.
To view the page performance details:
- Select the Page Performance Details option from the Analytics menu as shown in Figure 25.
2. The Page Performance Details window is displayed, as shown in the Figure 26:
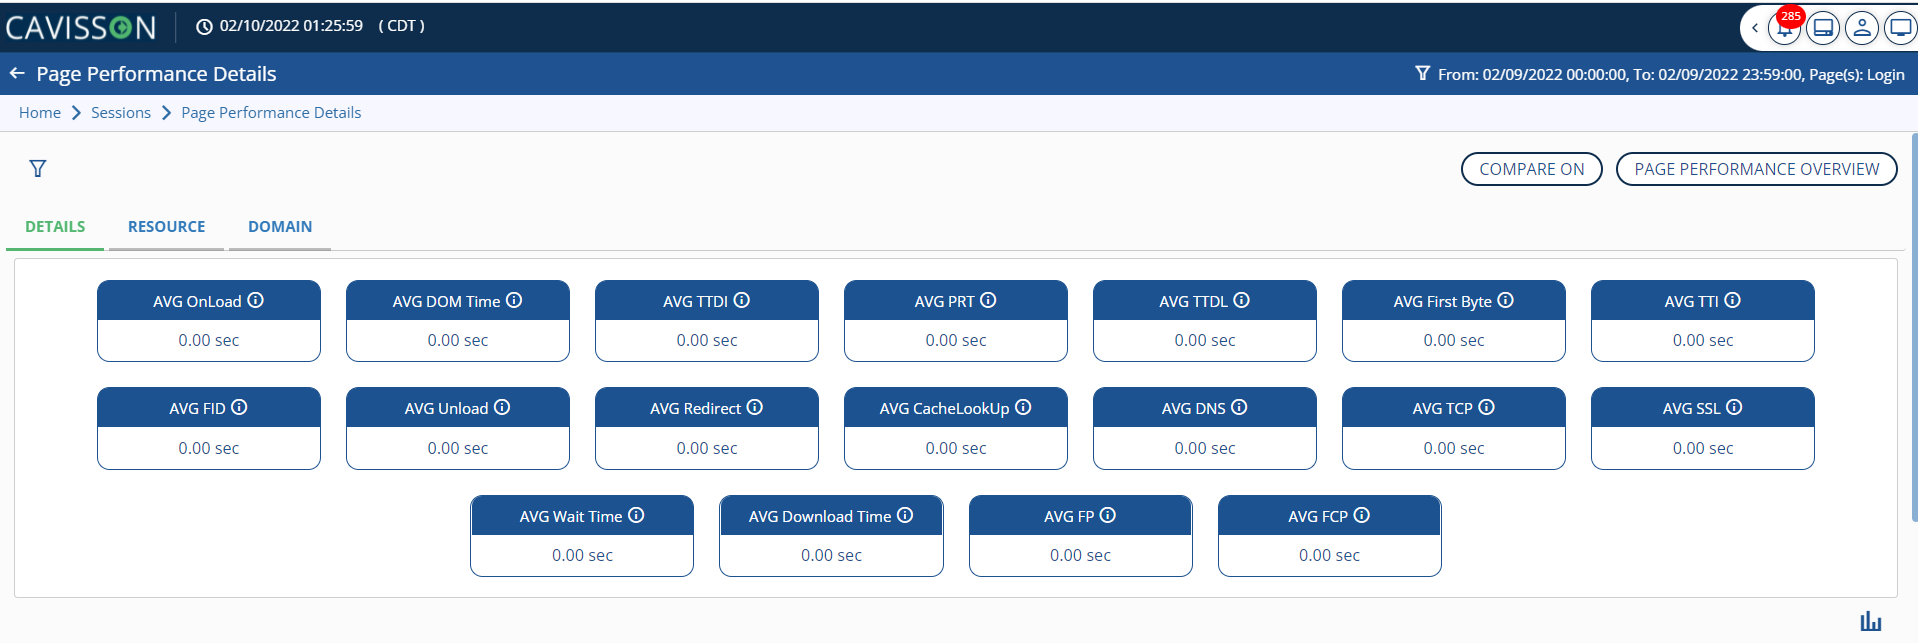

It provides the following page details including average onload and unload time, cache lookup, download time, and TTDL details:
- Avg Onload: Onload time is the total time consumed in the processing of a page and loading all the resources (images, CSS, etc.). This is the same time when DOM complete occurs and the JavaScript window.onload event fires.
- Avg DOM Time: DOM time is the total time spent in processing DOM and rendering the page. It is the time from the main URL (last non-redirect) response received to the window onload event.
- Avg TTDI: DOM interactive time is the point at which the browser has finished loading and parsing HTML, and the DOM (Document Object Model) has been built. The DOM is how the browser internally structures the HTML so that it can render it.
- Avg TTDL: DOM content loaded time (DOM loaded or DOM ready for short) is the point at which the DOM is ready (i.e. DOM interactive) and there are no stylesheets blocking JavaScript execution. If there are no stylesheets blocking JavaScript execution and there is no parser blocking JavaScript, then this is the same as DOM interactive time.
- Avg First Byte: Time to First Byte (TTFB) is the total amount of time spent to receive the first byte of the response once it has been requested. It is the sum of “Redirect duration”, “Connection duration”, and “Backend duration”. This metric is one of the key indicators of web performance.
- Avg Unload: Time spent in unloading the previous document (if any).
- Avg Redirect: It is the time taken by the browser to fetch all redirect URLs, if there is any redirection in fetching the main URL.
- Avg Cache LookUp: This is the average amount of time taken by the browser for finding the main url in the cache
- Avg DNS: It is the average time required to resolve a hostname.
- Avg TCP: It is the average time required for a TCP handshake. It does not include SSL/TLS negotiation.
- Avg SSL: Time required for SSL/TLS negotiation.
- Main URL Wait time: Server response time is the wait time of the main URL. It is the time from the main URL request (last non-redirect) start to the time when first byte of the response is received.
- Main URL Download time: Total time taken in downloading the main URL (last non-redirect) response.
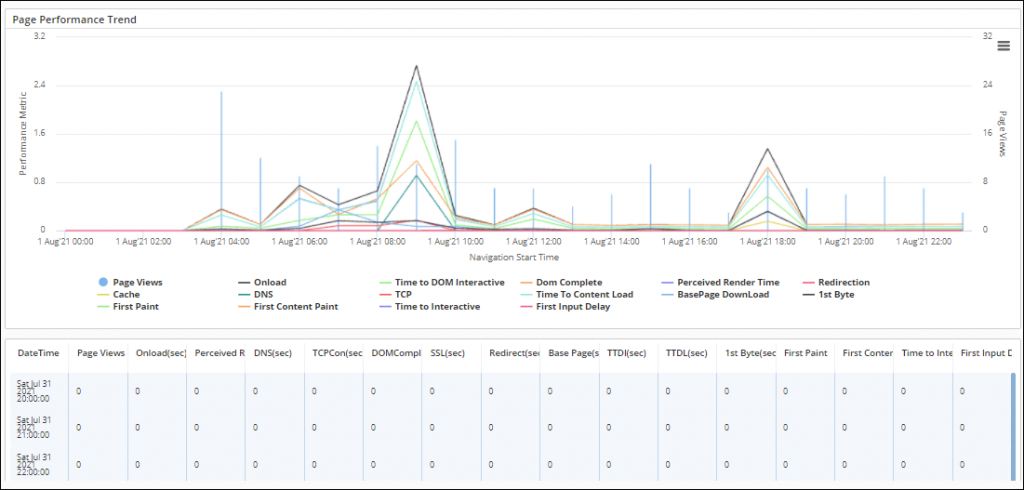
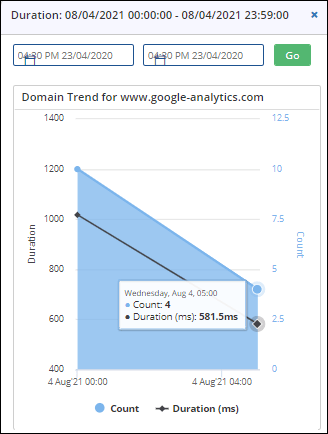
Page Performance Trend
You can also visualize the Page Performance Trend by analyzing the page details in tabular and graphical form with all the performance parameters. You can find the highlighted peak on the graph. Hover on the line to view the overall details at that particular time as shown in Figure 28.
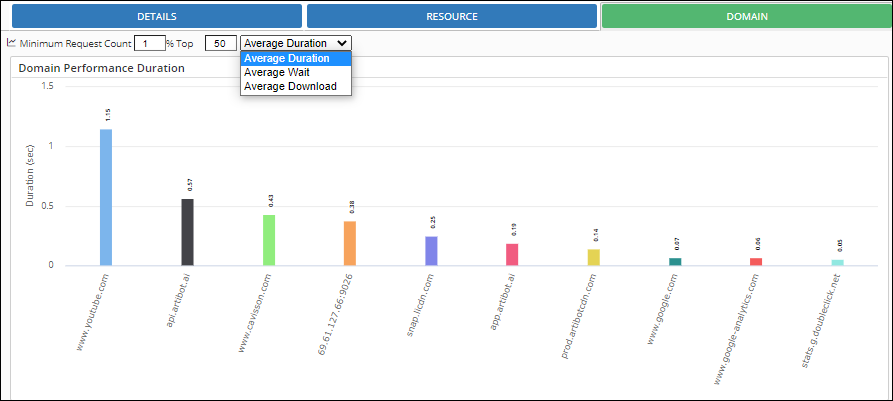
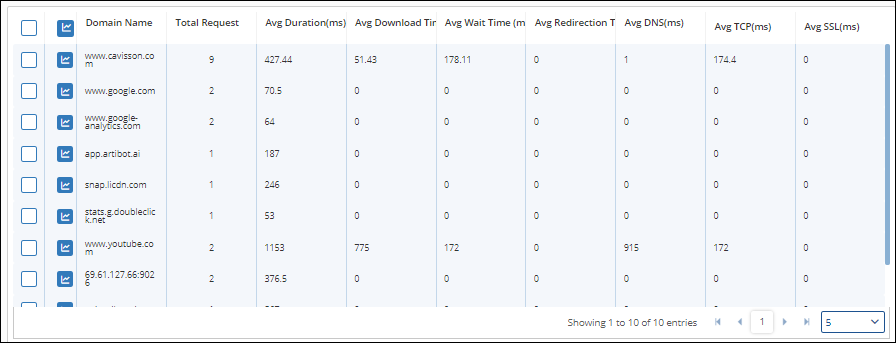
Domain Trend
Click the Domain tab to view the domain timing over time in the Page Performance Details window. You can apply time filters and download this chart too.
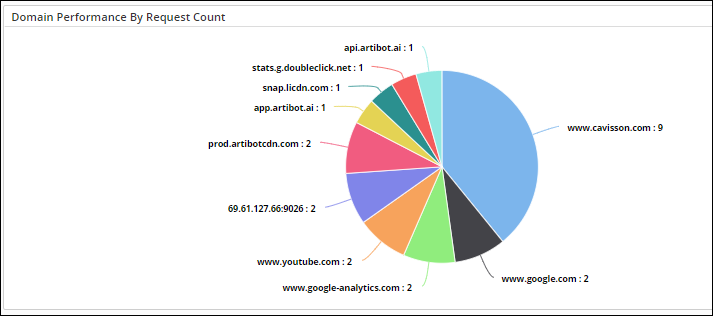
Domains by Duration
This displays all the domains with their duration. You can identify which domain is taking the maximum time. Select the Average Duration option from the drop-down list as shown in Figure 29:
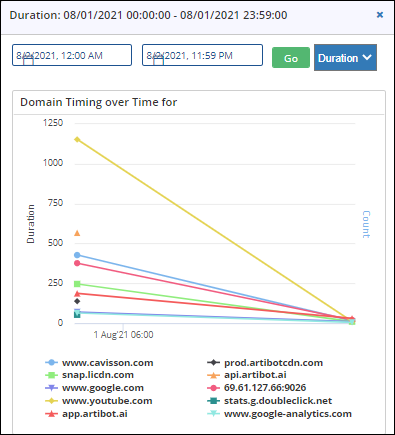
Clicking the ![]() icon displays the Duration graph window as shown in Figure 30:
icon displays the Duration graph window as shown in Figure 30:
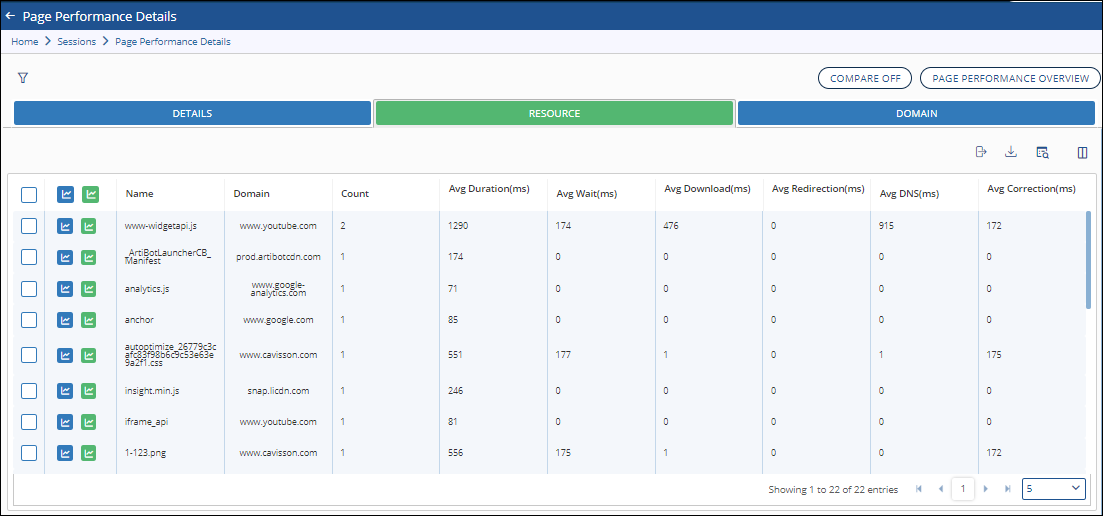
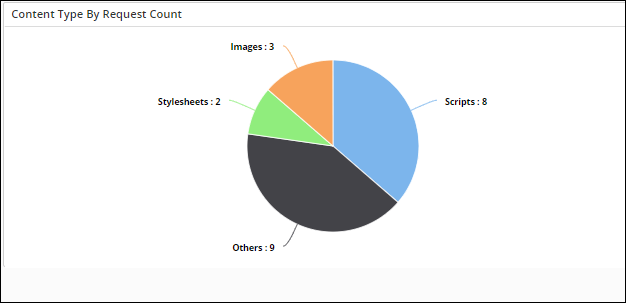
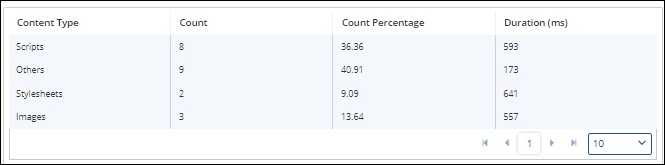
Resource Performance
The Resource performance table is displayed that provides an aggregate view of the resource timing across all domains. This helps in identifying the page bottlenecks. Few examples of Resource performance are Image File (.png), Java Script file (.js) etc. Click the Resource tab in the Page Performance Details window to analyze an aggregate view of the resource timing across all domains as shown in Figure 33.
You can also analyze the domain trend in the graphical format by clicking the![]() icon, highlighted in the following Figure 34 :
icon, highlighted in the following Figure 34 :
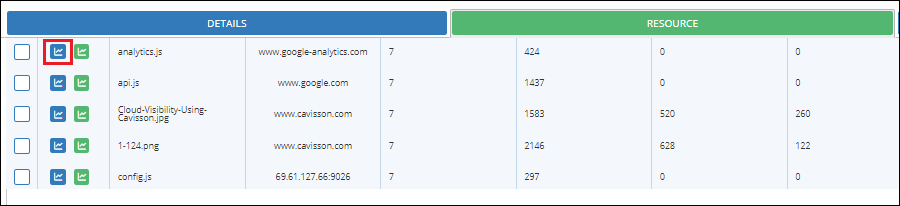
Here, you can see the highest duration for this particular resource (/tag) due to which the corresponding domain took a long time to respond to the user. This data will help you to analyze the resource trend to identify the reasons for the high duration time for a particular domain. To view the details of any instance, hover your mouse over it. A pop-up is displayed as shown in Figure 35 :
Analytics Reports
The Analytics options enable you to analyze page performance reports based on various parameters, such as channels, user segments, device type, location, and so on.
- Revenue Analytics
- Form Analytics
- Custom Metrics
- Path Analytics
- Marketing Analytics
Revenue Analytics
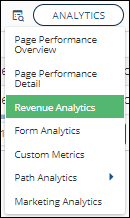
To access the Revenue Analytics section, go to Analytics > Revenue Analytics.
Select the Revenue Analytics option from the Analytics menu as shown in Figure 38.
The Revenue Analytics window is displayed, as shown below in Figure 39:
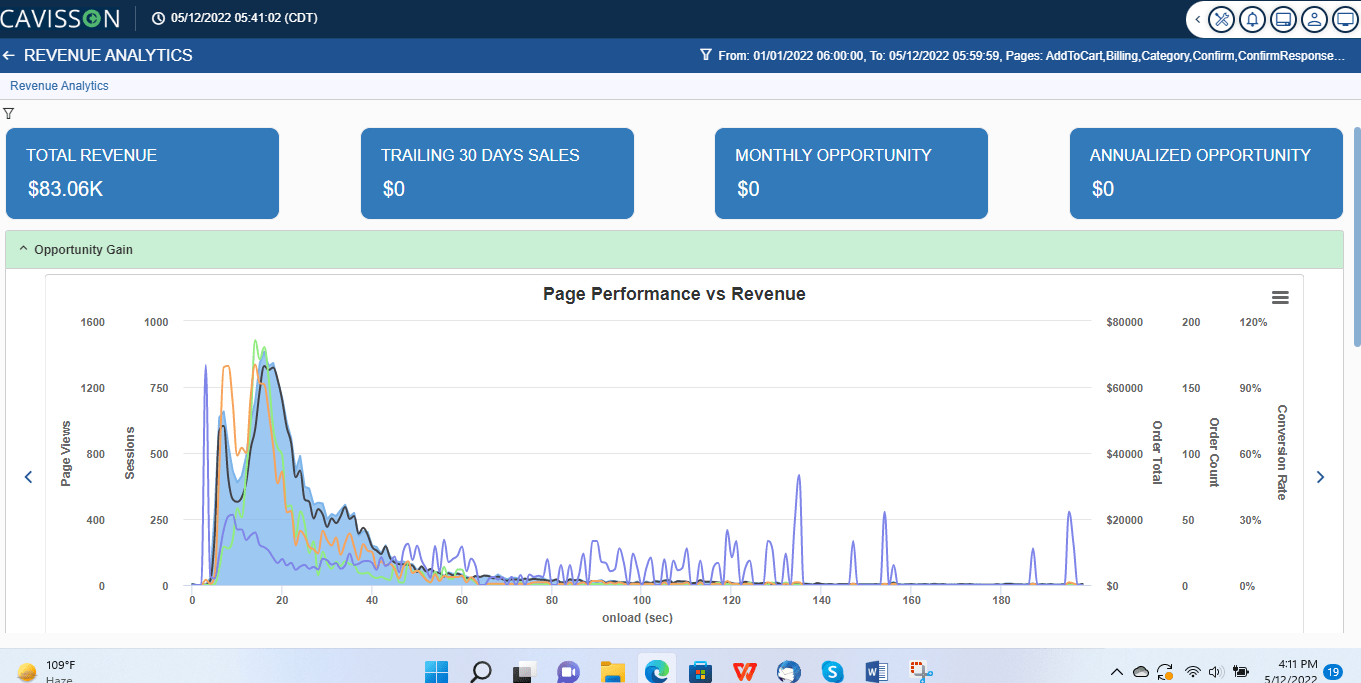
The Revenue Analytics window displays Page Performance Vs Revenue that contains Page views /sessions/Order total/order count/Conversion Rate Vs Onload time.
Estimate the Event Impact on Revenues
You can also analyze the impact of an event on the revenues by using the Impact of Event option. This option displays the Event Impact Card window that enables you to perform the impact analysis of events by providing information such as the estimated revenue loss and conversion rate.
To estimate the impact of an event on the revenues:
- Click the
 icon in the Events The event options are displayed:
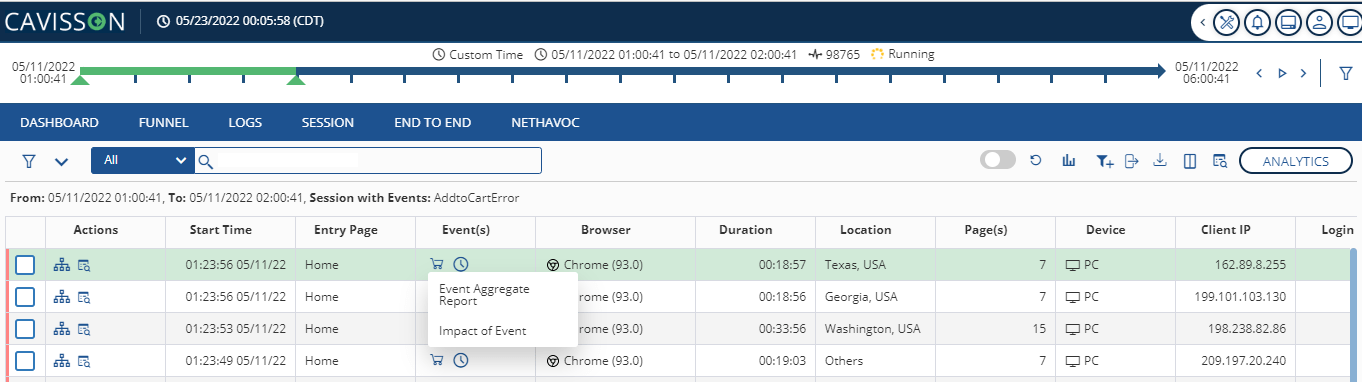
2. Select the Impact of Event The Event Impact Card window is displayed as shown in Figure 41.
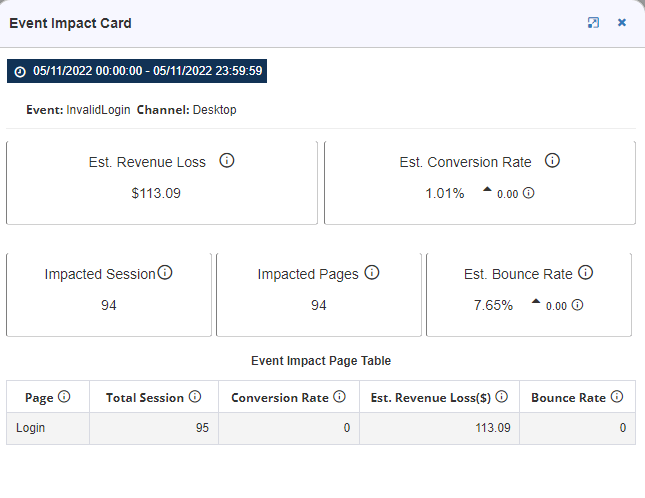
Click the Duration/time Filter icon ![]() to specify the time filter details.
to specify the time filter details.

3. Click Done in the Time Filter window. You can analyze the impact of the event on your revenues according to the selected time period.
Then, a navigation bar is activated that allows the user to increase/decrease the values in the bar. And accordingly, the projected values are getting changed which can quantify the revenue opportunities.
Below is an example of this feature. On increasing the bar, the projected values, such as conversion rate, completed users, and revenue are also increased with the same ratio and you can quantify the revenue opportunities.
Form Analytics
The Form Analytics window as shown in Figure 43 displays the form analytics report where you can see the total number of views on each page along with various stats on the form, such as form name, total form interactions, total successful submission, total failed submission, and conversion rate.
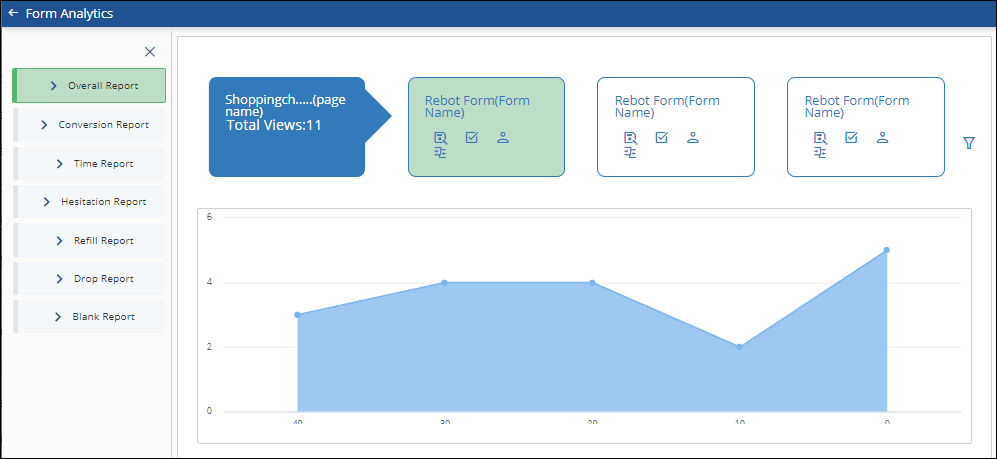
Clicking a form name, the form analytics report is displayed with the following details:
- Overall Report: This displays the overall summary of user actions on a form, such as the name of the form, number of successful submits, number of page views, number of interactions, number of submits, number of drop off from page, and from the field, and number of failed submits.
- Conversion Report: In Conversion Report, the user can review the step-by-step conversion analysis to see the user interaction with the form of the webpage.
- Time Report: This report explains the average time taken by a user to fill that field and the average duration to fill the form completely. This report contains two sections – a form summary and field wise report.
- Hesitation Report: It is similar to the Time report. Instead of fill time, it represents hesitation time for each field.
- Refill Report: This report explains how frequently a visitor refills form fields to resubmit the form. This report contains two sections – form summary and field wise report.
- Drop Report: This report explains from which field the user is abandoning the form and moving to the next page. It also contains two sections – form summary and field-wise report.
- Blank Report: This report explains how frequently a user is leaving a field blank. It is similar to a drop report. It contains two sections – form summary and field wise report.
Custom Metrics
This section displays information, such as page name, custom field name, and its value.
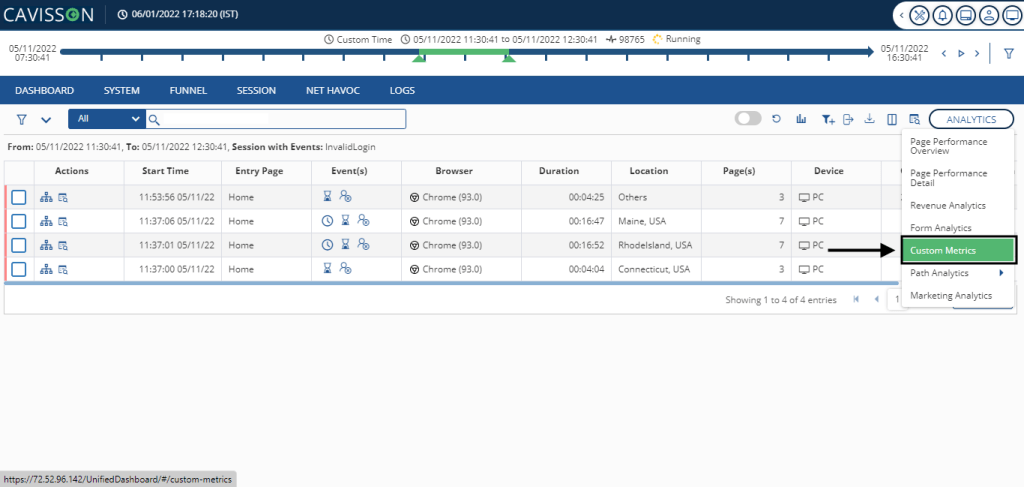
As shown in the Figure 44, select Custom Metrics from the drop down in Analytics.
After clocking we get the below figure of Custom Metric Filter.
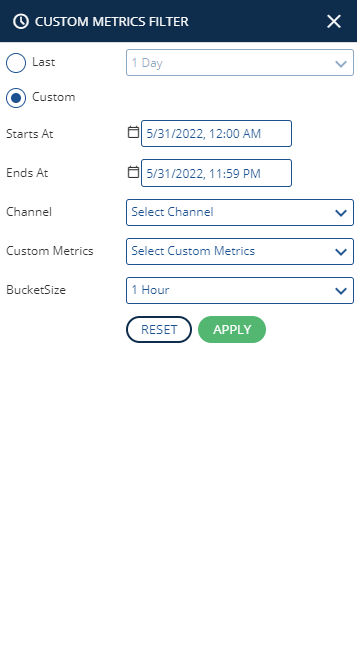
Following fields need to be filled for custom metrics:
- Last: Specify time filters, such as last duration (such as 15 minutes, 1 hour, 1 week, 1 day, 1 week, and so on)
- Custom: Specify the required Start and End date range.
- Select Channel: A channel is the medium through which a user can access the site. Select the Desktop option here.
- Bucket size: From the drop down select the bucket size. It can be 5 min, 15 min, 30 min, 1 hour. The default is 1 hour.
- Custom Metrics: Select the required custom metrics.
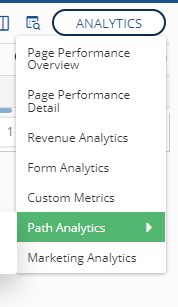
Path Analytics
Path analytics is the analysis of different user flows in a website. Each and every navigating path is a series of web pages that defines a visitor or a task.
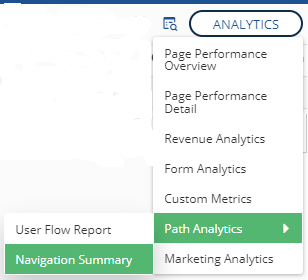
To access the path analytics, select Analytics> Path Analytics and then select the required option:
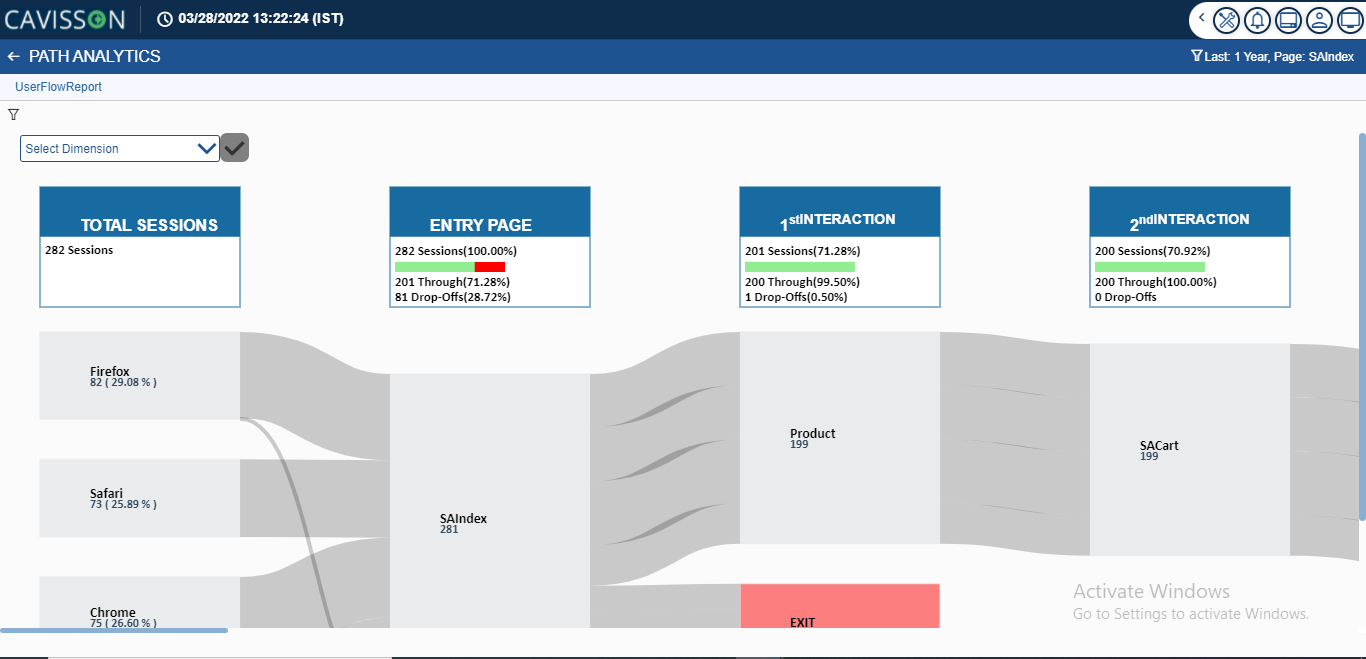
User Flow Report
The User Flow report is a nice refresh of the traditional click path report. Rather than looking at clicks from one page to another, visitors are moving between nodes. We can easily segment traffic through a site based on various dimensions of data. Connections in blue represent the number of visits that move between the nodes. Connections in red represent the drop off from a particular node. The user can visualize traffic on the website with different dimensions, such as OS, Browser, Location, Device type, and Referral. The capabilities of the view path are:
- Identify the most preferred flow and least preferred flow, also identify the most converted flow and least converted flow. Improve the exit rate from such flow and increase the conversion rate.
- Multilevel drilldown to understand the flow in more detail.
Click any Node for further drilldown. The path associated with that node is highlighted. In the above example, highlighted flow for Windows OS and Welcome page as entry page. View Flow Report – Filters. There are the following filters:
- Time
- Channel
- User Segment
- Dimension – OS, Browser, Location, Device Type, Referrer.
Navigation Summary
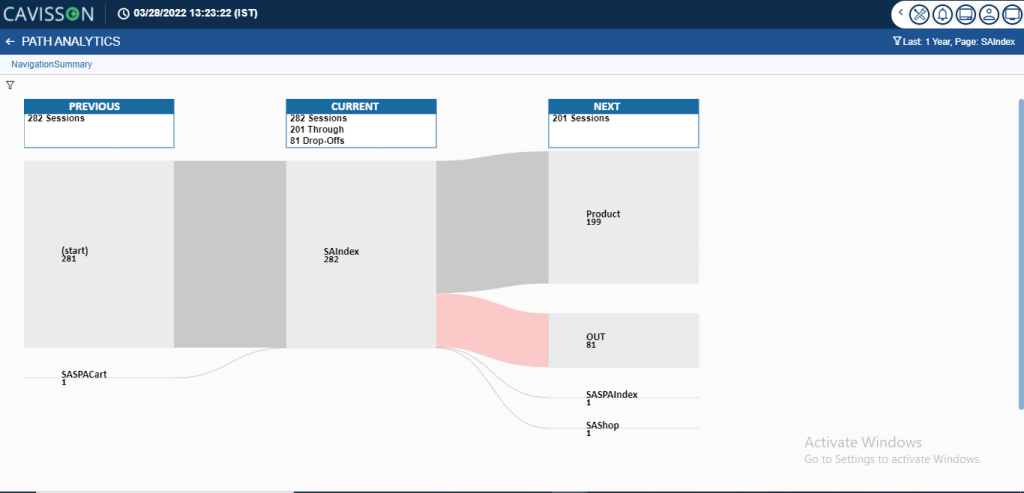
Navigation path analysis is all about analyzing different user flows in a website. Every navigation path is a series of web pages that define a visitor or task. It includes the steps that a user performs to complete the task, during a website visit or other UX process. The “top path” is the most common navigation path. It is the series of pages seen by your typical visitor. Click Analytics, then select Path Analytics and from the drop-down click on Navigation Summary.
Every site has these common or popular navigation paths. Path analysis can help understand the deviation in navigation from expected navigation to the actual navigation that’s happening within the website. This second path clearly shows that the user is facing some issues on the shipping page from where deviation from the expected popular path is happening resulting in zero conversion through this path. You might also discover something like an unusually high drop-off from a new page you’ve introduced, like a new home page or the new product page. Investigate whether the design of the new page might be obscuring the links or controls that lets traffic flow to the pages you want them to see next. In order to identify these navigation paths, related issues and further analyze them, path analytics reports can be used. Following are the reports which visualize in detail and provide information about each navigation path.
These components belong to Path Analytics, which helps in understanding the flow of users (traffic) on an application. Pages, which have a high exit rate, can be easily identified as well as it is easy to spot most taken paths or least taken paths.
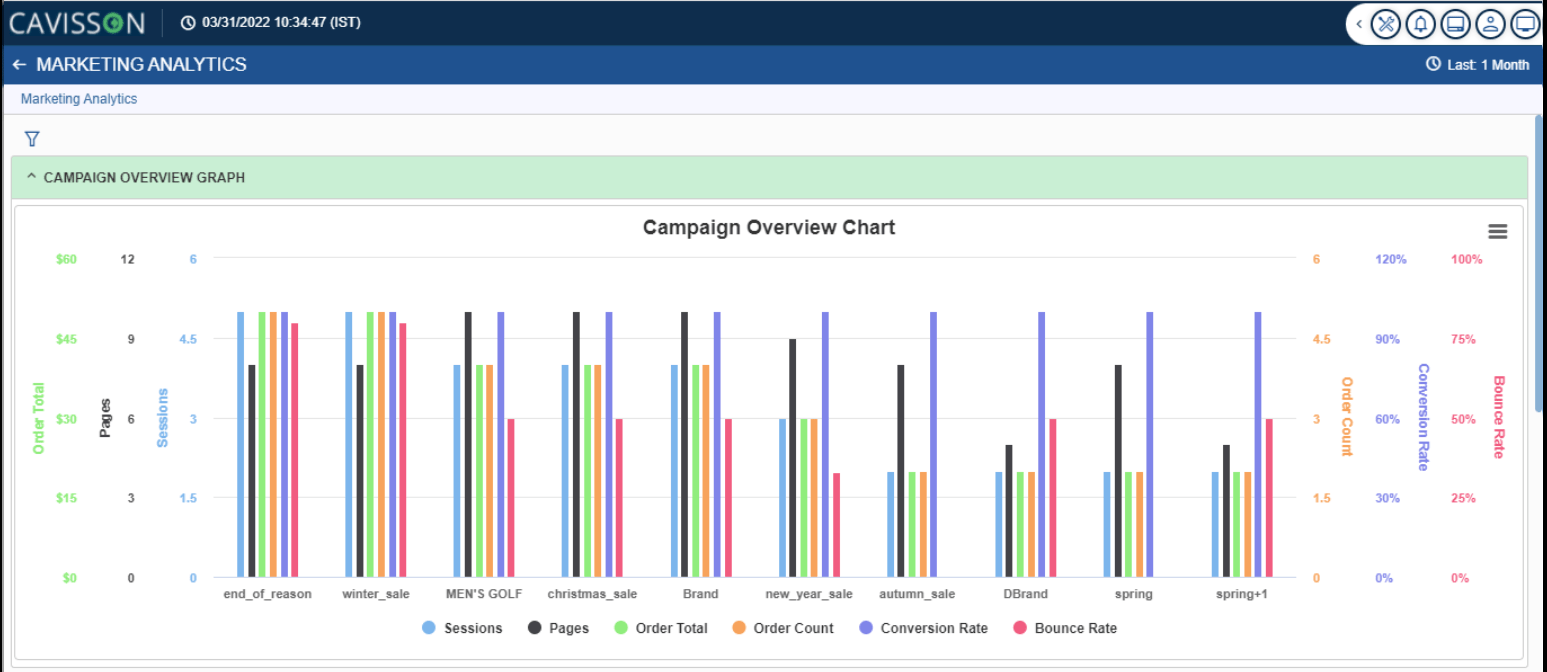
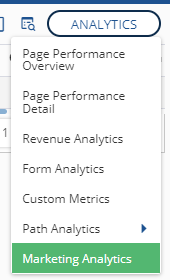
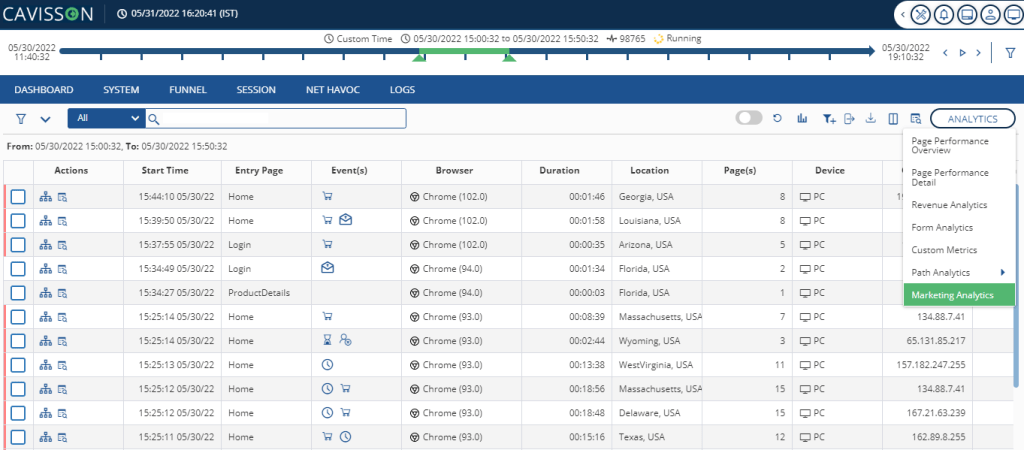
Marketing Analytics
In Marketing Analytics, campaign parameters are added to the destination URL with the help of which we can collect the information about the overall efficacy of those campaigns, and also understand where the campaigns are more effective. Click the Analytics icon, then select Marketing analytics from the drop-down as shown in Figure 50.
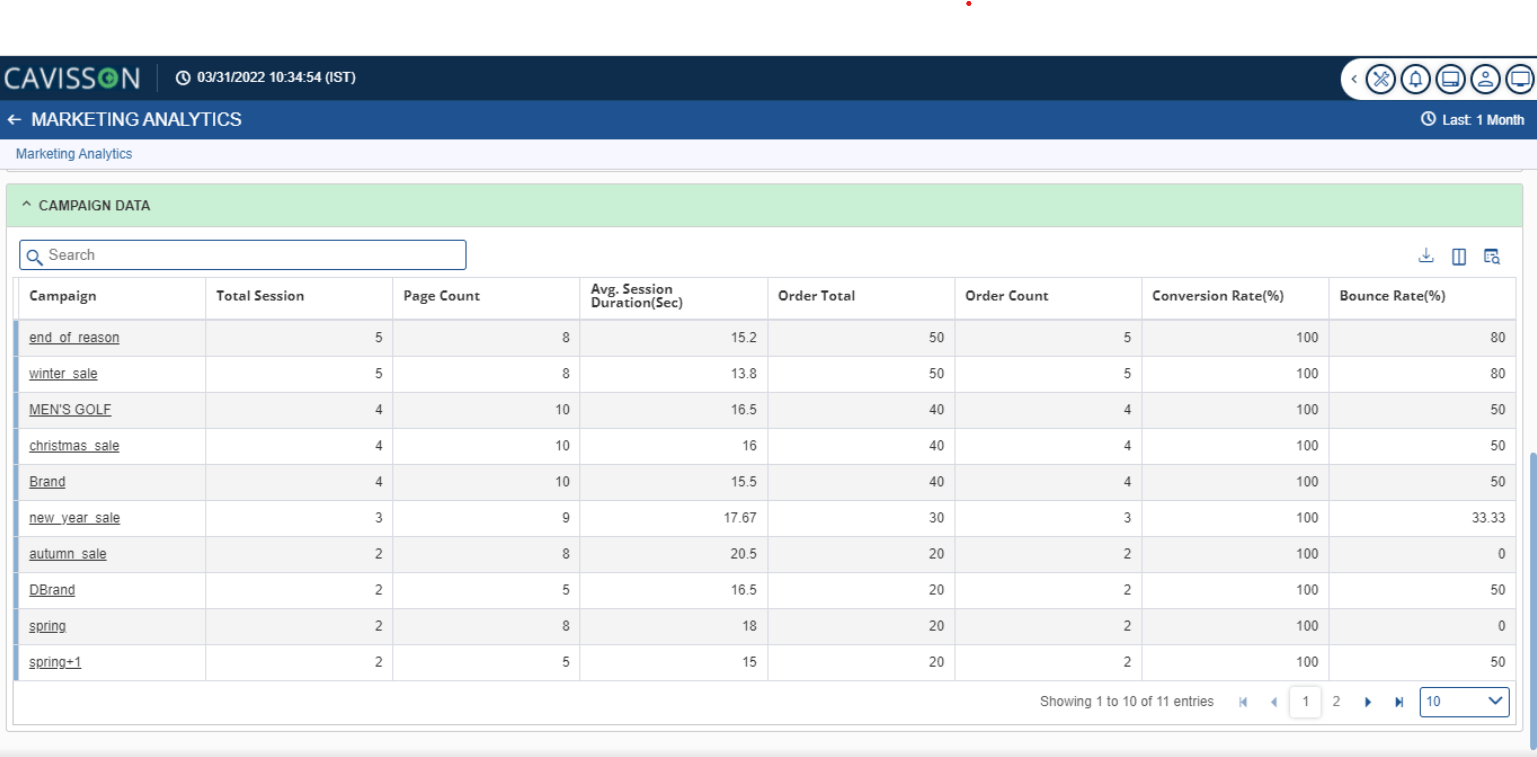
While the campaign list is clickable, clicking any particular campaign will redirect to the medium and source associated with it and depicts its all metrics: average session duration, page count, etc.