After you have successfully completed your test run, you can view various types of reports, such as Session Details, App profiling, and domain statistics report.
To view various reports:
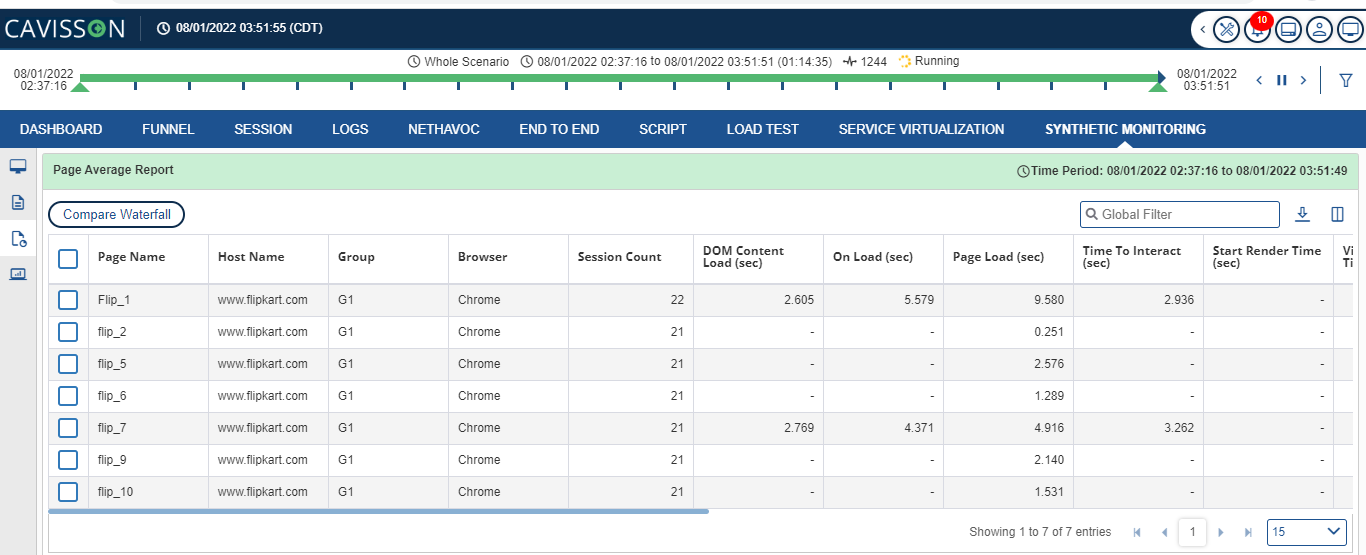
- Select User > My library >Reports > Ready > Page Average Report from the left panel. The Page Average Report is displayed:
- Click the Page Average Additional Information icon
 . You can see Page Average additional information Reports that provides addition information of the page, such as Min/Max/Average, Page Load time, and Start Render Time.
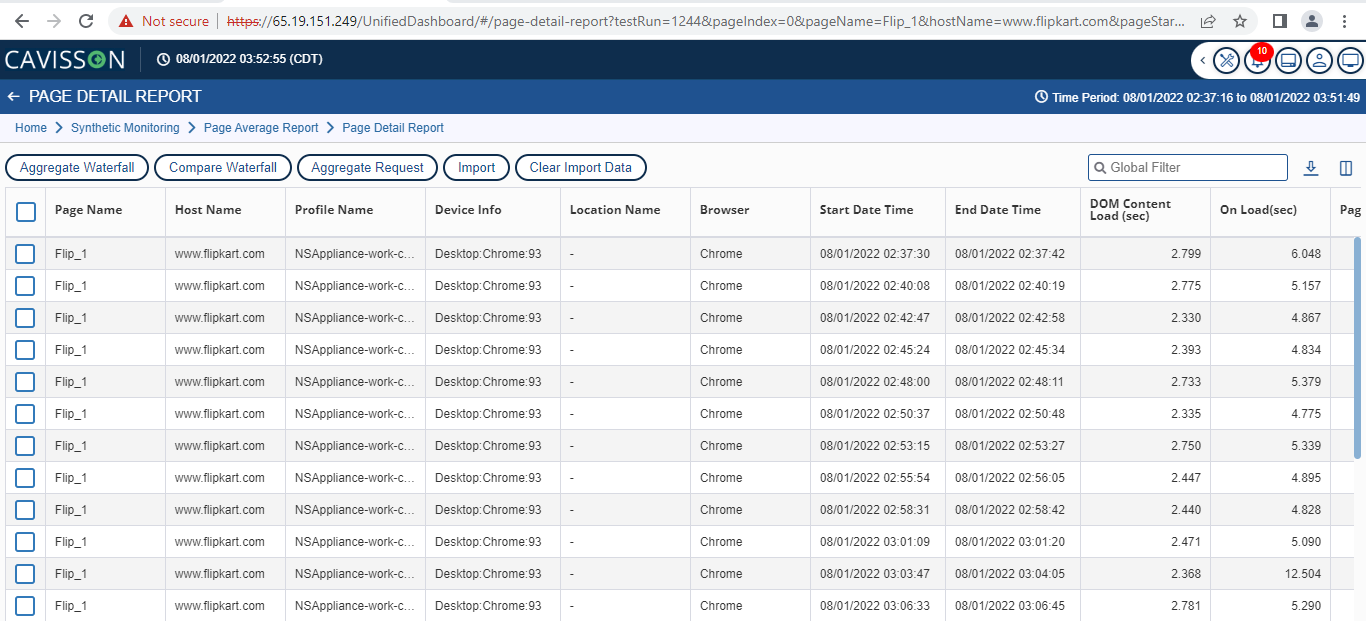
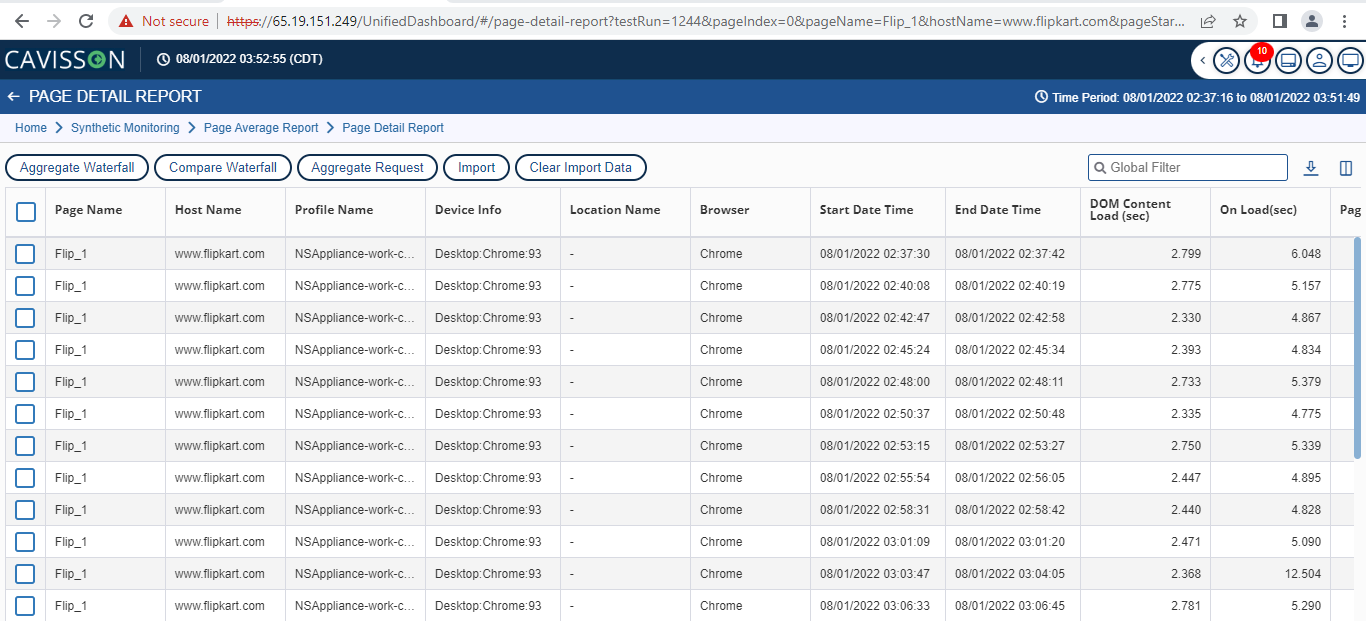
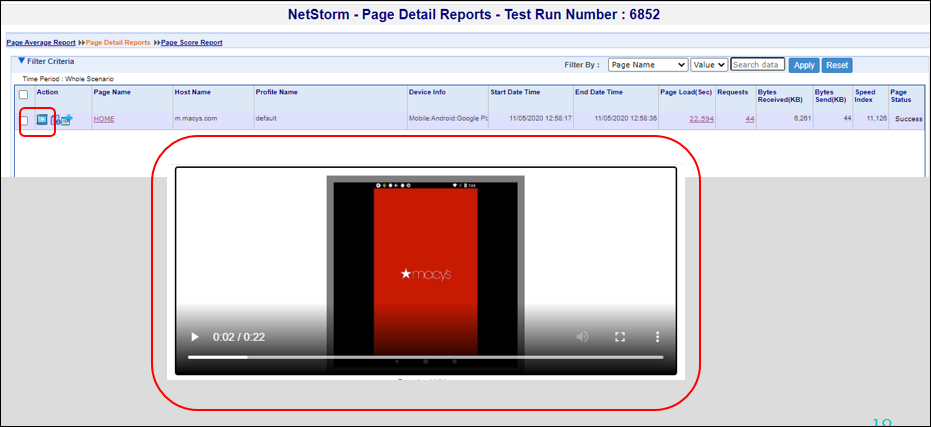
 - Click the required Page Name in the Page Average The Page Detail Reports for that page is displayed:
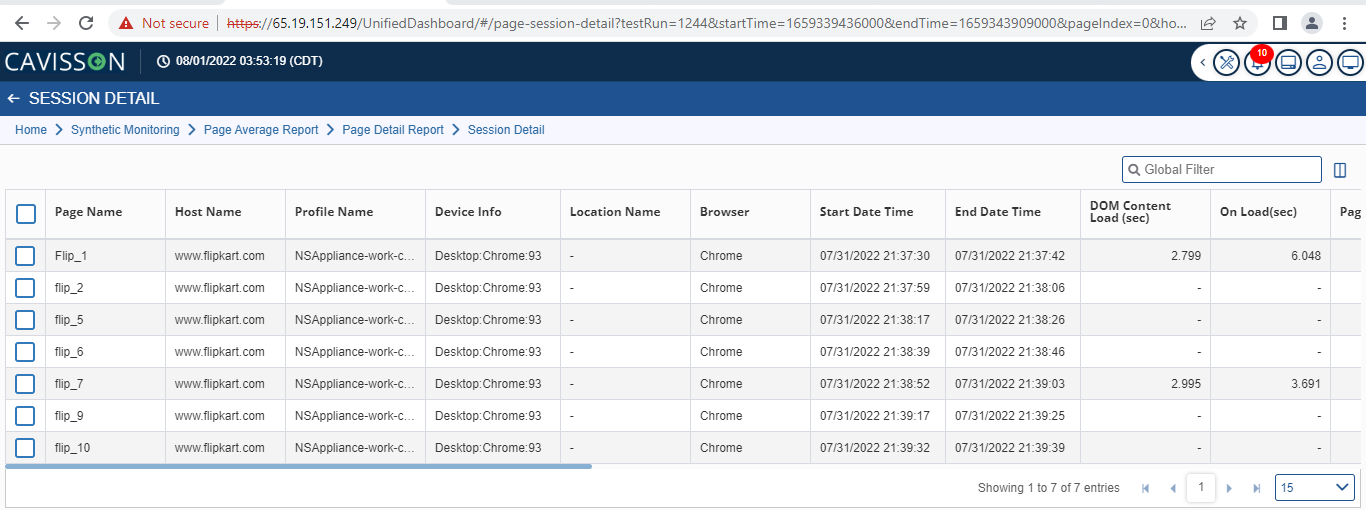
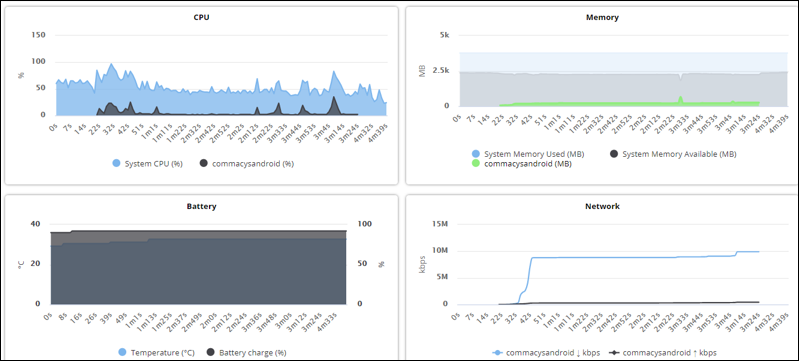
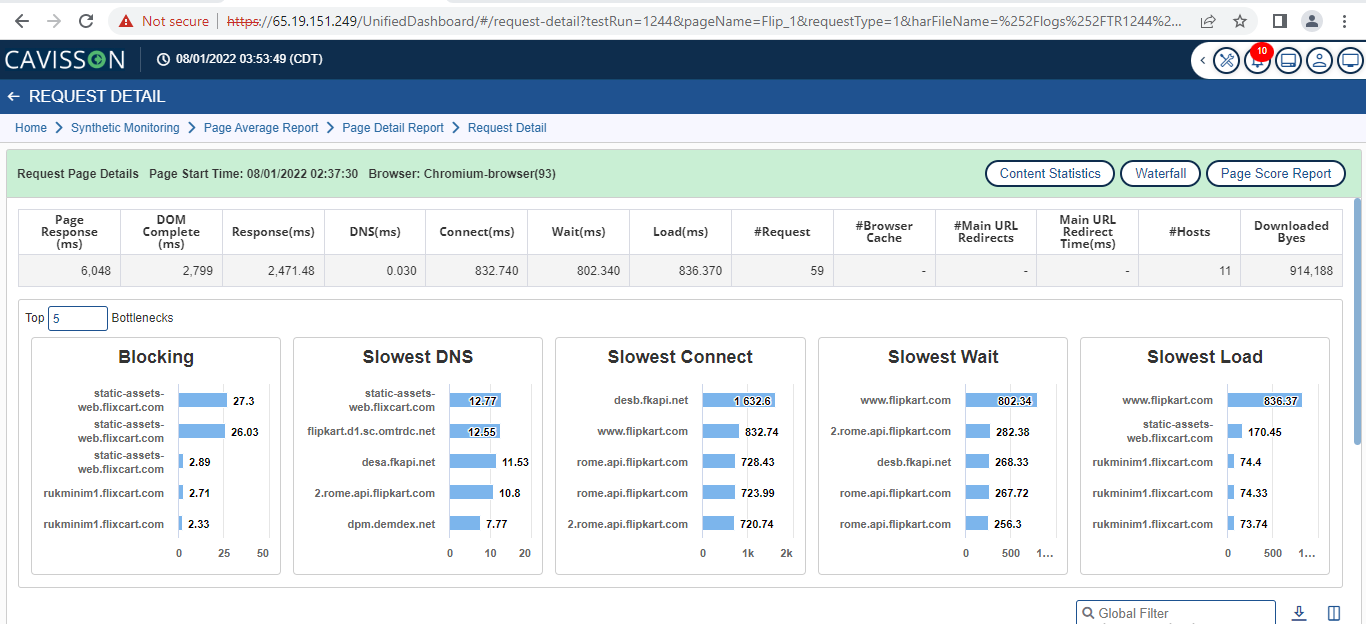
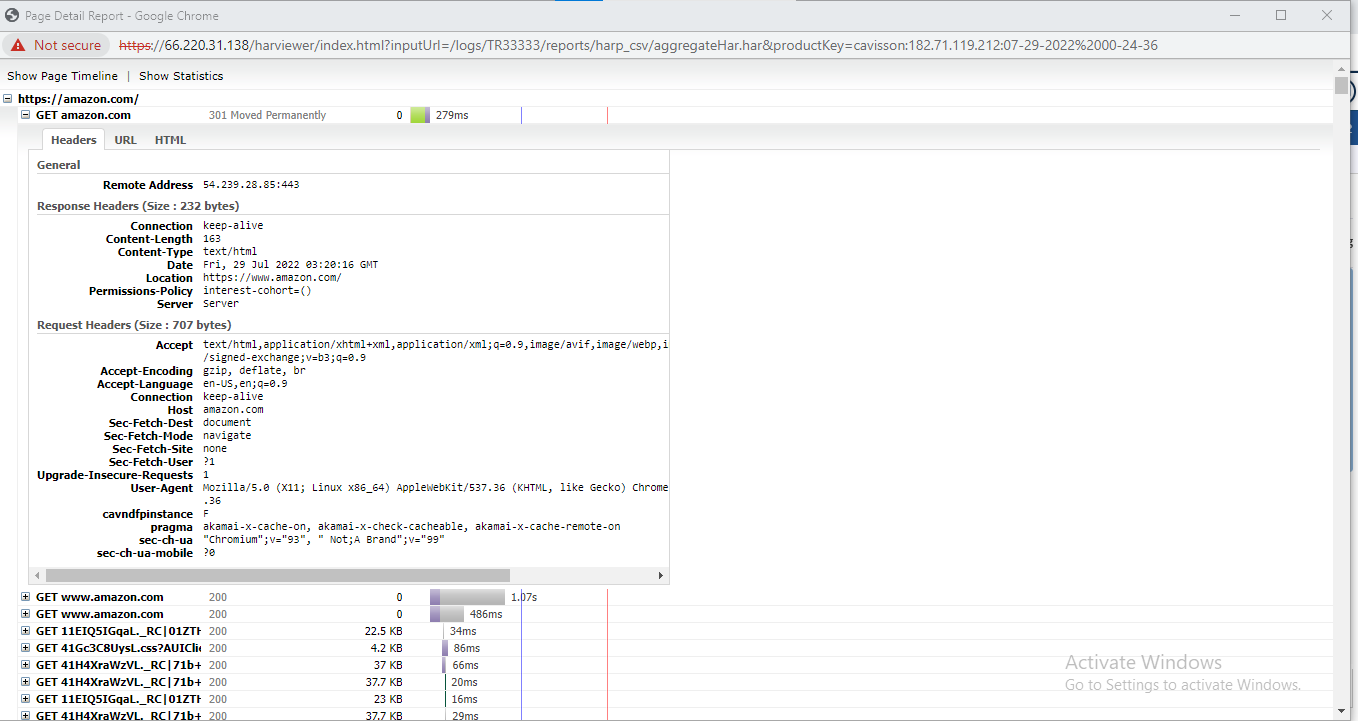
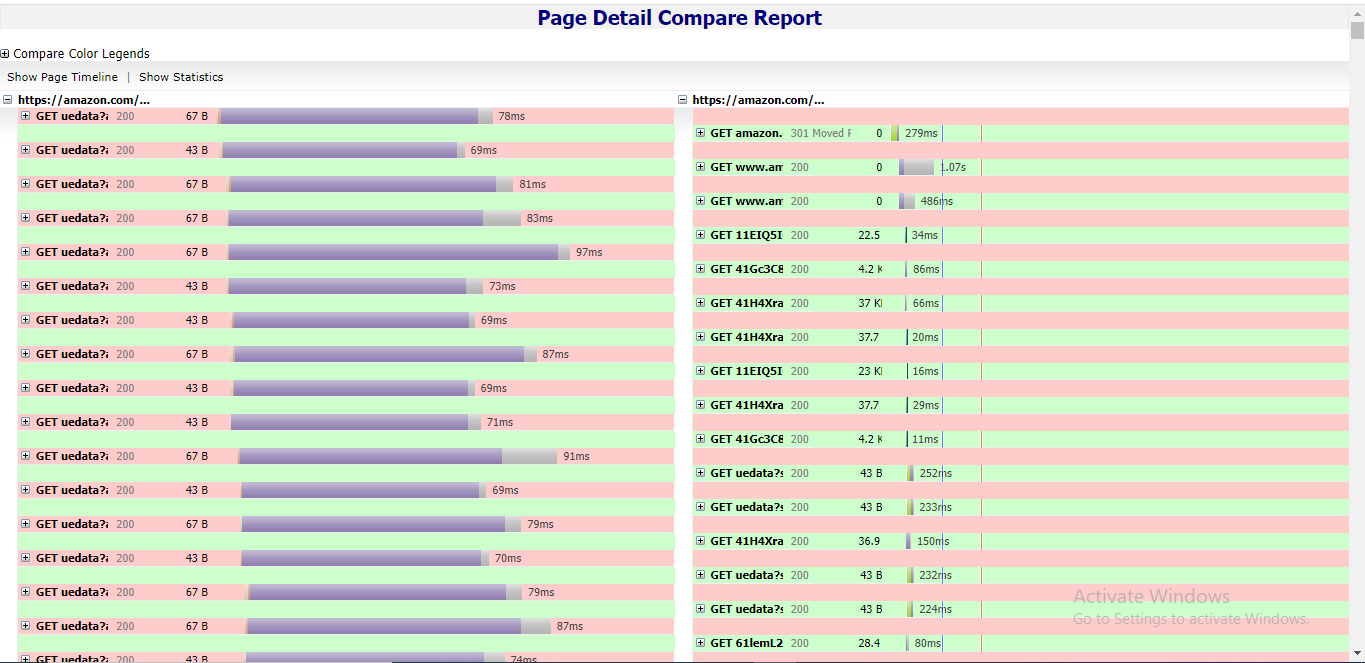
The following comparison report is displayed:
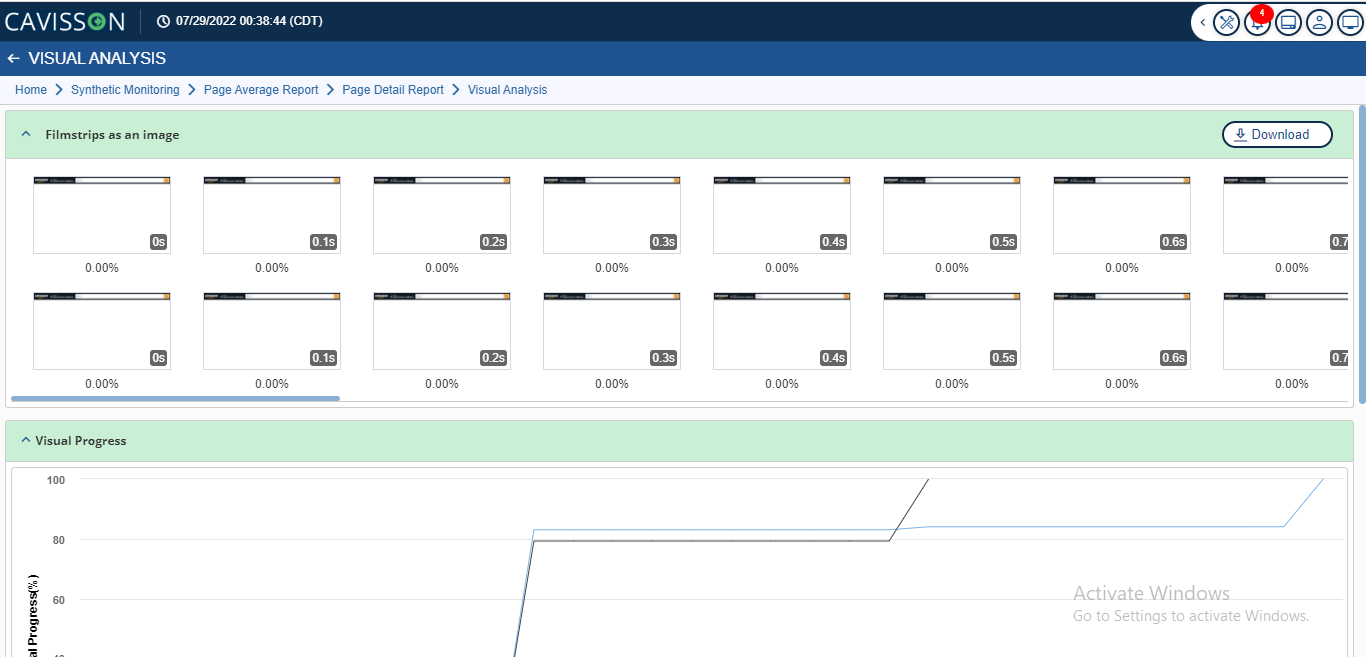
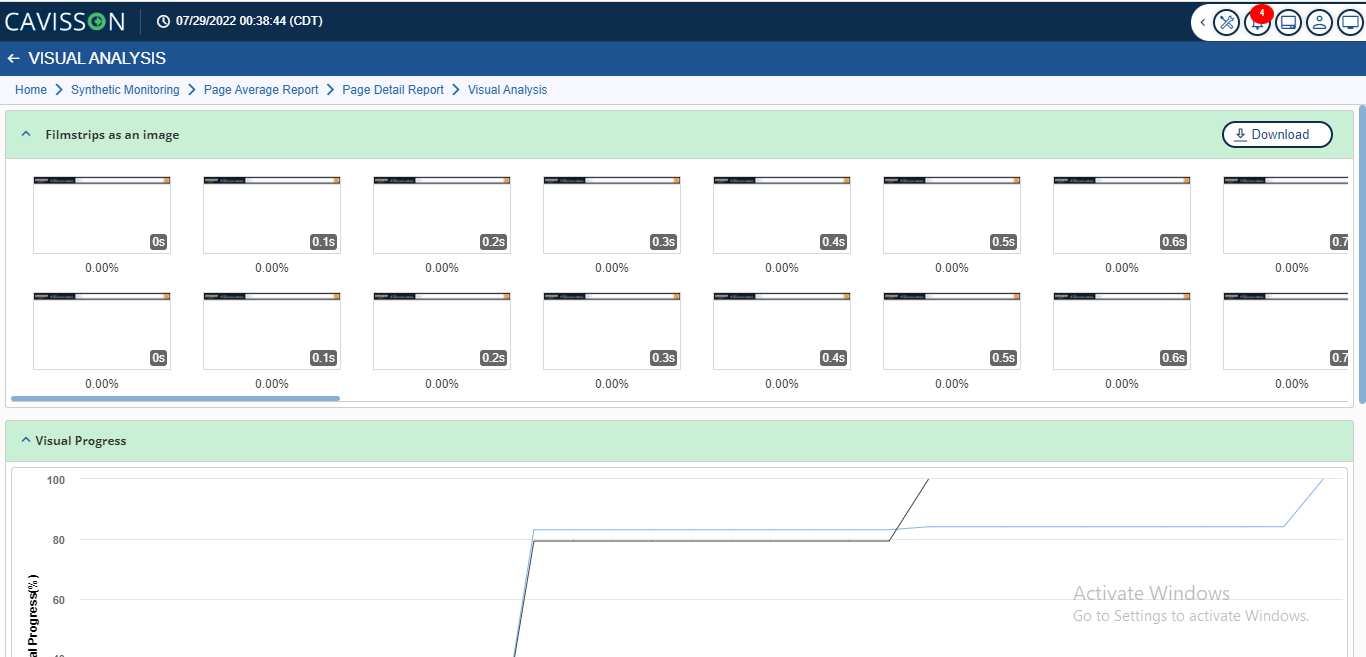
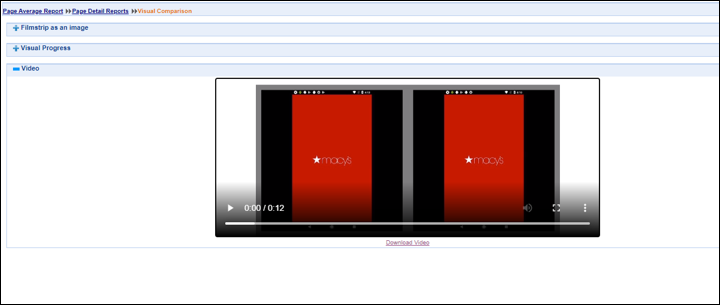
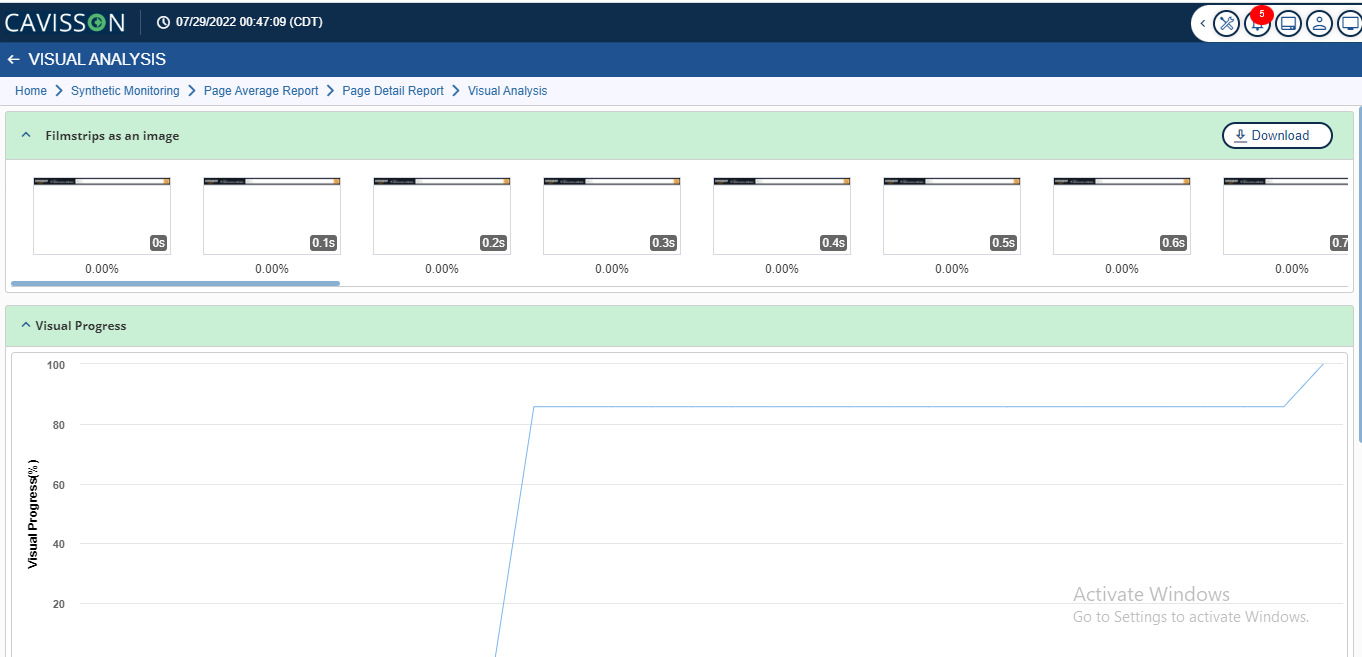
For Visual Comparison between two or more pages, you need to select the required pages and click the Visual Comparison button on Page Detail Reports window. This displays visual comparison as film strips, visual progress, and video.
