Release 4.8.0 is intended for a major revamp of Cavisson products in a new unified interface. This document provides information about the new Unified Dashboard, enhancements, and performance improvements in Cavisson products.
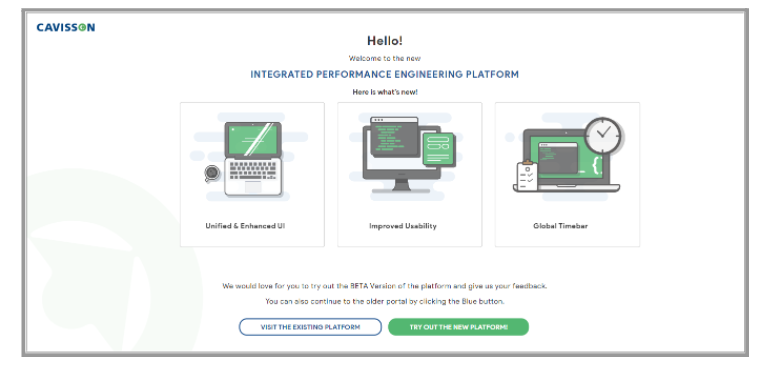
Integrated Performance Engineering Platform
Cavisson introduces the Integrated Performance Engineering Platform to enrich your experience by providing an end-to-end capability within a unified dashboard. The unified dashboard framework enhances the agility and enriches the capabilities where the performance users can navigate issues faced on the browser and can drill-down to method level issues and corresponding logs. This capability provides a seamless integration of multiple Cavisson Products, such as Application Performance Management (APM), User Experience/Session Monitoring, and Log Monitoring.
Integrated Performance Engineering Platform Capabilities
- Dashboard
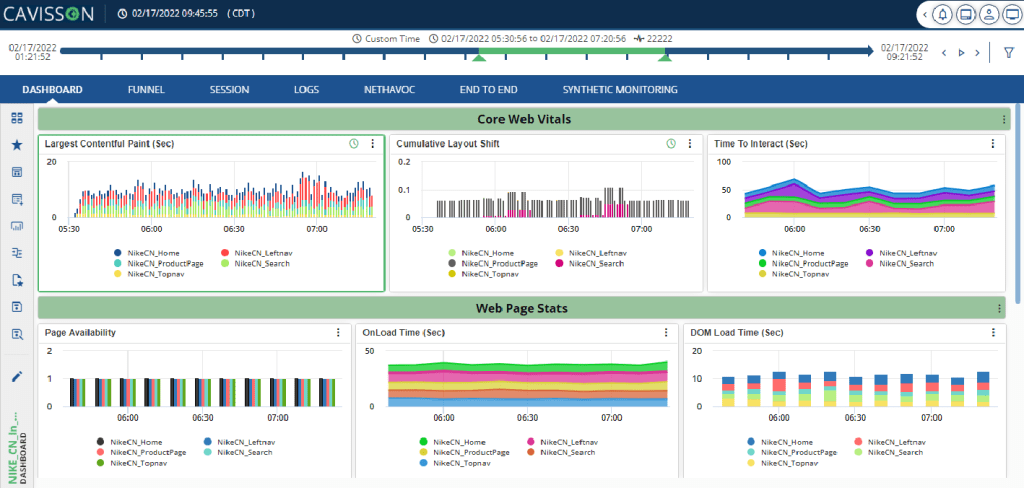
Unified Dashboard
The new Dashboard is more interactive with enhanced colors, better layout, and improved performance. It includes the following features:
Synthetic Monitoring
NetVision SM is an active monitoring approach through simulation of typical user navigation paths using scripts. It monitors availability and various metrics of performance for critical web pages and is based on multi location and supports script recording via multiple channels, such as desktop, mobile, and so on.
- Active monitoring through simulation of typical user navigation paths using scripts.
- Monitors availability and various metrics of performance for critical web pages.
- Multi-Location, Multi-Channel.
- Performance baseline, Manage third party SLA, Benchmark competition.
New feature added:
Monitor multi-channel web site all the time from multi-location
- Measure entire multi-page workflows simulating a complete customer navigation path including form data submission and user-actions click and record scripting of tests.
- Benchmark against the competition and baseline the performance for each critical page through scheduled reporting.
- Real time alerts for any degradation in performance or availability.
Configure service for round the clock availability monitoring
- Agents located at geographically distributed data centers around US
- Add/delete locations as per demand for various jobs
- Use real browsers (Chrome, Firefox) that are used by customers
Analyze Performance issues instantaneously before it impact customers
- Drill down to analyze performance issues against baseline/trend and pin-point what has caused degradation in performance.
- Full resource waterfalls and page performance load times from the browser timing and navigation APIs.
Dig into Back-end issues with integration of SM with NetDiagnostics
- Seamless tracking of web request from front-end to backend server to get insight on backend issues
Tier/service/class/method taking time and identify hot spots
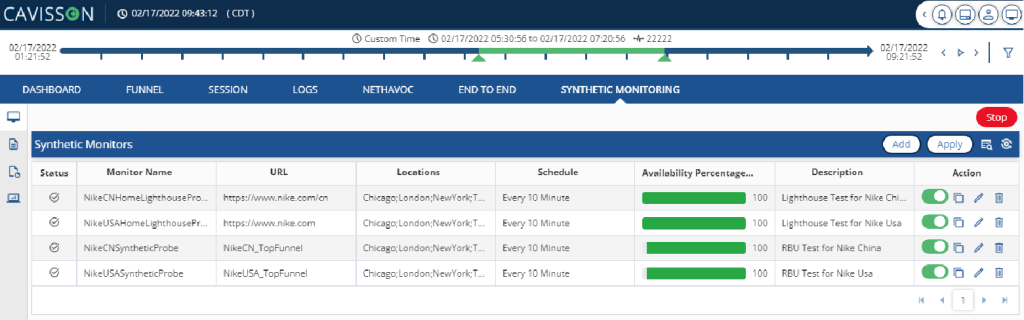
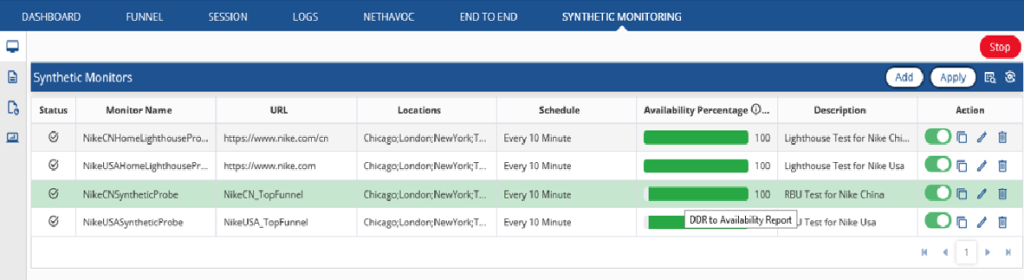
Home Page
In the Home Page screen, we can see the following :
1: List of all synthetic monitors with their status (4 SM are applied in the above snapshot).
2: Observe the availability percentage for each of the monitors.
3: Add new synthetic monitors.
Product Detail – ADD
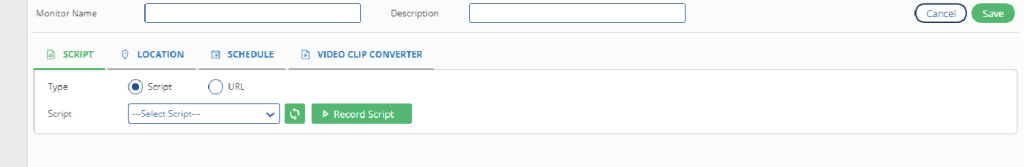
Script/URL – Enter the URL/Script on which the monitor is supposed to run.

Location – Denotes the different locations from where the synthetic user session can be generated.

Option to select whether the videos of the synthetic sessions will be captured or not. Option for an image recorder is also available.
Synthetic Monitor – Availability
- From the SM Homepage, click on Availability % bar to DDR to this availability report.
2. Once clicked, it leads you to the Overall Availability page for the monitor which denotes the availability of the URL and also a location wise breakdown.
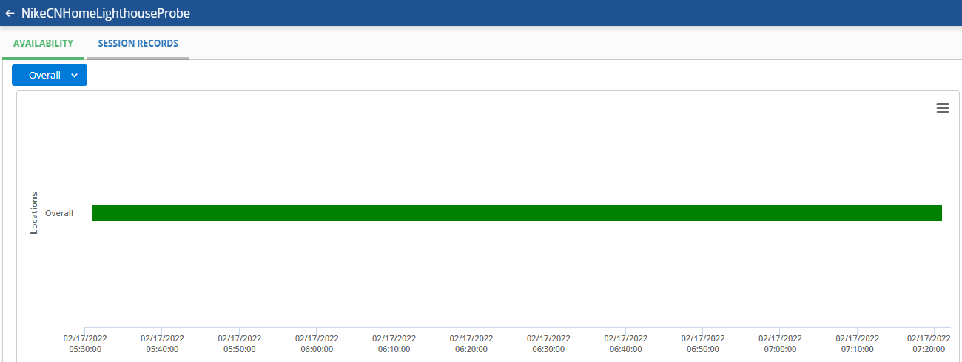
3. There is also an option to view the synthetic sessions created during the monitoring interval.
Synthetic Monitor – Session Records

- This page details the sessions that are generated during the execution of the synthetic monitor.
- The page provides details like: the session duration, location, start time and the browser.
- You can check the sessions that were successful and those that reported an error, enabling you to quickly identify the problematic sessions.
- The users can further drill down from the sessions to view the entire performance of the web pages in the respective sessions.
Web Performance Report
- The Web Vital Performance Report provides a set of three different reports: Web Vital Average Report, Page Average Report & Lighthouse Report.
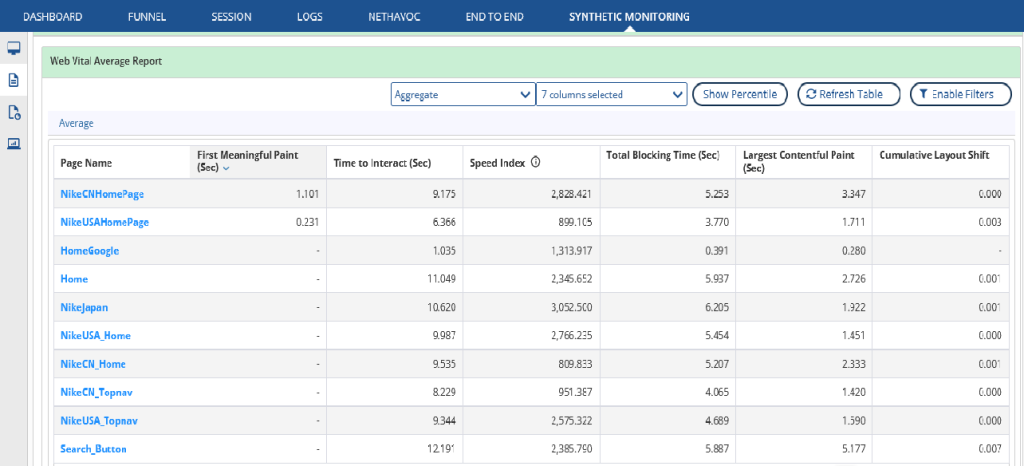
- Each report summarizes the pages and important metrics for an overview to quickly identify and drill down to the pages that would need immediate attention.
Web Vital Report
- The report provides information about the performance of the website by collecting the real world usage data.
- Using the Web Vital Average metrics, one can optimize the user experience, measure the loading performance, interactivity, and visual stability of your web site.
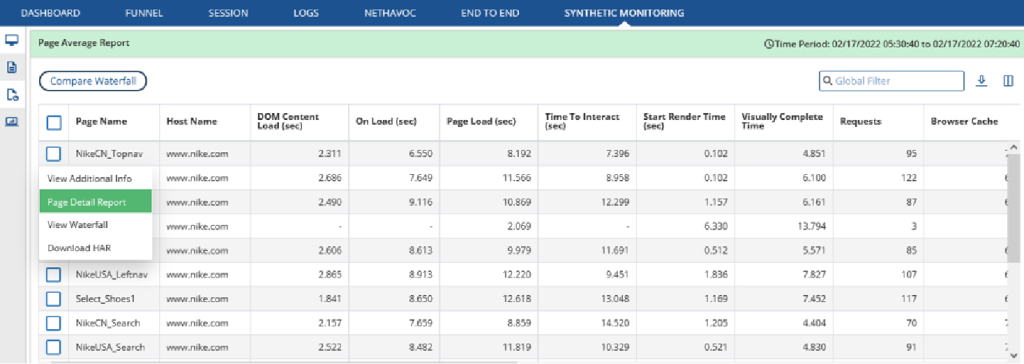
Page Average Report
- Using the Page Average Report, you can analyze the details of a user session, such as the average page detail, session details, DOM content and page loading time, number of user requests, and page loading time.

- Click on the icon “Page Average Report” to get a list of all the pages that have been captured during the monitor execution.
Resource Waterfall
On the previous page, click on “View Waterfall” against a page to get the complete breakdown of all the components and their timings against a web-page for easy identification of resource intensive activities that occur during the page load.
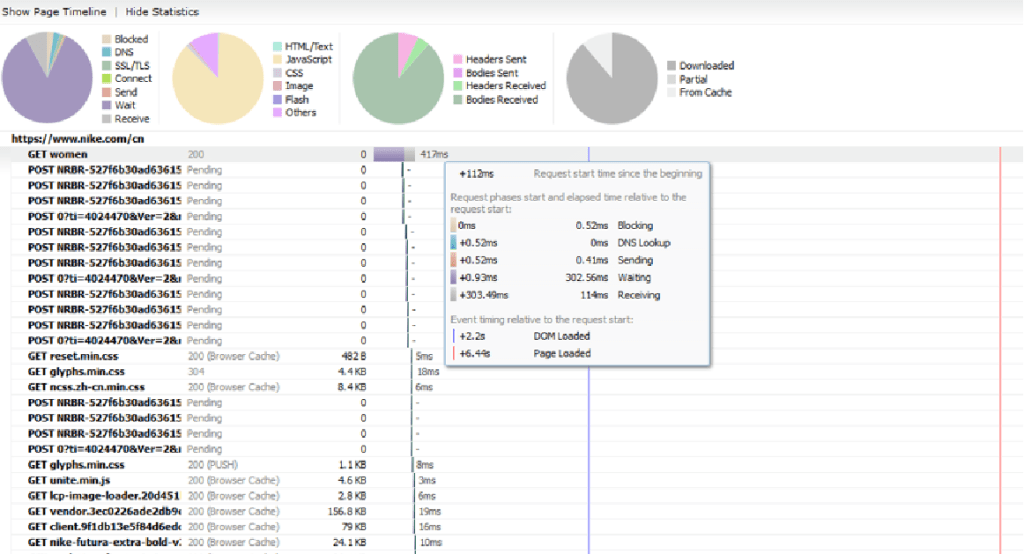
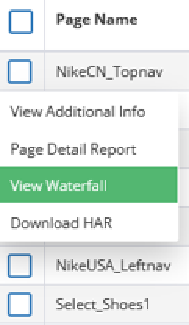
2. The information is vital in order to optimize your webpages for improving customer experience.
Page Detail Report
- Right click to get to the “Page Detail Report” to get a list of all the instances when a particular page has been hit during the monitor execution.
2. The “Page Detail Report” gives an extensive detail against a particular webpage.
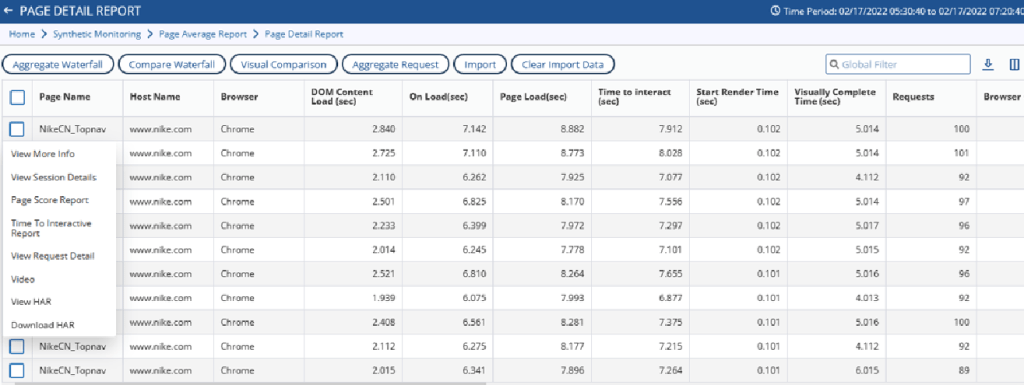
3. There are multiple options for the user from here:
- Page Score Report
- Request Details
- View the visual component analysis
- View Session Details
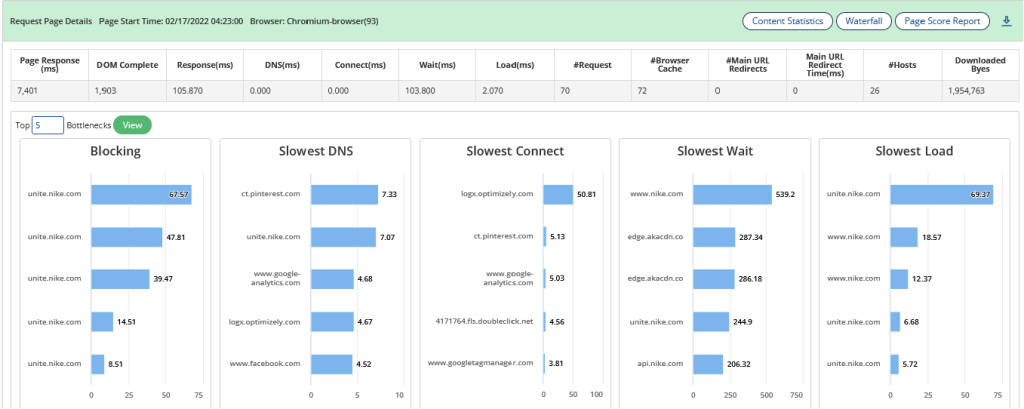
View Request Details
The Request Details page summarizes the top 5 bottlenecks as mentioned in the picture and the component causing the same with the intent being that the user is able to focus on the erroneous aspect immediately.
Page Score Report
The Page Score report is an important feature that is a recommendation and scoring engine aimed at ranking your webpage and suggesting options to optimize the page from multiple angles like headers, response, JS, third party services etc.

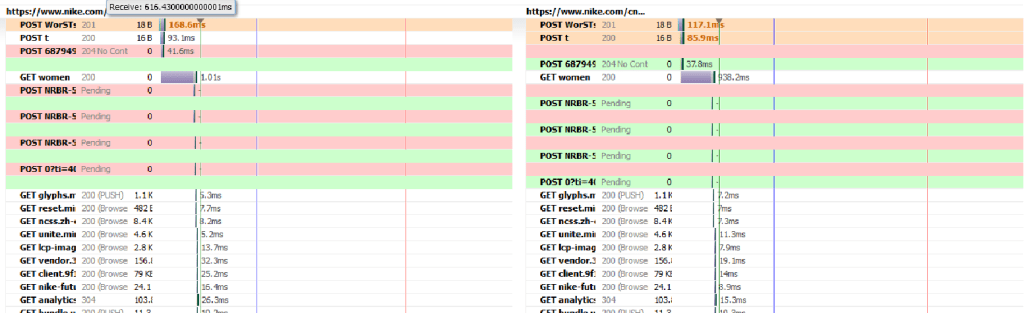
Compare Waterfall
Click on two pages to compare their waterfall breakdown of resources in two instances of the same page. This is highly beneficial to compare an erroneous page with a normal web page to understand the bottlenecks
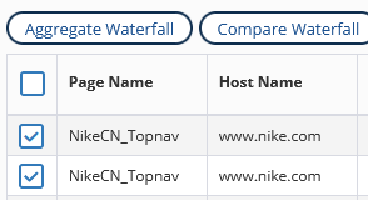
2. Click on two pages to compare their waterfall breakdown of resources in two instances of the same page. This is highly beneficial to compare an erroneous page with a normal web page to understand the bottlenecks.
Visual Comparison
- Similar to waterfall comparison, you can also compare the visual loading time of two instances of the same page to identify the load time and progress of the webpages, especially helpful when analyzing a slow-loading page to a better-performing one.

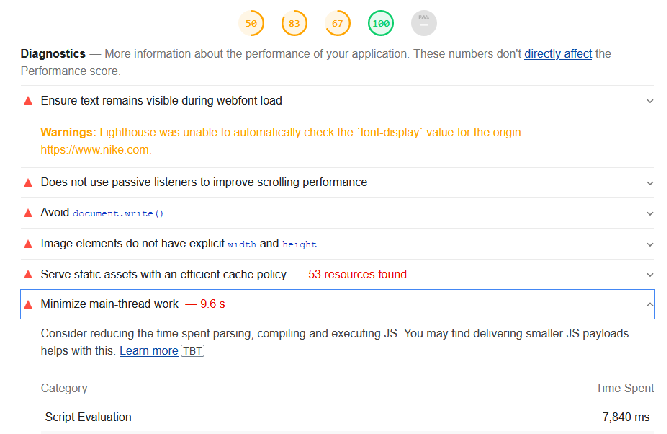
Integration with Lighthouse Report
With in-built integration with the powerful Lighthouse report, you can quickly drill down to the overall page health across 4 integral categories – Performance, Accessibility, Best Practices & SEO with added diagnostic capabilities to provide insights on drastically improving the overall user experience

Performance Enhancements
ID | Product | Description |
117435 | NetHavoc | Support “Application Disruption” Category Havoc in 4.8.0. |
118797 | NetHavoc | Merging of ProductUI NH UI with UnifiedDashboard NH UI for Kubernetes in 4.8.0. |
99905 | NetHavoc | NetHavoc || Need to support havoc injection in Kubernetes. |
118798 | NetHavoc | New Feature| Need Alert Overlay Feature for NetHavoc – clone 4.8.0. |
118227 | NetHavoc | 4.8.0| LRM NH Alerts || Need Alerts for Standalone Havocs and NH Scenario. |
117493 | NetHavoc | LRM NH Alerts || Remote Machine Option ||Alerts for NS-NH Remote Case Integrated Scenario are not generating” Alerts are needed on both NS and NH side. |
117493 | NetHavoc | LRM NH Alerts || Remote Machine Option ||Alerts for NS-NH Remote Case Integrated Scenario are not generating” Alerts are needed on both NS and NH side. |
117311 | NetDiagnostics | PHP Agent| Need support for php version 8.0 . |
113027 | NetDiagnostics | LRM : Support for opening Flowpath Analyzer report from icons in Action Column in Transaction Trend Report. |
110140 | NetDiagnostics | LRM : Support for opening Method Call details report form Action Column icons in Transaction Flowmap. |
108177 | NetDiagnostics | LRM |BT Trend| Flowpath report is not opening after click on any count while traversing through DrillDown >BT Trend Report. |
107829 | NetDiagnostics | Enhancement | PHP agent and proxy needs to support on Ubuntu 20. |
105856 | NetDiagnostics | LRM | Support Transaction FlowMap Report. |
113825 | NetForest | LRM|Logs|UX|There should be a “more info” icon on documents to expand them. |
105670 | NetForest | LRM|Enhancement for NF Phase 4 (Cluster Monitoring). |
100709 | NetForest | Ui must show the time in which reload operation was carried out for particulat server. |
118864 | NetForest | NFDB7.4|lookup |lookup query is giving no result found. |
118754 | NetForest | LRM|Node server is not running as a service. |
118640 | NetForest | Need logstash cloudwatch plugin in nfagent. |
116669 | NetForest | NFDB|NFDB7.4|Docstats with rex throwing “getting parse exception” with maxdocs. |
116664 | NetForest | nf forwarder is getting stopped when remote reload is called with https protocol. |
113461 | NetForest | getting parsefailure tags on dumping data through postman for json plugin. |
118922 | NetForest | getting parsefailure tags on dumping data in nfdb742. |
118754 | NetForest | LRM|Node server is not running as a service. |
118650 | NetForest | Netforest | NFDB | maxdocs | Getting loop issue while use fetch log without pipe with any other nfquery. |
118252 | NetForest | Netforest | NFDB | maxdocs | Fetchlog with append is not working. |
118197 | NetForest | nfagent supports log4j2 2.17.1 for nfagent-input-tcp plugin and all plugins. |
118146 | NetForest | Not getting any data in the nfagent_info index. |
118109 | NetForest | Netforest | NFDB | maxdocs | Getting loop issue when using lookup as inner join query. |
118080 | NetForest | Netforest | NFDB | maxdocs | Getting zero result when we querying append with top construct. |
118077 | NetForest | Netforest | NFDB | maxdocs | lookup with append throwing no result found. |
118076 | NetForest | Netforest | NFDB | maxdocs | fetch with apped getting no result found. |
118073 | NetForest | Netforest | NFDB | maxdocs | When querying any pipe query with Logical operators in inner join query getting “No Result Found”. |
118025 | NetForest | Netforest | NFDB | maxdocs | Getting Zero result when we are using fetchlog construct without pipe in join inner query. |
117963 | NetForest | Netforest | NFDB | maxdocs |There are different internal query created sometime, when we are executing through automation. |
117955 | NetForest | log4j2 2.17.1 support in nfagent. |
117941 | NetForest | Netforest | NFDB | Nfdb need a log4j 2.17.1 for critical vulnerability. |
117885 | NetForest | Netforest | NFDB | maxdocs | Getting loop issue while we are using sort in inner append query. |
117884 | NetForest | Netforest | NFDB | maxdocs | mvexpand with inner apend throwing unexpected response. |
117883 | NetForest | Netforest | NFDB | maxdocs | When we are using table both for inner and outer append query getting preappend response only. |
117859 | NetForest | Data is not coming in NF while drill down from ND. |
117847 | NetForest | log4j2 2.17.0 support in nfagent . |
117810 | NetForest | Netforest | NFDB | maxdocs | getting zero result when we are using append with some nf construct. |
117737 | NetForest | Netforest | NFDB | maxdocs | getting unexpected result when we are using append with some nf construct. |
117480 | NetForest | Netforest | NFDB | maxdocs | Getting NullPointerException when we are using fetchlog construct as inner query in the join construct. |
117472 | NetForest | Netforest | NFDB | maxdocs | Eval case statement with join throwing zero hits with “no result found”. |
117445 | NetForest | LRM|Cluter Monitor|Getting negative value for second node in doc/sec graph of cluster Monitor. |
117438 | NetForest | Netforest | NFDB | maxdocs | when querying mvcombine with join going into loop. |
117377 | NetForest | LRM|Cluster Monitoring|Need to show only required information option in Cluster health. |
117358 | NetForest | LRM|Logs|UI changes in LRM Logs section. |
117163 | NetForest | Netforest | NFDB | maxdocs | Getting less than expected hits while using eval after mvcombine. |
117151 | NetForest | Netforest | NFAGENT | unable to get config index from nfdb742 in nfagent. |
117072 | NetForest | Netforest | NFDB | maxdocs |getting different number of hits with mvcombine. |
117044 | NetForest | NFDB|NFDB7.4|Docstat throwing “getting parse exception” error. |
116952 | NetForest | Netforest | NFDB | maxdocs | mvcombine is not working properly with maxdocs param. |
116899 | NetForest | Netforest | NFDB | maxdocs | Append Query is not working properly with maxdocs param. |
116719 | NetForest | Netforest | NFDB | maxdocs | When using fetchlog with pipe with maxdocs is going into loop with rex and eval. |
116711 | NetForest | Netforest | NFDB | maxdocs | When querying Logical operators in inner join query getting “No Result Found”. |
116669 | NetForest | NFDB|NFDB7.4|Docstats with rex throwing “getting parse exception” with maxdocs. |
116664 | NetForest | nf forwarder is getting stopped when remote reload is called with https protocol. |
116610 | NetForest | nfdb-7.4.2|NF_unified_reports|stacked area chart not created in nf-reports. |
116524 | NetForest | Netforest | NFDB | maxdocs | Getting response from different index value when we are querying multirexeval with join. |
116421 | NetForest | nfdb-7.4.2|NF_unified_reports|donut chart not created in nf-reports. |
116401 | NetForest | Not getting build details of nf forwarder in reload section(Log agent info) of lrm gui. |
116400 | NetForest | nfdb-7.4.2|NF_unified_reports|mailing feature is not working with scheduling of reports. |
116060 | NetForest | nfdb-7.4.2|NF_unified_reports|Pie chart not getting created in pdf report. |
115727 | NetForest | nfdb-7.4.2|NF_unified_reports|scheduling is not working for reports. |
115094 | NetForest | NFDB7.4|Mv Construct |getting different number of hits with mvcombine. |
114779 | NetForest | Netforest | NFDB | maxdocs | Merge with include and exclude function throwing unexpected result. |
113461 | NetForest | getting parsefailure tags on dumping data through postman for json plugin. |
111954 | NetForest | Netforest | NFDB | maxdocs | Docstats construct is returning constant 10k hits with maxdocs param. |
100551 | NetForest | Reload tooltip should be there on reload icon. |
62136 | NetForest | Not getting desired output while running exec query for evaluated field. |
118183 | NetVision | LRM | Page Performance Overview | In Filter, After setting End Time, Starts At Field getting blank. |
117425 | NetVision | LRM | Page Performance Details | In Default Time Period, Data is not showing in Resource Tab, wrong data is showing in Domain Tab, and Issue with Resource Tab query when NO Page Selected. |
107995 | NetVision | Garbage Subjects (Vectors) are coming in Unified Dashboard in case CMT is running in TSDB mode. |
119218 | NetStorm | LRM – GUI | 480 | Progress report is not showing anywhere in the UI. |
119198 | NetStorm | LRM| 4.8.0 | When we create profile. “help” instruction is not right. |
119148 | NetStorm | LRM| 4.8.0 | Tooltip should come in sort and view icon in SM. |
118926 | NetStorm | Project and SubProject LRM Conversion in Angular 9. |
118925 | NetStorm | NSDRM Configuration LRM conversion in Angular. |
118476 | NetStorm | If a TR doesnot contain neither tsdb files nor rtgMessage.dat or testrun.gdf file along with summary.top,sorted_scenario.conf and .curPartition file then it should be reflected as bad TR and get removed. |
118419 | NetStorm | RBU || 4.8.0 || Need to change selector sequence used in extension. |
118360 | NVSM | NVSM || 4.8.0 || Getting misc error when running test in nvsm mode. |
118382 | NVSM | NVSM || 4.8.0 || RBU test is getting terminated after some time. |
118857 | NVSM | NVSM || 4.8.0 || Unable to open script manager |
118952 | NVSM | NVSM || 4.8.0 || Old/New scripts are not coming in drop down while adding a new monitor. |
114042 | NVSM | NVSM || 4.8.0 || NVSM setup migration. |
119164 | NVSM | NVSM || 4.8.0 || Metrics like On/Dom load with value 0 is coming as -1 in import window. |
119165 | NVSM | NVSM || 4.8.0 || Multiple transactions are coming for single imported transactions. |
118894 | NVSM | NVSM || 4.8.0 || Getting wrong value when doing visual compare. |
119183 | NVSM | NVSM || 4.8.0 || Availability Percentage is not working. |
119045 | NVSM | NVSM || 4.8.0 || Unable to run NVSM test. |
119246 | NVSM | NVSM || 4.8.0 || Need data in page dump report. |
119092 | NVSM | NVSM || 4.8.0 || Default chrome version should be 93 in scenario. |
119275 | NVSM | NVSM || 4.8.0 || Need lighthouse average report for RBU type test in 4.8.0. |
119157 | NVSM | NVSM || 4.8.0 || Unable to run NVSM test from UI. |
118789 | NVSM | NVSM || 4.8.0 || Time filter option not working properly in synthetic monitoring window. |
118446 | NVSM | NVSM || 4.8.0 || Need option to configure Har_Timeout value from NVSM UI. |
119389 | NVSM | NVSM || 4.8.0 || Unable to run url based nvsm test. |