This page covers release information for Cavisson Product Suite version 4.6.0. It provides high-level changes from the last release to this release. For the latest support and advisory on new features, enhancements, and bug fixes please subscribe to the product-specific announcements and newsletters from www.cavisson.com.
New and Enhanced Features in 4.6.0
Common UI
This section lists all the common features for all/some products.
Dashboard
- Renaming the Controller Name in Manage Controller UI: You can rename the controller name and can change the tomcat and other ports (For example – HPD, NDC, TSDB, api_gateway, LPS, etc.) from the Manage Controller UI for a controller.
- Display Transaction Data in Milliseconds: Earlier, the transaction data was displayed in second(s) and from now onwards, it is displayed in milliseconds.
- Display of Alert History on Selecting Custom Event Day: Earlier, when you applied a custom event in the Dashboard time preset, the preset was not getting reflected in the Alert History time preset. With this enhancement, you can now apply Custom event preset in both Dashboard time preset & Alert History time preset.
- Support of Performance Stats Report in MultiDC: Earlier, the Performance Stats Report was supported for a single data center only. Now it can also be generated for multiple data centers also.
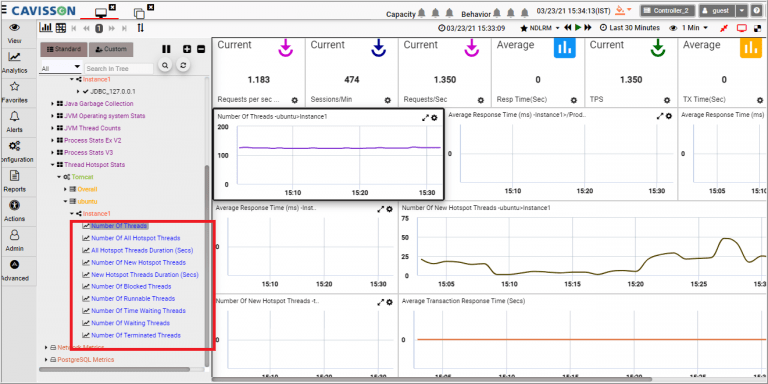
- Graphs Name (Thread Hotspot Stats) in the Title Case: The names of the Application Metrics inside the Thread Hotspot stats were written in the Sentence case. However, the graph names are being represented in Title Case. So changes are made to represent the Thread Hotspot Stats graphs in Title Case.
- Features Conversion from Old UI to LRM UI: Some more features from the old UI are now converted to LRM UI.
Data Retention Policy
- Component to Remove Logs from Product Logs File: With this enhancement, now Logs (scriptConverterLogs, auditLogs, restservices, configUILogs, tsdb, alertLogs, kpiLogs, ddrLogs) can be removed from the product logs file with data retention policy under Cavisson Product Logs Tag. Earlier, these logs were removed using a custom path.
- Adding Negative Days for More than One Time: Earlier, when you used to add negative days for any component, an error message was displayed as a component already present in the table. By this enhancement, you can add multiple negative days for a single component and no error messages are displayed. You can now add negative days for more than one time in Data Retention Policy UI.
- Enabling Data Retention Policy (if disabled): If data retention is not enabled on the machine, a message is displayed to enable the Data retention policy and you can enable it by changing the configuration (if you have an admin capability). If you do not have admin capability, you only get the message, but you cannot enable the retention policy.
- Cleanup Shell to Calculate Size of Transposed Data: You can now calculate the disk usage by clicking the Test run link in the Testrun UI. Disk usage is displayed according to the component. Earlier, the transposed size was not included in the metric data (graph data). Now, the size of the transposed data is included under the metric data.
Monitoring Suite
NetDiagnostics
- Calculate Min/Max Integration Callout per Second: Earlier, the agent only calculates the average callout per second. Now the agent can capture min/max callout per second.
- Installation of SaaS Feature via UI and Silent Mode: Some parameters are added for SaaS features installation while installation of Cavisson agents via Silent Mode as well as via Wizard.

- Support for JMX MBean info in JSON Format: Earlier in this feature, Mbean File was dumped in text format, it is unstructured data, not easily understandable. Therefore, this feature is enhanced in which the file is dumped in JSON format (semi-structured data). It helps to understand the Mbean data with ease. This feature is supported with New Message Protocol and old NDI Runtime Changes as well.
Monitors
- UI Support for Generic Framework for Capturing JMX Beans Attributes: You can configure the JMX-based monitors and apply monitors on the machine agent as well as on the application agent from Monitor UI.

- Generic Rest Monitor for Nginx: Monitoring support is provided for Nginx. Two Nginx Monitors are added with new configuration UI:
- NginxPlusSlabPages
- NginxPlusSlabSlots
Nginx is a high-performance open-source HTTP server and reverse proxy, and an IMAP/POP3 proxy server. It can be used as a standalone web server, or serve in front of other web servers as a reverse proxy i.e is a device or service placed between a client and a server in a network infrastructure.
- Implementation of New Monitors for MongoDB Monitoring: The following stats are fetched now to know MongoDB health – performance stats, query and execution stats, session stats, and locks.
Configuration json for all the above monitors are bundled in MBean/XML directory of the controller:
- Execution Stats – MongoExecutionStat.json
- Session Stats – MongoSessionStats.json
- Config Stats – MongoDBParamConfig.json
- To fetch server name – MongoDBServerName.json
Old MongoDB monitors have also been migrated to new generic code of mongodb:
- CollectionStatsEx – MongoCollectionStat.json
- ReplicaStatsEx – MongoDBReplicaMonitor.json
- DBStatsEx – MongoDBStat.json
- Integration with DynaTrace: You can capture metrics of DynaTrace through the rest API as DynaTrace monitoring support is provided in ND. With this integration, you can monitor DynaTrace Host stats. In DynaTrace, you can generate a token from the UI and this token never expires. Then, you can use this token to generate the output or to get the metrics data.
- Support of Command Arguments for Generic Command Monitor: You can now configure command with arguments like this:
“input”: {
“actionStr”: “nsu_server_admin -s {Server} -c {cmd}”
}
And provide actual command arguments at runtime while configuring monitor with monitor argument
(-Q/–param)
-Q “{Server}=10.10.60.11,{cmd}=pwd”
You can configure any number of command arguments with comma-separated and can use any syntax for Key=Value matching. However, that Key should be the same at both places (config file and monitor arg).
- Highlighting the Selected Graph Type in “Open Chart Settings” for Graph Panels: When you select the graph type then the corresponding graphs are highlighted with color instead of the radio button in the Open Chart Settings options.
- Addition of One More Graph in JettyThread Monitor: One more graph is added in JettyThread monitor to show the “reservedThreads” attribute.
- In addition, four graphs are added in JettyThreadStrategy monitor:
- pCTasksConsumed
- pECTasksExecuted
- ePCTasksConsumed
- pICTasksExecuted
- Change in the Configuration UI of PgPool Monitors: A new Configuration UI of PgPool monitors is implemented with the below inputs from the user:
- Host Name/IP as mandatory with default host “localhost”
- Port as mandatory with default port “9999”
- DB Name as mandatory with default db “Postgres”
- Username as mandatory
- Password as mandatory
NetVision
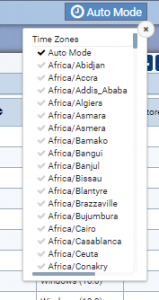
- Support for Custom Time Zone: Added an Auto Mode option in NetVision that enables you to view data in your default time zone. Data is displayed based on the location of the user’s browser. In addition, you can define your custom time zone by clicking the Auto Mode option and selecting the required time zone from the drop-down list.
- Support for AutoTrace in NV Agent UI and JAgent of NV: Support to capture the request and response body of an HTTP request on application servers.
- Added a Back Button in the Review Screen: Clicking the Back button, you can now review the feedback.
- Monitor Failed NV Calls: For monitoring failed calls in a session, a 1 xhr monitor is added in cav_nv. If any call fails, it dumps the request URL with failure code in a separate log file at hpd, which can be used to debug client application issues. A flag is raised if data is not captured completely. Added an icon in the Pages window to indicate any missing data.
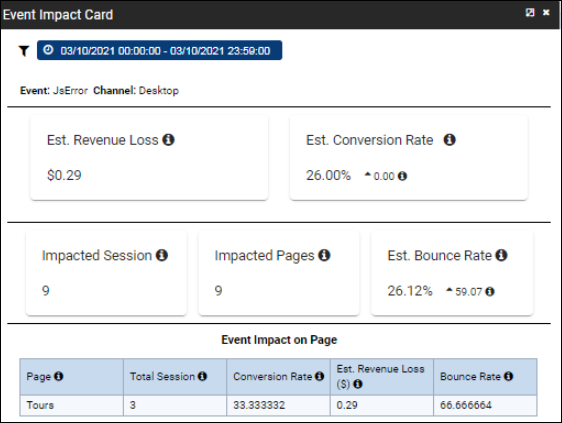
- Estimate the Event Impact on Revenues: Added an option Impact of Event to analyze the impact of failures on the company revenues. This option displays the Even Impact Card window that enables you to perform the impact analysis of events by providing information such as the estimated revenue loss and conversion rate.
- Use Checkpoint as a Trigger in the Callback Designer
NetForest
- Support of Auto Fill of hh:mm:ss.sss Value in Fetchlog Query: Earlier, the full timestamp format is supported (i.e YYYY-MM-DD HH:mm:ss.SSS) in startTime and endTime parameters of fetchlog. Now, support for default value is provided i.e. 00 if you do not place any value in the syntax.
For Example:
If you want to search startTime only upto min.
fetchlog index:”gcp*” where startTime == “2019-08-30T11:22”
It automatically fills the second/millisecond values in backend:
fetchlog index:”gcp*” where startTime == “2019-08-30T11:22:00.000”
AI / ML
- AutoRCA Process Starts Automatically on Reboot: After reboot, the AutoRCA process now restarts automatically.
- Added a ‘Download’ Option in the Alert Table: Provided an option to download the Alert table in different formats, such as CSV, PDF, Excel etc.
- RCA Events Reflected as Alerts/Notifications: The RCA events dumped by the RCA tool are now displayed as alert/notifications on the UI.
- Ability to Change Image in the RCA Graph: You can now apply a selected image on the nodes of the RCA graph. In the Root Cause Analysis tab, click the Image Configuration icon to open the image gallery and apply the required image.
Performance Suite
This section lists all the new features and enhancements in the performance suite products.
NetStorm
Script Manager
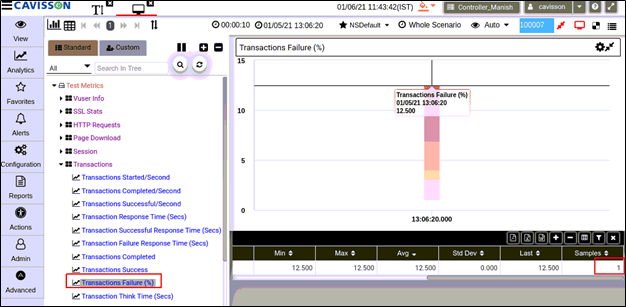
- New Data Type for Transaction Failures: NS now supports a new data type for Transaction Failures. The new data type will include both the total transaction count and the percentage (%) of transaction failure. The samples are now displayed as the total number of Transactions, instead of failed transactions count.
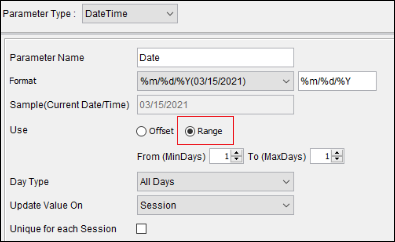
- Addition of a Range Option in the DateTime Parameter: You can specify a range of values for the random offset values in the DateTime parameter using the Range option. Previously, you could add only one offset value in the DateTime parameter. Now, support for random date selection within a given range value is provided.
- Parameterization of authCredential: The ns_browser() API attribute now supports parameterization of the username and password value used for authentication. While recording a script, the Script Manager will capture the authentication credentials and save in the flow with AuthCredential attribute of ns_browser() API.
Example:
ns_browser(“index”,
“url=https://perf.michaels.com/”,
“browserurl=http://perf.michaels.com”,
“action=Home”,
“AuthCredential={userrname}:{password}”,
“title=Michaels Stores ? Art Supplies, Crafts & Framing”,
Snapshots=webpage_1562138176685.png”);
- Support for APIs Load runner apis lr_replace and lr_xml_replace: Load runner apis lr_replace and lr_xml_replace APIs are now available in NetStorm.
- Added an Example for Creating Avro Kafka Producer Script: Included a commented example for putting values while creating Avro Kafka producer script for generic schema type. You can now refer to the commented line example for specifying the values of the schema.
//Example: avroRecord.put(“Name”, “Value”);
Scenario
- Need to pass ”” in case no ciphers are selected for keyword G_CIPHER_LIST: You need to pass ”” with the keyword ‘G_CIPHER_LIST’ in case you have not selected any ciphers in the scenario.
- Option to Manage the Number of Users: Selecting the CPU option now displays the Number of Users/Sessions field where you can specify the minimum number of users in a session. By default, 50 users are available per session.

TestSuite
- Added Git Pull Support: If you have configured a GIT repository with your NetStorm machine, you can now select the Git Pull option to retrieve saved test suites and scenarios from the repository. If a Git repository is not configured, you can specify the configuration for the repository in Jenkins.

NetOcean
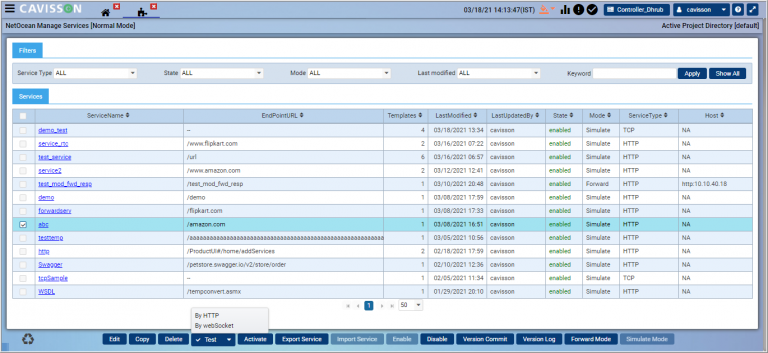
- Simulation for WebSocket Type Calls: Support for WebSocket call simulation is provided in NetOcean. If the simulation support for WebSocket is there, then it can be tested without the need for the application. You can record and simulate Web socket protocol-based services and it also removes dependency in the testing environment from Real Web Socket Protocol Based Application.
- Logging of Service Time: In the Service Time Graph, three parts are provided.
- Part One – Graph line Indicates the normal/default service time of service.
- Part Two – If you apply any Service Time Delay, the graph line displays only Service Time Delay graph.
- Part Three – Graph line display Total service time (i.e. default service time + Delay Time).
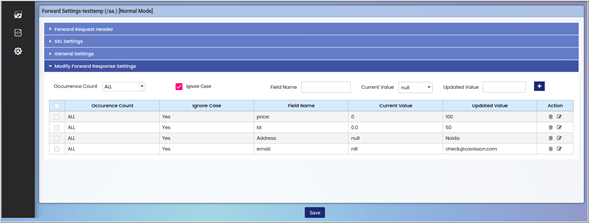
- Updated Forwarded Response: You can modify the forwarded response if in-case forwarded response has any error/incorrect response fields. This helps in avoiding false/incorrect responses to applications from forwarders.
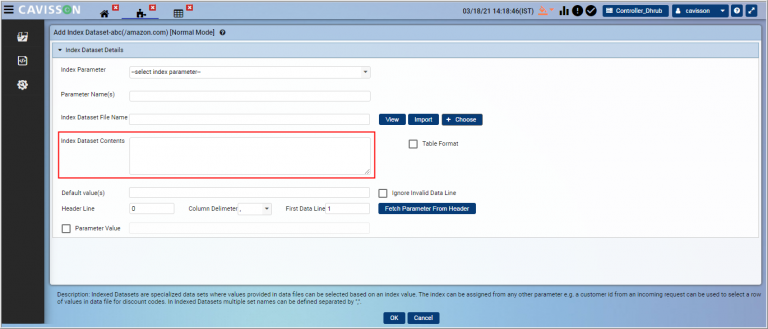
- Enlarged Text Box for Index Dataset Content: The text box is enlarged to provide index dataset content (Index Dataset Parameter) and a Table Format check box is added to display the content in tabular format.
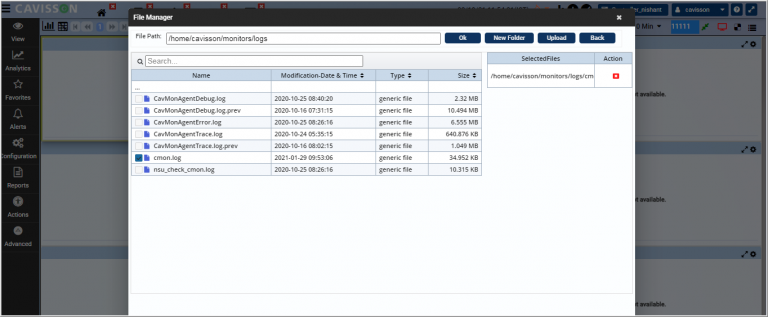
- ‘Download File’ Feature for Monitors Log Directory: Earlier, there was a restriction to download the file from the path followed by controllerPath only. Now, you can download the file from any path.
- GIT Configuration: A single GIT repository is provided for NS test-assets and NO correlation for NS+NO type machine.

NetHavoc
- Drive Info Support for Windows: Windows support is provided for machines on which fault has to be applied, such as for CPU Burn, Fill Disk, I/O Burn, and Fill Memory havocs in NetHavoc.
- Support of Retention Policy: You can now delete old logs in the nethavoc.log file present at the following path:
/home/cavisson/work/netHavoc/logs
/home/cavisson/work/webapps/netstorm/logs/nethavoc.log
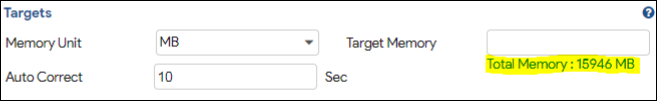
- Analyze the Server Memory: You can now analyze the target server memory before injecting Memory Outlay havoc in the server. Select a Memory unit such as MB, GB, or Percentage. Accordingly, the Target Memory is displayed in the selected unit, as shown highlighted below:
Bug Fixes
Criteria
- Status:Resolved, Built, Verified, Closed
- Target Milestone:4.6.0
- Severity:Blocker, Critical, Major
- Priority:All
- Resolution:Fixed
- Business Unit:Client / Presales
List of Bug Fixes
| ID | Product | Description |
| 103599 | Installer | RHEL CavBin | Getting Path error while running the test in rhel environment |
| 103600 | Installer | Rhel CavBin | Getting some error while running rhelSetup.sh shell for installing the dependency packages for CavBin Installation. |
| 103147 | NetCloud | Connection not establishing from Generator to Controller. |
| 98400 | NetDiagnostics | HAProxy Monitors are not reflected in GUI after runtime changes |
| 100971 | NetDiagnostics | High CPU Utilization of CavNDProxy due to memory leaks |
| 101726 | NetDiagnostics | Not able to access ATG from UI |
| 103066 | NetDiagnostics | Not able to run script on server with Alert Action for w3wpvbscaller.bat with same permission as of file procDumpBatch.bat |
| 104200 | NetDiagnostics | Need to maximize the monitor UI to configure snmp monitors |
| 104433 | NetDiagnostics | Data is not coming for specific OID in SNMP monitor |
| 93077 | NetStorm | When extra inline urls are getting fetched while fetching inline, then transactions are getting timeout |
| 101218 | NetStorm | Redirection NOT Handled in case HTTP Response Code : 303 |
| 101977 | NetStorm | Getting core dump while trying to execute the test |
| 102099 | NetStorm | Dev Portal: While running Debug Test by selecting project Subproject Other than default ,then getting error in starting Test. |
| 102161 | NetStorm | Getting “Phase Default_RampDown is invalid” in case of Advanced FSR scenario with percentage distribution mode |
| 102289 | NetStorm | Security Concern | on making changes in jnlp username and urlcodebase to other non-authorized appliance user is able to access |
| 102291 | NetStorm | Dev Portal:-While switching tab from UI to raw then host header goes down and accept-encoding header comes up and it shows disabled. |
| 102360 | NetStorm | Dev Portal :-Facing random issues in Addition deletion operation in Parameterization |
| 102396 | NetStorm | Unable to add flows in runlogic and unable to create flow from UI for Java Type Script. |
| 102401 | NetStorm | Issue in getting graph after injecting havoc for Kubernetes |
| 102425 | NetStorm | Dev Portal :- “Project/SubProject hierarchy is not working properly. It is taking previous project and sub-project .(eg:-default/ASE/ASE) |
| 102476 | NetStorm | RBU || Script fails when new tab is opened on click action. |
| 102548 | NetStorm | NS:Script Management :- URL filters are getting deleted while reopening the “ScriptManager.exe” or while launching script manager . |
| 102672 | NetStorm | Not able to dispose the recorder browser by clicking on the close window/button |
| 102702 | NetStorm | Enhancement | Need to have add proxy settings in Simplified UI(Dev Portal) that we have in Expert mode. |
| 102777 | NetStorm | With filters taking lot of time to create scripts and sometimes got stuck |
| 102782 | NetStorm | Script Manager does not show the list parameter in replace parameter option. |
| 103019 | NetStorm | Recording is taking more than 25 mins in mac. |
| 103374 | NetStorm | Dev Portal || Getting more number of transaction details using “select script” option |
| 103739 | NetStorm | NTLM Authentication Failing while Replaying script |
| 104022 | NetStorm | NetHavoc|error is coming while applying memory outlay havoc. |
| 104755 | NetStorm | Not able to get the oracle db monitor data on GUI as host_IP is not passed with -h/–host option |
| 105064 | NetStorm | Proxy authentication credential should be configured in scenario in case of RBU also. |
| 105072 | NetStorm | JSProfiler is not opening in Chrome Browser |
| 105213 | NetStorm | Seeing distorted test results on Netstorm Simplified UI | 66.220.31.142 |
| 99374 | NetVision | NV – ECOMM | Parsers updating very slow due to large amount of data in db tables |
| 102037 | NetVision | NV – Ecomm | Getting incorrect Browser name |
| 102258 | NetVision | Getting too high trend of Active Sessions |
| 102607 | NetVision | Getting very Less Data in Event Stats Graph |
| 102706 | NetVision | Observing huge count of sessions comprising localhost IP(127.0.0.1) |
| 103706 | NetVision | Event icons placement are not proper in NV Replay window |
| 101270 | TestSuite | Getting Issue While Generating Report for Jenkins Job |
| 104608 | TestSuite | Need To Automate Jenkins Pipeline Script Changes By HPI Internally |