Release 4.10.0 is intended for a major revamp of Cavisson products in a new unified interface. This document provides information about the new Unified Dashboard, enhancements, and performance improvements in Cavisson products. The NetStorm and NetOcean UI have undergone a major revamp and are now seamlessly integrated with the monitoring suites.
New and Enhanced Features
Common UI
This section lists all the common features for all/some products.
Dashboard
Auto-Schedule
Auto Scheduling is required for the jobs which need to be scheduled automatically as per bundled configuration. This enhancement covers the requirements related to auto-scheduling certain reports so that some key reports start generating and get shared over the mail to a pre-configured mailing list.
Auto scheduling of reports works for the following types of reports
- Stats-based reports
- Including bundled template-based reports.
- And bundled favorite-based reports.
- Excel-based report
Auto scheduling should start working on build upgrades, with no/minimal human intervention.
Single Graph Analysis Update
This enhancement shows single graph analysis through AIOPs Machine Learning(ML) Dashboard from UnifiedDashboard Window. Using this feature, the user can see the Incident Alerts, Anomalous Metrics, and Root Cause Analysis of servers. This feature also provides us with information about anomalies in metric graphs and their analysis (causes and effects).
Open Related Metrics using AIOPs
This enhancement covers the requirement of Open Related Metrics using AIOPs in the Pattern Matching Window. Using this feature, we get all the related metrics corresponding to the baseline metric which is selected by the user. If the AIOPS server does not contain any effects and causes metrics, then we apply pattern matching using all the groups and graphs under the subject level of the baseline metric. It will hit the AIOPs server to get the related metrics and will apply pattern matching with the default threshold i.e. 80%. After getting the response from the AIOPs server, we will be validating all the metrics and add proper subject tags for the related metrics.
For Example
- If the subject level of the baseline metric is T1 > S1 > P1 > BT and the graph is And AIOPs server provided the affected metrics which is CPU Utilization.
We will make a proper subject tag for CPU Utilization that is T1 > S1. - If the subject level of the baseline metric is T1 > S1 and the graph is CPU Utilization. And AIOPs server provided the affected metrics which is
We will make a proper subject tag for TPS that is T1 > S1 > * > *.
If AIOPs do not provide any related metrics, then we will apply pattern matching using all the groups and graphs that are present in the hierarchy or subject level of baseline me tri.
For Example:
- If the subject level of the baseline metric is T1 > S1, then we will consider all the groups and graphs that are present in T1 and T1 >S1.
- If the subject level of the baseline metric is T1 > S1 > P1, then we will consider all the groups and graphs that are present in T1, T1 >S1, and T1 > S1 > P1.
Dashboard Template Layout Option for Auto Scaling
This enhancement covers the requirement of the Auto Scaling Dashboard Template in the Report. Using this feature, we can see the scaling of the graph in the report as a Dashboard Template. Auto-scaling Dashboard Template shows report with metrics replication. This feature provides greater metrics visibility based on the same available hierarchy in the metrics tree. Users can generate Report Using Favorites that contain a Dashboard Template.
Excel Report Preset Wise
Using this feature user can see the Excel report with a test run live preset. Earlier, if the “override preset from Template” option was enabled then an Excel report was generated-based on the formula time present in the formula sheet. Excel reports are generated on custom time present in the formula sheet. If the “override preset from Template” option is disabled, then it will take time from the UI. It may be preset or custom time based on user requirements. In this, we are generating an Excel report with the preset option present in the formula sheet. if the “override preset from Template” option is enabled from the UI.
Data widget can be used as a System health widget
As per the requirement, now the data widget can be used as a System health widget. For this, first, open an NS machine. Go to Load test>>Create Scenario >> Run Test >>Open Widget Setting >>Widget Type. The System Health widget is designed to help a systems administrator to monitor the components of the system.
All Services of tree operations are getting data in a compressed format
Some of the Web Dashboard tree data services were not getting data in compressed format. Data in compressed format is needed for preventing network delay and saving downloading time. As per the new UI, data is now available in compressed form.
Changes in the Data widget with merging of the Health widget into it
The trend graph is displayed beneath the data widget’s value. The widget’s measure for the chosen time period is displayed in the trend graph. The trend graph must be capable of zooming. If users zoomed in, the value ought to be adjusted to reflect that. The user can uncheck this box in advance if they do not want to view a trend graph with data.
Note: We are going to remove System Health Widget as we merged all its features to the Data widget. We need to support backward compatibility for health widgets and data widgets created and saved in favorites.
Support Honeycomb Chart
Honeycomb can be used to show the entire infrastructure health of an organization by showing a host/application/service as a single entity. Honeycomb can be grouped by host, application, service wise i.e. one stack of honeycomb will represent all the servers. Extremely useful in identifying anomalous entities by providing a bird eye’s view of your application ecosystem. A new chart type is added to HoneyComb. In this chart type pentagon for 1st and second level subjects is shown.
Show metric in tree
This enhancement covers the requirement to add a feature that shows metrics in a tree. Using this, the user can find and highlight metrics in a tree that is present in the widget. If there are multiple metrics on the widget, then only the selected metric will be highlighted.
Support of multi cluster in multi dc environment.
Users now have the option to add cluster members, in a cluster, by specifying the IP & Port information of other servers instead of adding cluster members one by one. This enhancement is done to ensure ease of configuration by removing manual efforts in defining cluster members.
Support of Group widget in the dashboard.
Users can now group multiple widgets within a single container to easily analyze multiple metrics from a single pane. Extremely helpful when you have a diverse set of metrics that need to be grouped within a dashboard for identifying issues. Users will benefit by not creating multiple dashboards for different metrics and instead having a single point of information.
Support of the group widget is now available in the dashboard but with the following limitation
- Users cannot add a group widget inside the group widget.
- Auto-fit widgets are not there while maximizing the group widget.
Run Command
All features of Run Command in the old UI are added in the new UI with the required necessary changes. . You can now execute commands remotely via the UI without the need to specifically logging into the target server/instance.
- All features of the previous product version(s) like tree operations, derived graphs, Canvas modes, flowpath report, Frequency Tag, Widget Settings, Command Output Layout etc. are integrated into New UI with necessary changes.
- Earlier there were performance issues handling in scaling/ dynamic environment as there was continuous GDF change. Now as the data are available from TSDB, and not GDF, there is no performance issue anymore.
- Baseline data which was earlier not available is now showing.
- Dark Mode Support – Dark mode is now supported in the product UI. You can switch to dark mode by enabling the dark/light mode option by clicking the icon in the top right corner of the homepage.
Monitors
Enhancements in Monitors
- LPS Module Masking Enhancement
Trace logs are implemented in LPS with 4 levels. There are no module-level logs in LPS. If a user wants to set trace level 4 for access log monitors, that is not supported. Earlier when we enabled trace log, it gets enabled for all the modules. Due to that, lots of trace logs are generated and it’s hard to diagnose the trace log as all of the LPS modules write their own trace log in one file. Now a new function is added which will enable logging of only specified monitors, the default will be level 1 (error logs).
- All Server option while applying Network Delay Monitor
While applying Network Delay Monitor, there was no option for “All server of specified Tier” in the server type. Now new option “All Server” is added in the dropdown for NetworkDelayEx monitor.
- Remove few graphs from Monitor Stats monitor
Graphs are removed from following monitor stats technology:
1. Duplicate Vectors Count/Min
2. RTG Packet Size (Bytes)
3. GDF Count In Current Partition
4. RTG Packet Timestamp
5. Progress Report Delay
- Support of <1 Sec Frequency> feature in CavWMON is available now.
- DB Query Stats: In DB QUERY STATS while running SQL statements, there is a highlight that indicates which query is executing. This enhancement only works for PostgreSQL, MySQL, MSSQL, and MongoDB. It does not work for Oracle DB due to the unavailability of the environment.
- Now TextArea is supported in Generic UI after committing the updated json in kubePrometheus.json.
- Download Configuration button is now added in Cavisson Infra Monitoring.
- ApiGateway frontend and backend monitor are now added in CavissonInframonitoring and handled in code from core sides.
- Support for Custom Specific Server in Generic Driven Json UI is now available
When user selects a specified server option, there is a provision to add a custom specified server. When an icon is displayed, the textfield will be shown in UI. Users have text-field to add custom specified server names in case the server is not listed. Custom server can be comma-separated values in the format: DisplayName1(Server 1_IP), DisplayName2(Server 2_IP) … and so on. In Service Virtualization Cavisson Infra monitoring UI, we have server dropdown which will have server list from Cavisson Agent and an icon to add custom server. When the user will click that icon a text field is shown in UI where user can provide comma separated values.
Earlier we replaced parameter support only for vectors and data creation json path. But there were some cases where we need parameter support for URLs also.For eg- We have a Grafana application monitor where we need such functionality.
As Dependent URL and replaceParam feature was already present in GenericRestEx So, we only needed to fetch Replaced Parameter list from the First independent Url and replaced the parameters in dependent Url. To achieve this, Cmon creates a parameter file at its custom path (which is /home/cavisson/monitors/custom/parameters) and replaced parameter list is be appended in the file in JSON format only.
User provides the parameter file name and its content through monitor UI.Performance Suite
New Features Added in Load Test
ns_user_data_point API
The ns_user_data_point function allows you to record your data for analysis. User have to pass ‘Name’ and ‘value’ to this API. The name should have text characters except the special characters (” ‘ % * , < > ` ~ \ ^ | #). If any binary or any of these special characters are used, then these characters will be replaced by _(underscore). The maximum length is 1024 bytes. If it exceeds this length, then it will truncate. If the length is 0 then Name will replace by NameWithZeroLength. You can see the Data Point graph in Topology>Subjects>TestMetrics>PerfTest>Subjects>UserData metrics to analyze the results.
The graph is typically used in cases where the actual value of the measurement is required. If like the user wants to record the response body size, then he can use ns_url_get_body_size () to get the response of the main url and pass the value to ns_user_data_point API as shown below.
Enhancements in Load Test
Scheduler Management
- Option to enable scheduler from GUI is available now. Earlier user needs to add kw ‘”enableScheduler”: true’ in file ‘system.json’ at path $NS_WDIR/nodeapps/IntegratedNodeServer/conf and then start scheduler, but now the option to enable scheduler is available.
To enable scheduler settings, follow the below-mentioned steps:
- Configuration Setting (top menu) -> Configuration -> Settings -> Cluster.
- User needs to update the settings for the master node. Then click on Advance settings, and check “More Options”. There the user can find the “Scheduler” option. On updating, settings will be saved.
Enhancements
- Compare Report
This enhancement used to compare two or more scripts. In compare reports, NDE test runs can now be chosen to be compared with other test runs via the Test Run (TR) dropdown list.
Script Management
- Web-based Script Manager User Interface is now available
Earlier, users had to download JNLP files, and the script manager also required a certain version of Java. However, the script manager is now web-based and is not JAVA dependent. The UI itself allows users to manage every script.
- java is now removed from Java TypeScript. Now we do not need to implement NS in our script.
RBU
· Lighthouse Average Report-Earlier user could see the lighthouse average report data for NVSM tests only, now the same option is available for RBU-type tests. We can open the lighthouse report from My Library -> Reports -> Ready Reports. · Global Configuration-For Host Statics, Request Statistics, and Content-Type Statistics table now we have a Global filter and download report option respectively which were previously not available. · We have provided a scroll bar for Recommendations for unnecessary header box as pagination is not possible for a panel. We have also applied a scroll bar on the table if the table has more number of data.
- Download Option-The option to download PDF and Word in page detail reports is available. For this we have the following steps: –
o Login to NS UI.o Create a NS scenario and run RBU test. o Go to Page Average Report –> Page Detail Report then click on the download option.
Alerts
· Earlier Multiple Alert Managers were running on the machine. The reason, why this process was running is due to whenever there was an upgrade build, these alert managers automatically Auto start. If you don’t have a Unified dashboard, then Alert Manager shouldn’t run in the background. As per new release, this issue is resolved now and the Alert Managers are not running.
Test Suite
CSAA | POC Jenkins || Need Support Netstorm Jenkins plugin handle all G_SERVER_HOST cases
Previously the given value of the actual server in Jenkins was overriding all the G_Server_Host keyword actual server with the same server IP. Now, we can pass different actual server values for different G_SERVER_HOST keyword.
We can parameterize G_SERVER_HOST keyword of the scenario from Jenkins UI. According to the current design, we add the server host parameter from NetStorm Test Parameter List in Jenkins job and while building the job, we give the value of the actual server. When clicked on build, api will be called on configured NS machine, which will replace the actual server value in scenario G_SERVER_HOST keyword and then trigger NS test.
If there are multiple G_SERVER_HOST keyword inside the scenario, then all keyword’s actual server value will be replaced by the same value coming from Jenkins.
Now, you can select the server/host parameter name from Netstorm Test parameter in Jenkins job. Name of the parameter must be in this format: – Recorded_Server – <recorded server IP>.
By this, we can identify on which G_SERVER_HOST keyword actual server needs to be replaced.
NetHavoc
Enhancements in NetHavoc
· Graph Icon Issue– When we inject havoc through SSH there is no graph present but Graph icon is visible which confuses users that Graph is present for the injected Havoc. Now Graph icon is not visible while injecting Havoc through SSH as per the latest release 4.10.0. Similarly, for other havocs also if the graph is not there, the graph icon is not visible.
- Close the Havoc details – Earlier when the cross (x) icon was clicked, the havoc details got closed. Rather than specifically clicking on the cross, now it disappears when we click anywhere on the screen.
- Copy-Paste functionality of input fields is dropped for all havoc types except special input fields of Terminates Cloud Instance and Abort Application havoc type. Dropping of this functionality is required for the following reasons:
o To avoid the use of arbitrary characters/data in fields leading to an unnecessary outcome.o To prevent users from using characters/data which are not allowed in certain fields. For instance, like the user copies alphabets and pastes them in the ‘CPU Cores’ field.o A preventive action against core dumps due to user’s ignorance.Note: This is required for all input fields available in NetHavoc except the special fields of AWS, Azure, and GCP of Terminates Cloud Instance havoc type and the ‘Process Entry’ field of Abort Application havoc type.
- When there is no havoc injected, then the Report UI is coming with a yellow triangle and the message shown inside the report UI is “No Havoc injected in selected Time Period!”
- Duration Change: In Inject Havoc Page, the default value of Duration is now changed from 1m to 5m.
- Fields enabled during Havoc Reapply: Earlier when we were going to NETHAVOC > INJECT HAVOC > Linux or any other platform, applying havoc and then clicking the reapply button after selecting the Havoc report, most of the fields were disabled. Now in the case of Reapply, all fields remain enabled with no exception for all the havoc of all categories.
Service Virtualization
Enhancements in Service Virtualization
· Particular Service trace: Earlier when we were accessing Dashboard -> NoAppliance ->Services ->Request Failure %, we observed that a complete trace was coming instead of a Particular trace. As per the Enhancement, only the particular service trace is now opening while clicking on Request Trace from drill down in Dashboard.· Changes in Request TraceRequest Trace is a log for request and response that you capture for services. Clear Logs option should be enabled only for Admin privileged users.
This menu consists of two menu items:
- Request Trace
- JMS Message
· Save option for KAFKA in JMS configuration UI– Earlier when we were selecting Kafka to add JMS configuration UI, there was no option to save the configuration. Now the Save option should be available for KAFKA in JMS configuration UI.· Support of Json file type services in RR Pair Services is available now.
- Header Info support is now available in RR Pair Services.
- User is now able to provide customized Keywords in api-gateway. It is mandatory to Provide Default keywords. We can change the argument in the Keywords i.e [Keyword][Arguments].
- Earlier the recording was only supported on Admin workspace and default profile. Now Socket and HTTP recording is supported on the basis of active profile and workspace.
NetCloud
Enhancements in NetCloud
· Earlier we unchecked the master check box of all locations in the select location table in scenario UI, the value we assign to the locations doesn’t get removed. Now, when the header checkbox is unchecked then, the distribution percentage of all locations resets to 0.
- Account Summary Report Support
Account test run usage report or Account Summary Report is a report which describes the total usage of the product including the number of test runs, time of the test run, and number of maximum virtual users. The test will run as per the type of license a user has. The account usage report has the following fields:
- Client Name: In the client name, it will show the name of the client who is using the product.
- License balance: The user can have one of the below license types according to which the total purchased and remaining license will be shown:
- Page views/min
- Transaction
- VUH
- Unlimited
- Total Page Views/Min: This will show the total number of pages which are viewed by the user per minute.
- Remaining Page Views/Min: This will show the total number of remaining pages which are left to be viewed by the user per minutes.
- Total Test Run: This will show the total number of tests which are have being run.
- License Period: This will show the start and end time for the license purchased. The license can be purchased either: Monthly, Quarterly or Yearly. The license period will be according to the server time zone.
Note: In the license period, it will also show the expiry of the license in days.
- Group by: Group by helps the user to filter out and see the test run results for the following option –
- Daily: It will show the test results on daily basis.
- Weekly: It will show the test results on a weekly basis.
- Monthly: It will show the test results on a monthly basis.
- Yearly: It will show the test results on a yearly basis.
- Billing Cycle: It will show the test results on a billing cycle basis.
Note: The data fetched for all test runs is fetched from the Central Repository. Here, the user can download the report only in Excel format.
Monitoring Suite
NetDiagnostics
DotNet Agent
- By default “enableProcessNotificationPhase” keyword is enabled for DotNet Agent. Now default value of the keyword enableProcessNotificationPhase is changed from 0 to 1.
Application topology is discovered automatically by ED based on input provided by NDP & agent instead of configuring it manually by mapping the backend name to the corresponding tier name as done previously.
The steps required to discover application topology are covered below: –
- Application agent to dump mapping of source to destination tier information for each integration point name discovered in a new record in raw data (topology discovery record).
- Agent to send its tier/server/instance and backend name information to the next tier downstream in a custom header of outgoing HTTP and messaging (JMS etc) calls.
- Agent in the next tier to extract previous tier and back-end name information for incoming calls (only Http and Messaging protocol) and dump mapping of source to destination tier names for all backend names.
- NDP to process new records for topology discovery in raw data and stores mapping of source to destination tier names for back end in some in-memory data structures.
- NDP to generate new IntegrationProperties.json file on disk containing mapping of source to destination tier names for each backend.
- ED to use the new IntegrationProperties.json file to find out the mapping between back end name and next tier name in order to generate topology automatically.
PHP Agent
Following features are enhanced in PHP agent:
- Support Given for WSS in PHP Agent, Its working fine on (u16, u20, centos).
- Support for memcached in php agent is provided and supported entry points are as follows:
o Memcached.geto Memcached.addo Memcached.getMultio Memcached.deleteo Memcached.replace
- Support of oracle database is provided in phpAgent. The EntryPoints is oci_parse.
- Support given for exception monitor in php agent.
Exception monitor feature is now supported in php agent and this is dumping in aggregate raw_data. It is also coming for all PHP versions.
- Support given for Cakephp, Laravel, Codeigniter, symfony, WordPress.
BCI Agent
- Support for AWS Lambda function in Java agent. Support for the AWS Lambda function is now available in Java agent. AWS Lambda is a serverless compute service that runs your code in response to events and automatically manages the underlying compute resources for you. Application Performance Monitoring (ServerlessAPM) for AWS Lambda gives you visibility into the performance of your application’s components that run as functions on serverless compute environments.
- Support for JDK version 13 and higher – Earlier java versions greater than 12 were not working. Now after the support of ASM9 this issue is resolved. It supports Java versions upto 16.
- Capture mongoDB callout in case of Tomcat and ALert Manager)
ND is now enabled in Cavisson UI and ALert manager. As per the design, both Applications
have MongoDB calls. But in Raw_data as well as in monitor data, it’s not getting captured.
NetForest
NetForest is the next generation log monitoring and analysis software that makes use of server logs to troubleshoot performance issues and understand user behavior.
NetForest Enhancements
- Official build for NF-curator is now available.
- Tag and attributes support
Tags and attributes are two different things, in which Tags are labels which used for organizing entities metrics data time series, and attributes are key/value pair which used for defining extra information for entities.
Tags and Attributes Syntax: –
Tags=”key=<value>,key=<value>”
Attributes=”key=<value>,key=<value>”
value will be as following: –
tags and attributes will be added in document as like,
“tags” : {
“MIN_SLEEP”: “20”,
“UPPER_LIMIT”:”3600”
},
“attributes” : {
“Tier”:”tier”,
“Env”:”env
}
- NetForest | NFDB | Loki Support for MVCOMBINE Construct, NOMV Construct and MVEXPAND Construct
- MVCombine Construct: This construct is used to group multiple events, which are identical except for the specified field, which contains a single value. The resultant of this operation is a single event in which a specified field becomes a multi-value field.
Syntax:
…|mvcombine <field_name>
- NOMV Construct: This construct is used to convert multivalue field into single value field.
Syntax:
…|nomv
<field_name>
Here <field_name> is a field, which is required to convert into single value.
- Mvexpand Construct: This construct is used to expand values of a multi-value field into separate events, such that the result contains one event for each value in the multi-value field.
Syntax:
…|mvexpand <field_name>
- Support for create log metric monitor by selecting strings from logs
This feature helps to create a log metric monitor from Logs screen by selecting some string/text from message or any other fields. User selects some value/text from any fields and one popup menu opens for Log Monitor. User clicks on the Log Monitor menu and it redirects to log metric monitor configuration screen and it displays selected screen on the query box.
- Single maxdoc endpoint for all nfdb requests
With this feature all the nfdb requests will be handled by a single endpoint making nfdb more flexible and reducing confusion regarding which endpoint to use for certain request. Before this enhancement two endpoints were being used, one for processing 10,000 documents and other one to process greater than 10,000 documents.
- Implementation of aggregation Log Display for maxdoc flow
Display unique logs to users, so the user can easily see the last unique logs with their similar log count value or he can see similar logs for the particular unique log key as well. Until now this feature was implemented for msearch requests only. But now it can be used with maxdocs and large datasets also.
- Priority based reading of environment variables from different files in nfforwarder
In windows, it reads the value of environment variables from the system environment and some other environment files in a set order of priority.
That is the value of a field will be taken from a higher-priority file instead of a lower-priority file if that field is declared in both files.
This is the set order of priority -> system environment -> cmon.env -> jvm.options -> cmon.properties -> nf.env.
- Keyword for deciding the start position of logs in nf forwarder
This enhancement addresses the need to set a keyword which will decide the position as to where to read the logs from. If we are reading the logs from the beginning, then nfforwarder will read the logs from the beginning of the file, that is the first line. If it is to read the logs from the end, then it will only read the logs added into the file after the forwarder started running.
The keyword added here is “tail_files”
- If tail_files is true, then it reads the files from the end.
- If tail_files is false, then it reads the files from the beginning.
- Need keyword for sincedb_path in nf forwarded
This enhancement addresses the need to set a keyword that will decide where the registry file will be created. The registry file in nfforwrder is for the same purpose as since_db in NFAgent, which is to store the data regarding reading logs. It stores data about the last line where it stops reading logs and the file from which it was reading etc. With the help of this keyword, we can decide the place as to where the registry file will be created. Even if the directory given in the path does not exist, then also it will create a directory. The keyword added here is “REGISTRY_PATH”. This keyword is added in nf.env file. Although, it can also be read from the environment in an order of priority. If we give the absolute path to this field in nf.env(or in the environment), then the registry file will be created if it is not present. However, if this keyword is not present, then the registry file will be created at the default path of ${NF_HOME}/data/registry.
- Confusion matrix is now giving results when the model produces NaN result.
- An option for the user to change the cert file (certification file) in nfdb for Saas registration is now available.
- Searched items are getting highlighted now in documents.
- Saved search is now opening from the Logs section.
Synthetic Monitoring
- When we changed the theme to black color theme, then the scale values representation is in white or something else.
NetVision
NetVision is a customer experience monitoring technology that records all visitors’ interaction with a website. NetVision consists of two parts:
- Session
- Funnel
New Features Added in NetVision
· Similar Session Search
In NetVision, we can search sessions applying various filters but many times users want a similar session and he/she wants to see a similar session for that purpose feature like similar search is required. A similar session means session having
- Similar Events
- Similar User Actions
- Similar Page Sequence or subsequence
There will be a default filter bag available in the session component. By default, that will be collapsed and on the user can expand that which will slide down all the filters. Filter bag is accessible throughout NetVision and different filter for searching similar sessions can be applied from different places in the application which are as follows:
- Pages from page list
- Events from events list tab
- User Action from User action tab
- User Action from Page dumb tab
Once filters are applied there will be button in filter bag to proceed for the similar session. search for the applied filters which are then process for the request and respond with similar session found.
Page and Resource Baseline
- AIOPs with automated RCA integrated
- Filtering spike
AIOps with automated RCA integrated with ND
Requirement is to add RCA in AI OPs.
- AI-OP will invoke the rest call of RCA for the given metric.
- Will store the RCA report as blob in postgres in a new column ‘report’.
Save RCA report in Postgres database.
- Need to make a change in rest call of NV RCA to integrate with AI-OP. AI-Op will pass time, metric and vector name from which page name can be fetched need by RCA rest call.
Issue: We do not have an end time for the alert. In AI -OPs, it is configurable, like +10, -2.
FILTERING SPIKE
Requirement:
When the total page view count is more than 1000 then we need to find a peak in that time duration and then the duration of peak time will be sent in the query to generate the RCA report. This is done so attention can be diverted to the area of the problem.
Suppose RCA report is generated for sample data for which the page view count is more than 1000 then the peak duration of sample data for a given metric is to be determined.
For the above duration we have to generate the sample data for RCA.
How to Find Peak Duration
Peak will be considered as a window with maximum area having high average values.
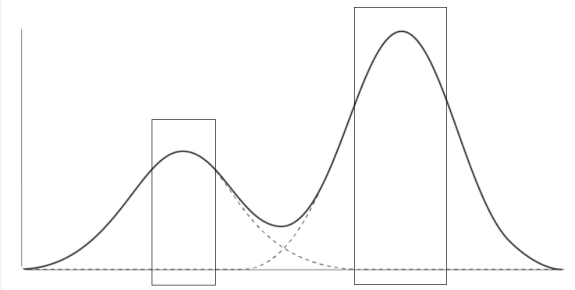
The second window with a higher value will be considered as the peak.
Sync Configuration Using MongoDB
Migration of existing configuration
- On hpd start, node migration_rum_config.js will run which will read rum.conf keywords.
- Node will first read the rum.conf keyword and categorize the keyword into node-specific and common keywords and convert it into json format.
- Node will read the client id from rum.conf keyword and create collection with name rum_cinfig_clientid and then connect with mongo db.
- It will read mongo db settings from MONGODB_SERVER from hpd.conf keyword.
- It will create the collection and copy node-specific keywords and common keywords into two separate documents in collection.
- In case of no cluster mode, if common document or node-specific document is not present, then it will assign id as -1 with common keywords and id =1 for node specific keyword and insert it in the collection.
- In case of cluster mode, common keywords will be added with id as -1 and node specific keywords will be added with slave id. (In new cluster mode, server which will be first up will be master and it will contain details of all the node specific and below-mentioned
- In case common document not present the add common document and add.
- If any error comes while db connection or any db operation (like insert/update), it should throw an error and HPD start should be aborted.
Agent Settings
- Currently, agent settings are loaded in table. Later on, we will migrate this agent setting into a document using Mongodb.
- Agent settings changes will be loaded in the document and if any part of the agent side will be changing, new config file will be generated which can further be updated using hpd_sp_rt_Debug.
User has to provide the entries in the system settings menu. After applying the button, the following message will determine if the changes have been applied successfully or not.
a) In case of non-cluster mode: Changes Applied Successfully
In case of cluster mode: Changes Applied on All nodes
b) When there is issue from HPD SIDE: Changes Not Applied Successfully with
HPD INTERNAL ERROR
c) If there is no response from HPD side within 30 seconds, then message TIME OUT Error will come.
NV Static URL RTC
OLD Approach
- Earlier RTC was implemented on modification of static file. By modifying any static file, hpd_sp_rt_debug can be run without restating the hpd.
- But in case of addition on new static file this mode will not work as many time in runtime we need profile or pages. And for that approach need to restart the hpd.
- So now with this feature, need not required to restart the hpd.
TEST CASES
- Run for new pages (Single)
- Run for modified pages (single)
- Run for new pages(Multiple)
- Run for modified pages (Multiple)
- Mixed test cases
- Same cases for https
- Test without changing anything and run sp_rt_debug
- No core dump should happen
Reset Filter
Reset Filter used to reset the applied filter in all the filter tabs: Session filter, Page filter, JS Error Filter, HTTP Filter, Transaction Filter, App Crash Filter, Feedback Filter, Page Performance Overview window, and Page Performance Detail.
Export as Test Case
This enhancement is used for exporting the sessions in JSP format and also used to see all the session details in recorded format.
Editable Filters
In an editable filter, user can choose the filters as per their requirement.
Auto Registration
- Currently when the HPD is restarted, it restarts the test too but as we are going to remove any product type, we need to check all the modules like ND, NV, and NVSM exits in one single controller. So, we can afford to restart the netstorm on Tomcat restart.
- We need to register all NV monitors using auto registration framework which we are already using for custom metric monitor and other health monitor.
Steps to follow for setup Cluster and Non-Cluster Mode
- First we have to deploy the build.
- Change the TR number which is in path >> home/cavisson/work/webapps/sys/config.ini.
- Now restart the hpd.
- Check whether the test is start or not using >> nsu_show_netstorm.
Limitation
There is no option for recovery in auto registration. In case if any monitor gets corrupted, then we have no permission to on or off the monitor now.
Impacted Module
- Dashboard
- Backend
Test Case
- Test all monitors in dashboard whether data is shown or not with non-cluster mode.
Enhancements in NetVision
- All NV monitors are now registered using the auto registration framework which we are already using for custom metric monitor and other health monitors.
- Enhancement in Custom Report
Now support of editable filters is added. The editable filters is shown in the filter sidebar of general/custom reports. Earlier we could add additional filter while defining ad hoc report but those filters were static. Now there is an option to mark a filter editable in custom report wizard. Editable filters is shown in General Report execution UI.
- Enhancement |Need GUI Support for User Experience Score in Netvision.
The UX score provides a single metric that combines performance analysis and error detection. The UX score serves two main purposes:
- Reporting and comparing user experiences.
- Improving applications so they can deliver better user experiences.
The User Experience (UX) score indicates the quality of user experience. UX score is calculated using performance factors that define the quality of a user session.
Categories of Sessions
We can categorize the recorded session in below 3 categories: –
- Frustrated
- Satisfied
- Tolerating
Combination of these three categories will then be applied to the recorded session flow to finally evaluate the UX Score.
Now, “Similar Session filter” bag icon is showing in session window and session detail window. Also “Add to Similar Session filter bag” icon is showing in page detail window.
- Page and Resource Baseline: Support of Page and Resource Baseline in LRM is available now.
- Following Missing keywords under UX settings are now updated.
- BLACKLIST_RESOURCE_DOMAIN_URL
- URL_GROUP
- Changes reflect in metadata rest calls while updating entries in UX CONFIG.
In the case of Cluster and Non-Cluster, changes are not reflected in metadata rest calls while updating entries in UX CONFIG. In the cluster, when we do the changes in metadata (UX CONFIG) from one node, then in another node metadata is not updating i.e old entries are showing. The requirement to reflect changes in metadata rest call in cluster setup has been updated in new release.
Criteria
- Status:Resolved, Built, Verified, Closed
- Target Milestone:9.0 and 4.10.0
- Severity:Blocker, Critical, Major
- Priority:All
- Resolution:Fixed
- Business Unit:Client / Presales
List of Bug Fixes
Bug ID | Product | Description |
120275 | Net Diagnostics | LRM|Active UI:-Colour of Critical,Major,Minor should be highlighted with same colour provided to their buttons. |
120934 | NetStorm | While doing drill down for individual transaction from dashboard it is showing all transactions in transaction summary report instead of specific transaction. |
120956 | NetVision | NV Session Play/Details options displays over leftmost panel of the Dashboard |
121494 | NetCloud | Not able to view page properly in master servers and master blades sections in angular NetCloud server management portal. |
121506 | NetCloud | Server list is not showing properly in the angular NetCloud server management portal. |
121788 | NetDiagnostics | Considering request & response file are not created in case of SSL Handshake Failure therefore We should not see option to view request & response.It should come like this “-” as it shows in case of con file |
121791 | NetStorm | RBU script fails with Misc Error |
121797 | NetCloud | Heading is not correct for some menus in new angular server management portal |
121799 | NetCloud | Need to correct the spelling in the menu for the new angular server management portal. |
122161 | NetStorm | Test status is coming running after stopping the test |
122381 | NetDiagnostics | First Sample is coming zero. |
122404 | NetDiagnostics | While opening HTTP Requests Failure(%) graph in Advance open/merge with specific operation it goes on loading |
122578 | NetDiagnostics | Dynatrace Monitor | Dynatrace Monitor data is not coming. |
123048 | NetCloud | Missing functionality in widget Settings |
123161 | NetDiagnostics | Unable to get data on MySQL monitors |
123235 | NetStorm | \r\n not working in Search parameter as extra “\” is added automatically while adding from GUI |
124424** | NetStorm | While making connection to SQL server using ODBC connections from NS getting exception |
124608 | NetVision | NV | After Disable the keyword “nv.replay.fetchURLFromRemoteServer” Resources are not fetching from the correct path for that pagedump is not coming properly in Replay Window |
124767 | NetHavoc | Connectivity loss of postgres port 5432 after injecting havoc through intersteller |
124850 | NetStorm | Presales| There should be Escape character in the registration.spec |
124923 | NetDiagnostics | Transaction names should come in same sequence in dashboard as coming in tree. |
125037 | NetCloud | Sorting not working for Transaction Breakdown Status Code |
125255 | NetDiagnostics | In NCDefault Favorite for Current Total Vusers metrices is showing as “data not available”. |
125419 | NetCloud | Dashboard showing incorrect data in transaction details with Auto View By |
125796 | NetDiagnostics | Incorrect Report Data as NAN value were not handled. |
126492** | NetDiagnostics | Compare Test Run || Compare Dashboard is not working and auto selection test run coming wrong. |
126174** | NetDiagnostics | LRM_MonUI | LogMonitors | When deleting LogMonitors it should also delete gdf from mongoDB |
126953** | NetStorm | NSDefault Dashboard | Tick coming with Normal status |
126954** | NetStorm | NSDefault Dashboard | Label Last is hidden behind trend line and also its font is too small |
126975** | NetStorm | NSDefault Dashboard | Label Last is hidden behind trend line and also its font is too small |
127191** | NetStorm | Script Recorder | 4.10.0 | Not able to record script getting error “Error : recorder instance not started” |
127280** | NetStorm | LRM | After applying Basic Performance header right keyword is not getting applied in scenario.conf |
127296** | NetStorm | 4.10.0 | Presales | Incorrect color selection |
**- It is the Bug ID related to 4.10.0.