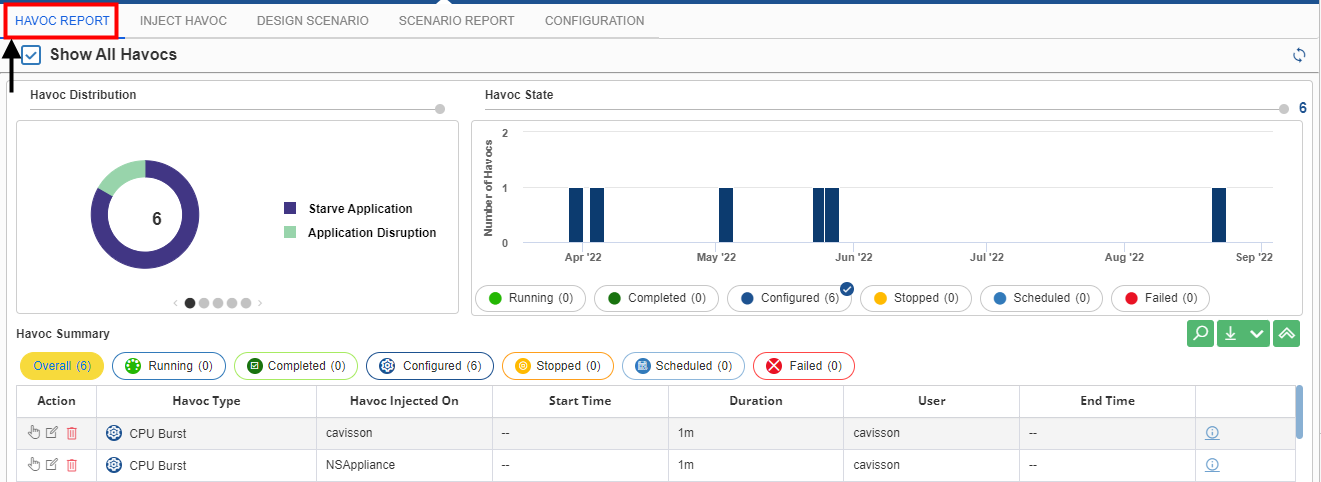
· While creating a havoc, when a user selects Dynamic as the Server Selection Mode and applies it, the havoc is displayed as a parent node instead of a general node in the Havoc Summary. Click the icon to view the child nodes. · For Dynamic server selection mode, the ‘End time’ is displayed in parent node along with child nodes, after the havoc is completed. · The user can apply, delete, or update a havoc from the Havoc Summary itself if the havoc is at Ready To Apply status. · The user can also stop a havoc from the Havoc Summary itself but only when the havoc is at Running status. · The ‘Mode’ column in the ‘Reports’ section under the ‘Overall’ tab displays the mode in which a fault was configured. There are two modes – UI and API. |
Download Reports
You can download reports by clicking ![]() . You get the option to download the report in PDF, Word, or Excel formats.
. You get the option to download the report in PDF, Word, or Excel formats.