Unable to Start NDCollector and throwing an error port already in use. Example: NDC_START_ERROR: NDC Collector is not started. Error in binding for listen socket (Port = 8587). IP Address and port is in use. Not able to listen on port 8587 |
| Possible Reasons #1 | 1. Same ndc port is configured in different controllers and ndc is already running in one controller.
2. Port is already in use. It is using by another process/service. |
| Steps to Diagnose | 1. Change the port and restart the ndc.
2. Stop the ndc of running controller and restart ndc of the required controller or either use different port for different controllers. |
| Commands to validate / Solution | 1. Check NDC port: netstat -nat | grep <ndc_port>
2. Check NDC: ps -ef | grep ndcollector | grep <controller_name> |
Unable to make control connection between agent and NDC |
| Possible Reasons #1 | Because of port is in firewall on application/server side |
| Steps to Diagnose | Enable the port on firewall on application/server side |
| Commands to validate / Solution | To check port in firewall or not : telnet <host> and <port> |
| Possible Reasons #2 | NDC not running |
| Steps to Diagnose | Start the NDC |
| Commands to validate / Solution | To start NDC :
For ‘work’ controller -/etc/init.d/ndc start For other controllers – /etc/init.d/ndc_controller name start |
| Possible Reasons #3 | ND Agent is not installed on Application/Server side
Agent arguments are not passed or agent not installed properly |
| Steps to Diagnose | Need to check agent arguments passing correct or not. Use below ND java agent arguments -javaagent:/home/cavisson/netdiagnostics/lib/ndmain.jar=time, ndAgentJar=/home/cavisson/netdiagnostics/lib/ndagent-with-dep.jar, ndHome=/home/cavisson/netdiagnostics,agentId=1 |
| Commands to validate / Solution | — |
| Possible Reasons #4 | Wrong Host and Port configured in cmon.env or ndsettings.conf on application/server side.
Path of cmon.env and ndsettings.conf is under cmon installation path or ND agent Installation path. End user should know these installaton paths. Example: Entries in cmon.env Controller = 10.10.30.34:7892 TIER=AppTier Entries in ndsettings.conf |
| Steps to Diagnose | Correct the Host and ndc port in cmon.env or ndsettings.conf file and restart cmon or application |
| Commands to validate / Solution | To check port in firewall or not : telnet <host> and <port> |
Unable to make control connection between agent and NDC |
| Possible Reasons #1 | Because of port is in firewall on application/server side |
| Steps to Diagnose | Enable the port on firewall on application/server side |
| Commands to validate / Solution | — |
| Possible Reasons #2 | NDC not running |
| Steps to Diagnose | Start the NDC |
| Commands to validate / Solution | To start ndc: /etc/init.d/ndc <stop|start|restart> |
| Possible Reasons #3 | ND Agent is not installed on Application/Server side
Agent arguments are not passed or agent not installed properly |
| Steps to Diagnose | Need to check agent arguments passing correct or not. Use below ND java agent arguments -javaagent:/home/cavisson/netdiagnostics/lib/ndmain.jar=time, ndAgentJar=/home/cavisson/netdiagnostics/lib/ndagent-with-dep.jar, ndHome=/home/cavisson/netdiagnostics,agentId=1 |
| Commands to validate / Solution | — |
| Possible Reasons #4 | Wrong Host and Port configured in cmon.env or ndsettings.conf on application/server side.
Path of cmon.env and ndsettings.conf is under cmon installation path or ND agent Installation path. End-user should know these installation paths. Example: Entries in cmon.env Controller = 10.10.30.34:7892 TIER=AppTier Entries in ndsettings.conf |
| Steps to Diagnose | Correct the Host and ndc port in cmon.env or ndsettings.conf file and restart cmon or application |
| Commands to validate / Solution | To check port in firewall or not : telnet <host> and <port> |
Unable to Start CM Test and getting topology related error Example: Topology is incorrect, please correct topology and re-run the test, error: Serverid 0 is reserved for NDAppliance Server. Please assign different id to NSAppliance Server. |
| Possible Reasons #1 | Wrong Topology is used in scenario |
| Steps to Diagnose | Correct the topology and restart the test |
| Commands to validate / Solution | — |
| Possible Reasons #2 | If topology name used correct, As per product type(like ND/NS), change the Server name in server.conf under $NS_WDIR/topology/<topology_name>/ |
| Steps to Diagnose | If product type is ND, correct the Server name to NDAppliance in Server.conf and restart the test |
| Commands to validate / Solution | — |
Unable to start CM test and getting error related to NDCollector. Example: CavErr[1031050]: Failed to connect to NDCollector server ip: 127.0.0.1, port: 8587 due to Unable to connection with Server ‘127.0.0.1’. SysErr(111): Connection refused |
| Possible Reasons #1 | 1. Check ndc is running or not.
2. Check which ndc port is used for Keyword “NET_DIAGNOSTICS_SERVER” in scenario. |
| Steps to Diagnose | 1. Start the NDC.
2. Change the ndc port to running ndc port in scenario file and start the test. |
| Commands to validate / Solution | 1. ps -ef | grep ndcollector | grep <controller_name>
2. /etc/init.d/ndc <start|stop|restart> |
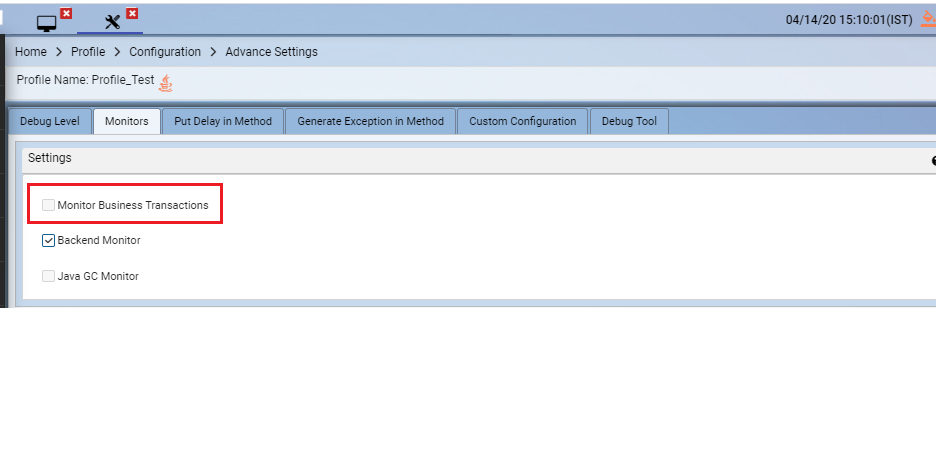
Unable to see “Business Transactions” group under “Application Metrics”
|
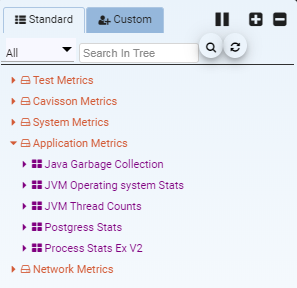
| Possible Reasons #1 | “Monitor Business Transactions” keyword is not enabled in NDConfigUI under profile
2. Proper Load is not generated” |
| Steps to Diagnose | 1. Enable the Keyword in ConfigUI to send it on runtime changes
2. Client should generate proper load to get data. |
| Commands to validate / Solution | — |
Business Transactions Metrics is discovered but Tier is not showing under this Metrics |
| Possible Reasons #1 | 1. Tier name is not configured in topology. 2. ND Agent is not installed on the application server. 3. If Tier is configured in topology, check the tier name in cmon.env or ndsettings.conf. 4. Load not present on the Tier |
| Steps to Diagnose | 1. Configure the Tier name in topology. 2. Install the NDAgent and restart the application 3. If wrong tier is configured, change the Tier name and restart cmon or application. Tier names are case sensitive. NOTE:- Always use auto-scaling to resolve this type of errors. 4. Client should generate proper load to get data for the require Tier. 5. If still facing the issue, Contact Cavisson Support Team. |
| Commands to validate / Solution | ps -ef | grep java | grep ndHome |
Not getting Configured “Business Transaction” data in “Business Transaction” Metrics for pattern based BT |
| Possible Reasons #1 | 1. Load not present on that particular Transaction
2. If load is present, request URL is also hitting in access.log but still data not coming then there is a issue with Configuration. 3. If configurations are correct, data coming in access.log but still BT data not coming then there is a issue with NDEntryPoints file. |
| Steps to Diagnose | 1. Generate proper load on that transaction. We can validate using access log whether this transaction hitting or not.
2. Check the configurations related to BT Rule. 3. Check the NDEntryPoints file is passing or not.If not pass it on runtime changes 4. Need to take tcpdump on autosensor port and provide this data to Cavisson Support Team so that we can further debug and provide solution |
| Commands to validate / Solution | Command to check port on which to take tcp dump. 1. in ndc_trace.log, please check for word “ndc_auto_sensor_connection” and check for the Server port. Use below example. grep “ndc_auto_sensor_connection” ndc_trace.log | grep “TierName/ServerIP” | tail -1 2. In ndc_trace.log, we can check message “start_intrumentation” with keyword “NDEntryPoint” to check EntryPoint file passing or not. grep “”start_instrumentation”” ndc_trace.log| grep “”NDEntryPoint”” path of ndc_trace.log: $NS_WDIR/logs/TRxxxx/partition/nd/logs/ndc_trace.log. 3. Take tcpdump on server port which comes in the output of an above command. tcpdump -w filename.pcap -i <interface> port <port_number> |
Not getting Tier details under “Thread Hotspot Stats” |
| Possible Reasons #1 | 1. Application/Service is not running
2. ND Agent is not installed on Application/Server side |
| Steps to Diagnose | Start the application along with NDAgent |
| Commands to validate / Solution | ps -ef | grep java | grep ndHome |
Not getting data for graphs under “Thread Hotspot Stats” |
| Possible Reasons #1 | 1. Threshold Configurations to capture Hotspot threads are not configured properly.
Example: “Threshold Sampling Interval” and “Consecutive matching samples to mark as Hotspot” is not configured as per application response time 2. Agent is not sending data |
| Steps to Diagnose | 1. “Threshold Sampling Interval” and “Consecutive matching samples to mark as Hotspot” these values should not be zero and these configuration values depends on response time of individual transaction response time. Default Values are 500ms for Threshold Sampling Interval and 5 for “Consecutive matching samples to mark as Hotspot” User can configure these Values form “Agent ConfigUI”. Path : Home –> Profile –> Configuration –> General –> Hotspot NOTE: If the default value are passing to capture thread HotSpot stats, then response time of Individual Transaction should be greater than or equal to 2500ms/2.5 Sec. In that case only data will come in most of the graphs 2. We can check through tcpdump using autosensor port data is coming or not like 52 record |
| Commands to validate / Solution | Command to check port on which to take tcp dump. In ndc_trace.log, please check for word “ndc_auto_sensor_connection” and check for the Server port. Use below example. grep “”ndc_auto_sensor_connection”” ndc_trace.log | grep “”TierName/ServerIP”” | tail -1take tcpdump on server port which comes in the output of the above command described.tcpdump -w filename.pcap -i port <port_number> |
Not getting “IntegrationPoint Stats” group under “Application Metrics”
|

| Possible Reasons #1 | “Backend Monitor” is not enabled in Profile
2. No Callouts are captured for any Tier. In that case IntegrationPoint Stats will not discover under Application Metrics because Application Does not have any Third Party Calls |
| Steps to Diagnose | 1.Enable “Backend Monitor” in Agent ConfigUI window Path : Home –> Profile –> Configuration –> Advance Settings –> Monitors 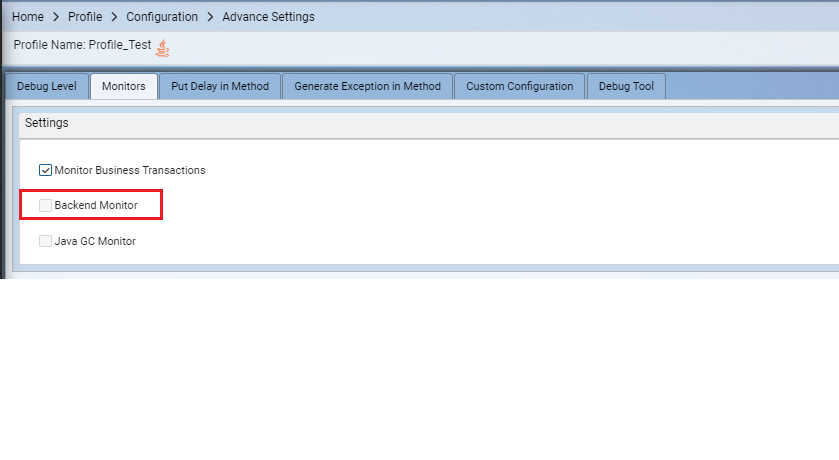 2. End User should have a knowledge about application behaviour 2. End User should have a knowledge about application behaviour |
| Commands to validate / Solution | — |
Not getting data for HTTP callouts under IntegrationPoint Stats |
| Possible Reasons #1 | 1. EntryPoints related to capture HTTP callouts are not configured/enabled
2. EntryPoint related to HTTP Callouts are enabled but still data is not coming |
| Steps to Diagnose | 1. Enable all the entypoints related to HTTP through ConfigUI Path : Home –> Profile –> Configuration –> Instrumentation Settings –> Integration Point –> Detection By Classes –> HTTP(Enable required EntryPoints) 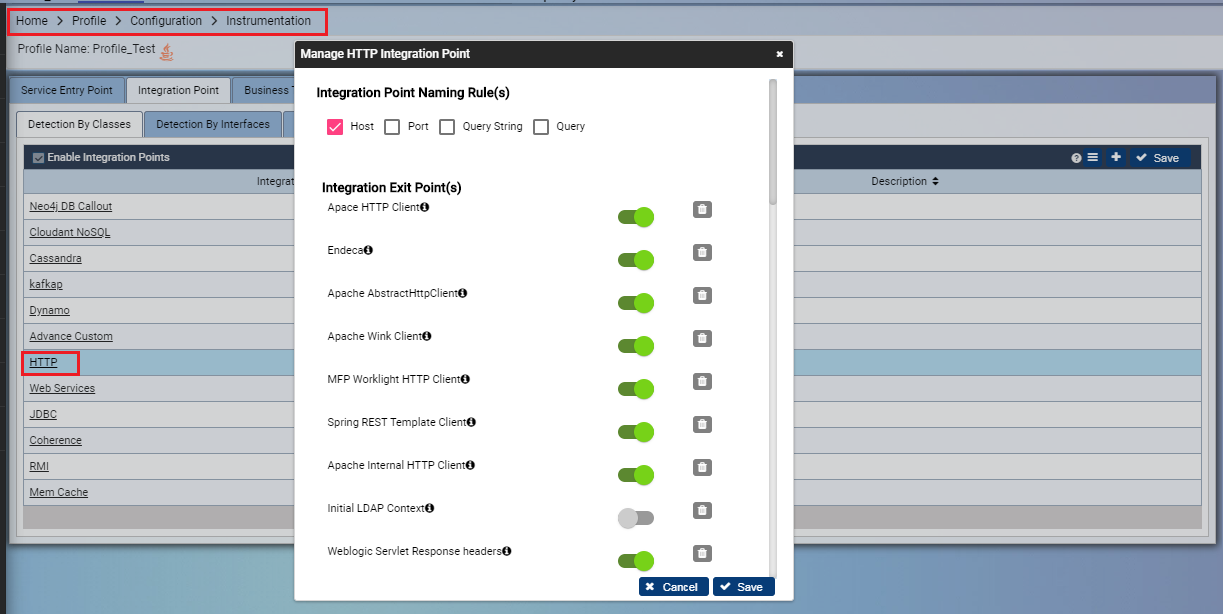 2. Contact Cavisson Support 2. Contact Cavisson Support |
| Commands to validate / Solution | — |
Not getting data for JDBC Callouts under IntegrationPoint Stats |
| Possible Reasons #1 | 1. EntryPoints related to capture JDBC callouts are not configured/enabled
2. EntryPoint related to JDBC Callouts are enabled but still data is not coming |
| Steps to Diagnose | 1. Enable all the entypoints related to JDBC through ConfigUI Path : Home –> Profile –> Configuration –> Instrumentation Settings –> Integration Point –> Detection By Classes –> JDBC(Enable required EntryPoints) 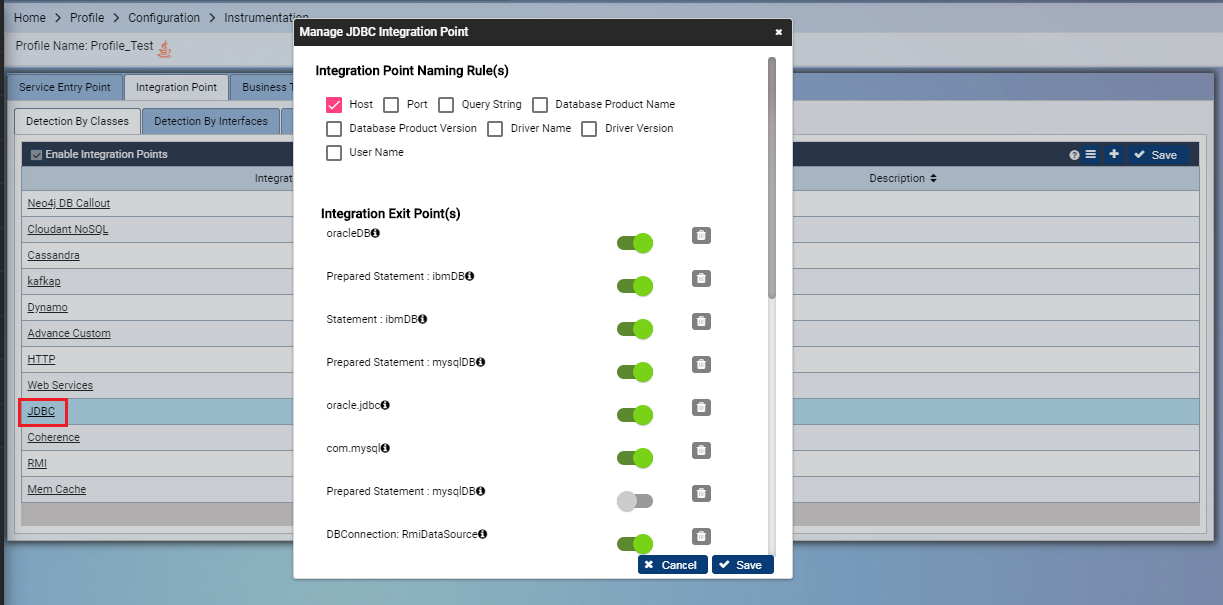 2. Contact Cavisson Support team 2. Contact Cavisson Support team |
| Commands to validate / Solution | — |
Not getting data for Redis Callouts under IntegrationPoint Stats |
| Possible Reasons #1 | 1. EntryPoints related to capture Redis callouts are not configured/enabled
2. EntryPoint related to Redis Callouts are enabled but still data is not coming |
| Steps to Diagnose | 1. Enable all the entypoints related to Redis through ConfigUI Path : Home –> Profile –> Configuration –> Instrumentation Settings –> Integration Point –> Detection By Classes –> Redis(Enable required EntryPoints) 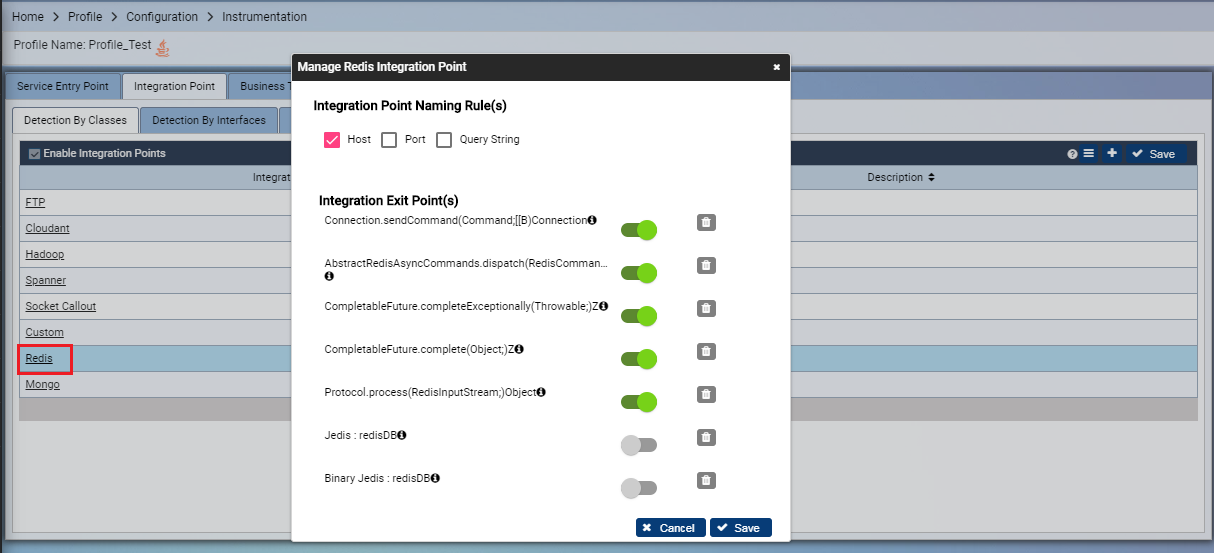 2. Contact Cavisson Support team 2. Contact Cavisson Support team |
| Commands to validate / Solution | — |
Not getting data for Mongo Callouts under IntegrationPoint Stats |
| Possible Reasons #1 | 1. EntryPoints related to capture Mongo callouts are not configured/enabled
2. EntryPoint related to Mongo Callouts are enabled but still data is not coming” |
| Steps to Diagnose | 1. Enable all the entypoints related to Mongo through ConfigUI Path : Home –> Profile –> Configuration –> Instrumentation Settings –> Integration Point –> Detection By Classes –> Mongo(Enable required EntryPoints) 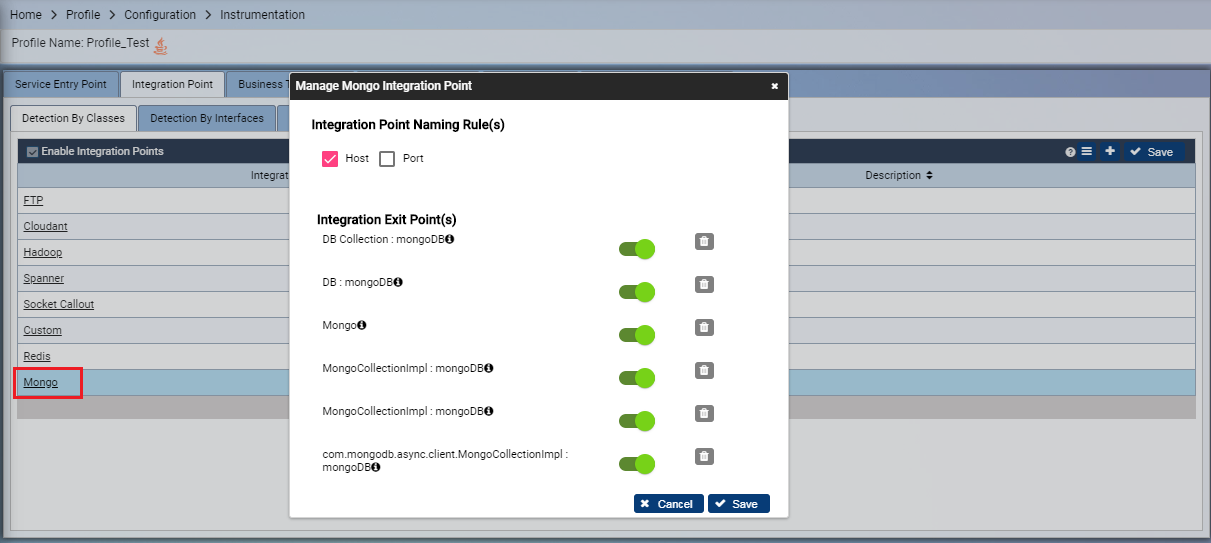 2. Contact Cavisson Support Team 2. Contact Cavisson Support Team |
| Commands to validate / Solution | — |
Not getting data for LDap Callouts under IntegrationPoint Stats |
| Possible Reasons #1 | 1. EntryPoints related to capture LDAP callouts are not configured/enabled
2. EntryPoint related to LDAP Callouts are enabled but still data is not coming |
| Steps to Diagnose | 1. Enable all the entypoints related to LDAP through ConfigUI Path : Home –> Profile –> Configuration –> Instrumentation Settings –> Integration Point –> Detection By Classes –> LDAP(Enable required EntryPoints)2.Contact Cavisson Support Team |
| Commands to validate / Solution | — |
Not getting data for Cassandra Callouts under IntegrationPoint Stats |
| Possible Reasons #1 | 1. EntryPoints related to capture Cassandra callouts are not configured/enabled
2. EntryPoint related to Cassandra Callouts are enabled but still data is not coming |
| Steps to Diagnose | 1. Enable all the entypoints related to Cassandra through ConfigUI Path : Home –> Profile –> Configuration –> Instrumentation Settings –> Integration Point –> Detection By Classes –> Cassandra(Enable required EntryPoints)2. Contact Cavisson Support Team |
| Commands to validate / Solution | — |
Not getting data for any IntegrationPoint stats even if the configurations are correct |
| Possible Reasons #1 | Related Entrypoints are not supported by Agent but we can enable it as a custom callout |
| Steps to Diagnose | Steps to Enable Custom Callouts 1. Take Multiple Thread Dumps while generating load 2. If the user have any idea about which method is responsible for that callout, check whether this method is coming in callout or not 3. If yes, they need to get a Fully Qualified Method(FQM) name for that. Use “ND Auto Discover” feature to get FQM. 4. Then go to ConfigUI Home –> Profile –> Configuration –> Instrumentation Settings –> Integration Point –> Detection By Classes 5. Click on New Integration Point Detection –> Select the Type –> Enter FQM–> Enable –> Save –> Again Click on Save(To Send on Runtime Changes)
|
| Commands to validate / Solution | — |

“No Records Found” Message is coming while opening Flowpath Report |
| Possible Reasons #1 | 1) ndc, ndp and ndudb uplaod not running.
2) Binary file of ndc, ndp and ndu_db_uplaod not present. |
| Steps to Diagnose | 1)Start the ndc. 1.1)ndp and ndu_db_upload not running contact cavisson support team2)Apply the bimary file for all three process i.e ndc,ndp and ndu_db_uploadPath of ndc binary: $NS_WDIR/ndc/bin/ndcCollector
Path of ndp binary: $NS_WDIR/bin/ndp Path of ndu_db_upload $NS_WDIR/bin/ndu_db_upload 3)If it is present and still ndp and ndu_uplaod not running then contact to cavisson support team |
| Commands to validate / Solution | 1.1)To check ndc running or not “”ps -ef | grep ndc”” or “”/etc/init.d/ndc show””1.2)To check ndp is running or not ps -ef | grep ndp
1.3)To check ndu_db_upload is running or not ps -ef | grep ndu_db_uplaod |
| Possible Reasons #2 | Load is present in BT but FP report still showing “no records found” in FP report , this may be because of instrumentation percent is not applied. |
| Steps to Diagnose | By default FP Percenatge will be 0.It should be greater than 0.
In “0” percentage slow and veryslow Category of FP will generate. To get he FP in normal category FP percentage should be greater then 0 percent. Path of Instrumentation percentage from ConfigUI. Home–>Profile–>configuration–>Flowpath |
| Commands to validate / Solution | — |
| Possible Reasons #3 | Percentage is correct still showing “no record found” in FP report then may be due to 2 and 4 record are not coming in rawdata. |
| Steps to Diagnose | 1. Load should be there to get 2 and 4 record.
path or rawdata file: $NS_WDIR/logs/TRNum/Partition/nd/rawdata 2) Contact to Cavisson client support. |
| Commands to validate / Solution | grep command to check 2 and 4 record grep “^2,” Tier_Server_Instance.txt. grep “^4,” Tier_Server_Instance.txt Example: 2 record: 2,4661487465766987980,198223460,7368,7368.1,2,/bea_wls_deployment_internal/ DeploymentService,,4661487465766987980,0,0,[ACTIVE] ExecuteThread: ’11’ for queue: ‘weblogic.kernel.Default (self-tuning)’,1,-1 4 record: 4,4661487465766987980,200,10,0,2,2,15_0_0_1_14_0_0_1_14_1_0_0___15_1_2_0___ The required field is for 2 record are: 2,FlowPathId,FlowpathTimeStamp,ThreadId,SeqNum,BTId,URLwithParameters, CorrelationIdHeader,NDSessionID,NVSessionID,NDPageID,ThreadName, FlowpathType,QueueTimeInMS The required filed for 4 record are: 4,FlowPathId,StatusCode,BTCategory,fpCPUTime,ResponseTime,BTId,Seq blob |
| Possible Reasons #4 | 2 and 4 record are present still not coming in FP Report then may be due to data not present under CSV under NDFlowpath.csv file. |
| Steps to Diagnose | path- $NS_WDIR/logs/TRNum/partition/nd/csv/Tier_server_instance/NDFlowpath.csv
2)If data is not present under csv then contact to cavisson client support team. |
| Commands to validate / Solution | — |
| Possible Reasons #5 | Data present under csv but not present in database for flowpath table. |
| Steps to Diagnose | 1) Check data is present or not for the flowpath table.Use below query.
Login to DB: psql test cavisson Query: select count(*) from flowpath_TRNum_partition Note: use neu_check_progress -n -o NDDBU command to check in which partition data is processing for Current running session 2) If data is not present under database then contact to cavisson client support team |
| Commands to validate / Solution | — |
| Possible Reasons #6 | No Records Found because of “Time Out Error” in Console for the request URL |
| Steps to Diagnose | Need to open Browser Inspect element and check any failures of request URL’s. If you are getting “”Failed”” for URL’s, then need to check “dcTimeOut” keyword value in config.ini. If the request URL is failed before the specified time, Contact Cavisson Support Team Path: $NS_WDIR/webapps/sys/config.ini |
| Commands to validate / Solution | — |
| Possible Reasons #7 | No Records Found because of error “version not present” |
| Steps to Diagnose | Need to check version file is present or not under partition.
If not then need to copy the version file from /etc/version. |
| Commands to validate / Solution | cp “version” /etc/version $NS_WDIR/logs/TRNum/parition |
Getting “No record found” in Http Report |
| Possible Reasons #1 | Keywords/Configurations related to Capture HTTP headers are not enabled . |
| Steps to Diagnose | From GUI: Select “Capture http request headers” and “Capture http response headers” are enabled or not under profile>configuration>Header .If not then please enable it.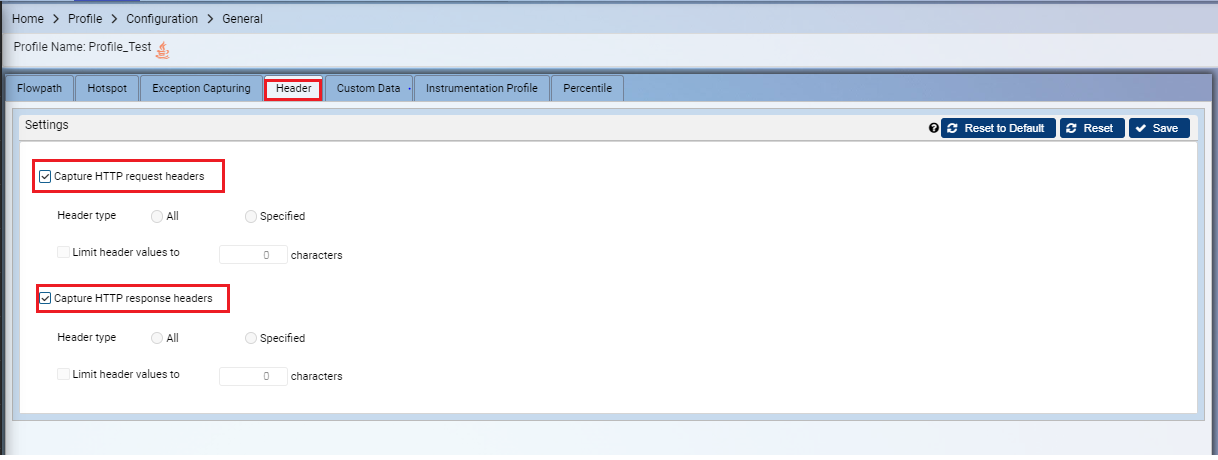 From Backend: Check “captureHTTPRespFullFp” and “captureHTTPReqFullFp” Keywords are present in ndsetting.txt or not under profile directory From Backend: Check “captureHTTPRespFullFp” and “captureHTTPReqFullFp” Keywords are present in ndsetting.txt or not under profile directory |
| Commands to validate / Solution | work$ grep “captureHTTPRespFullFp” ndprof/conf/profile_name/ndsettings.txt
work$ grep “captureHTTPReqFullFp” ndprof/conf/profile_name/ndsettings.txt grep “captureHTTPReqFullFp” $NS_WDIR/ndprof/conf/profile_name/ndsettings.txt grep “captureHTTPRespFullFp” $NS_WDIR/ndprof/conf/profile_name/ndsettings.txt |
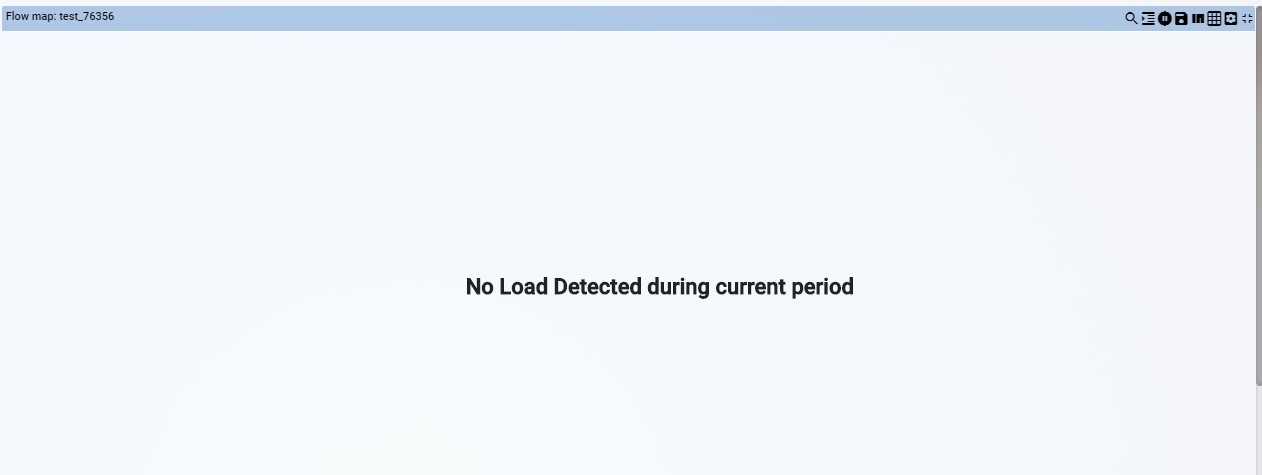
Application End to End View is not opening or opening blank by showing message “No Load Detected during current period”
|
| Possible Reasons #1 | Wrong configuration in “datacenterprop.ini” file.
Domain name is not present in /etc/hosts file. |
| Steps to Diagnose | Many time Data centre entry is missing or incorrect entry is made in “datacenterprop.ini” file ($NS_WDIR/webapps/sys). Example : #<Name>,<datacenter IP>,<NDE tomcat port>,<TR No.>,<Protocol> Account,10.206.96.101,443,222999,https:”
If you are using domain name to open machine from GUI, to open ED we have to specify this domain name along with IP in ‘/etc/hosts’ file. Example : 65.19.151.240 ncmon1.cavisson.com |
| Commands to validate / Solution | — |
In Transaction scorecard all data is showing 0. |
| Possible Reasons #1 | Data is not coming under “Business Transaction” group under “Application Metrics” in Web Dashboard |
| Steps to Diagnose | Check “Business Transactions” Module described in upper columns. |
| Commands to validate / Solution | — |
Wrong Session number is shown in Application End to End View. |
| Possible Reasons #1 | Check in config.ini file the testrun number
check testrun number in datacenterprop.ini file.Is it correct or not. |
| Steps to Diagnose | Check whether test run number in config.ini file on path /home/cavisson/controller/webapps/sys/config.ini
Check whether test run number in config.ini file on path /home/cavisson/controller/webapps/sys/datacenterprp.ini |
| Commands to validate / Solution | — |
Callouts are not showing in Application End to End View |
| Possible Reasons #1 | Data is not coming because of no load present
Previously data came but not coming for current time because of no load present |
| Steps to Diagnose | Check “IntegrationPoint Stats” module as CallOut data will fetch from this IntegrationPoint Stats
There is option to “”Show Integration Point with 0 calls””, if enable data will show for callouts Path :Edit Current Flowmap –> Enable “”Show Integration Point with 0 calls”” |
| Commands to validate / Solution | — |
“Getting only “”entry”” in Transaction flowmap | 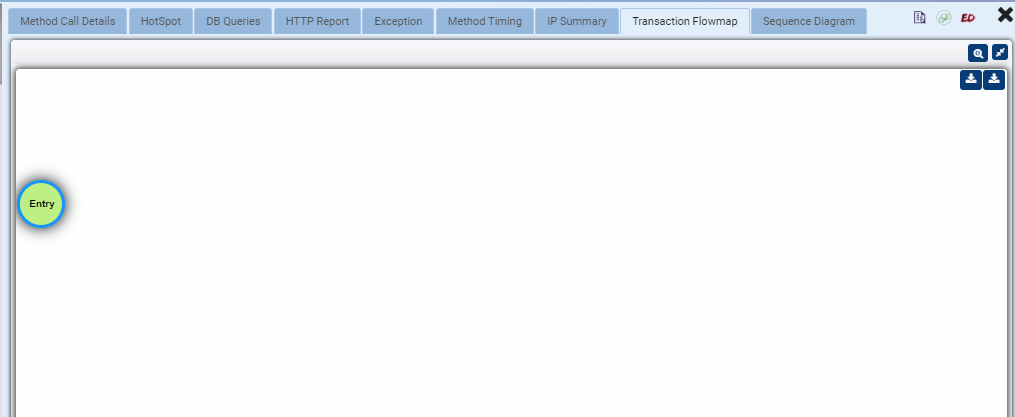 |
| Possible Reasons #1 | Due to Certificate Issue
Wrong configuration in MultiDc Configuration, NDE.csv file Path : $NS_WDIR/logs/TRxxxx/nd/csv |
| Steps to Diagnose | Check whether getting security error in console or not URL:-
http/https in NDE.csv depends upon the user configured on http or https. #CSM3_Blue,1,10.206.96.65,80,work,10.206.96.65,80,1,http |
| Commands to validate / Solution | Open Inspect element of browser(ctrl+shift+i) and check for “Security Enable”
|
Discontinuity of Flow in Transaction Flow(Incorrect Transaction Flow) between Tier Mapping with Other Tiers/Callouts |
| Possible Reasons #1 | One or More Flowpaths are missing |
| Steps to Diagnose | In this case, we have to check the “Caution Symbol” present at right most corner which give information related to some flowpaths(Parent/Child) because of configured instrumentation percentage. |
| Commands to validate / Solution | — |
Not able to get the URL in integration point |
| Possible Reasons #1 | Capture URL keyword is not enabled |
| Steps to Diagnose | “Check in Agent ConfigUI whether keyword is enabled or not under Integration Point detection Settings Path : Home –> Profile –> Configuration –> Instrumentation Settings –> Settings –> Capture URL 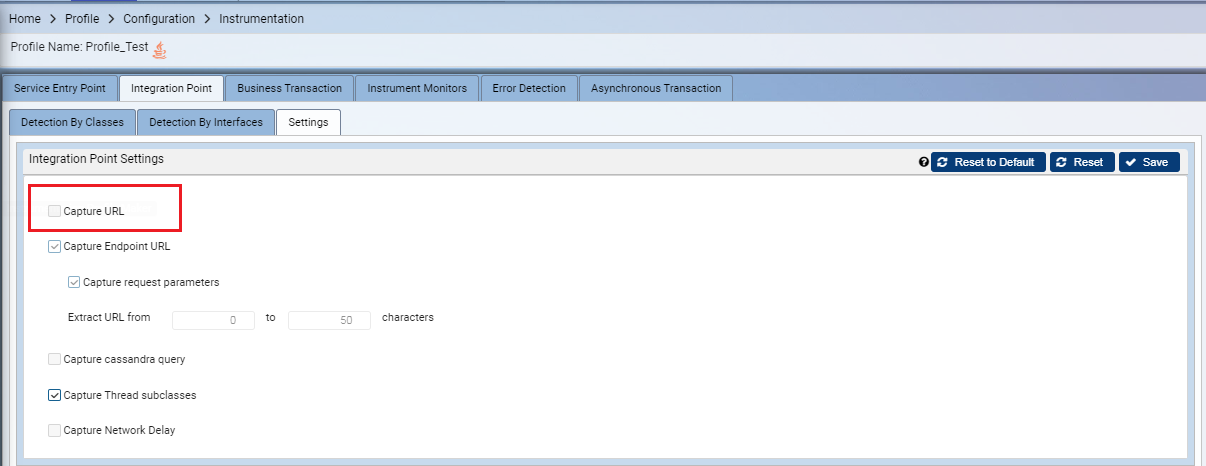 |
| Commands to validate / Solution | — |
Not getting Expected CallOuts in Transaction Flowmap |
| Possible Reasons #1 | No callouts are captured for these flowpaths or for this transaction |
| Steps to Diagnose | Client should have an idea whether callouts should present or not. If yes, Basic configurations related to Capture callouts are configured properly. See IntegrationPoints Stats Module for these details |
| Commands to validate / Solution | — |
Not getting “ND Method Stats” group under “Application Metrics” |
| Possible Reasons #1 | “”Enable Method Monitors”” option is not enabled in Agent ConfigUI. |
| Steps to Diagnose | Enable “”Enable Method Monitors”” should enable in Agent ConfigUI Path: Home–>profile–>Configuration–>Instrumentation Settings–>Instrument Monitors–>Enable Method Monitor 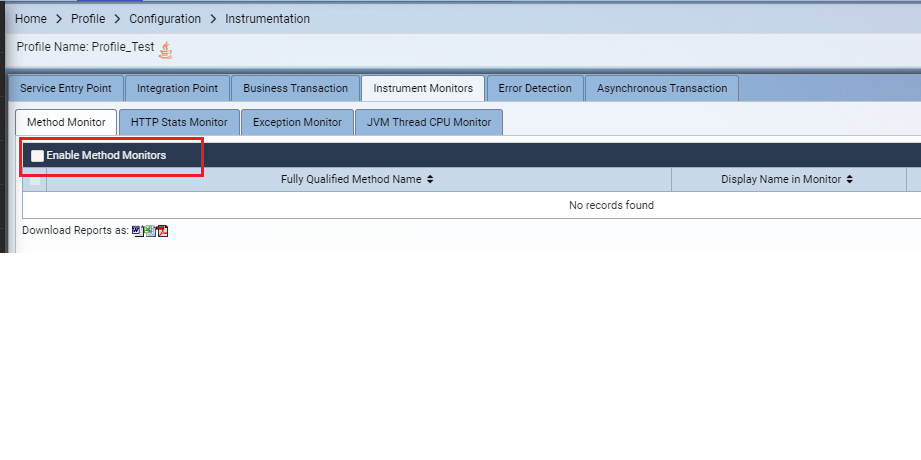
|
| Commands to validate / Solution | — |
Configured Method is not coming in “ND Method Stats” |
| Possible Reasons #1 | 1. Method is not Configured properly. i.e Fully Qualified Method (FQM) is not applied in the configuration Format of FQM is like Package.Class.Method (Including Arguments and Return Type)
2. Method is not present in JVM |
| Steps to Diagnose | FQM should be applied in “”Add method to Monitor”” window. We can get FQM by running “”Auto Discover”” Feature.
Even if we applied the FQM, still Method not discovered means, we need to check whether method present in JVM or not. We can check this through by taking multiple Thread dumps at the time of generating load. We can take thread dump from GUI as well. Path: Home –> Action –>ThreadDump–> New–>Select Tier–>Select Server–> ND |
| Commands to validate / Solution | — |
Not getting “ND Exception Stats” group under “Application Metrics” |
| Possible Reasons #1 | “Enable Exception Monitors” option is not enabled in Agent ConfigUI. |
| Steps to Diagnose | Enable “Enable Exception Monitors” should enable in Agent ConfigUI Path: Home–>profile–>Configuration–>Instrumentation Settings–>Instrument Monitors–>Enable Exception Monitor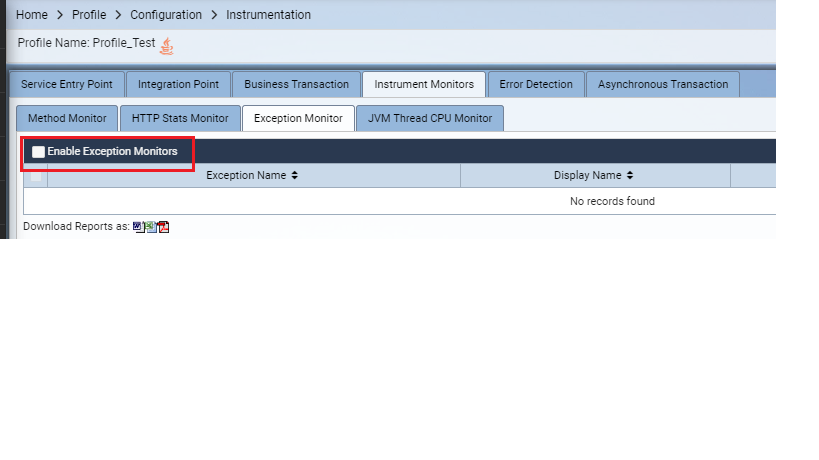 |
| Commands to validate / Solution | — |
Configured Exception is not coming in “”ND Exception Stats”” |
| Possible Reasons #1 | Exception name is configured properly in “Add Exception to Monitor” window |
| Steps to Diagnose | Configure the Exception Name properly. |
| Commands to validate / Solution | — |
Only “doFilter/service” methods are coming in Method Timing Report
|
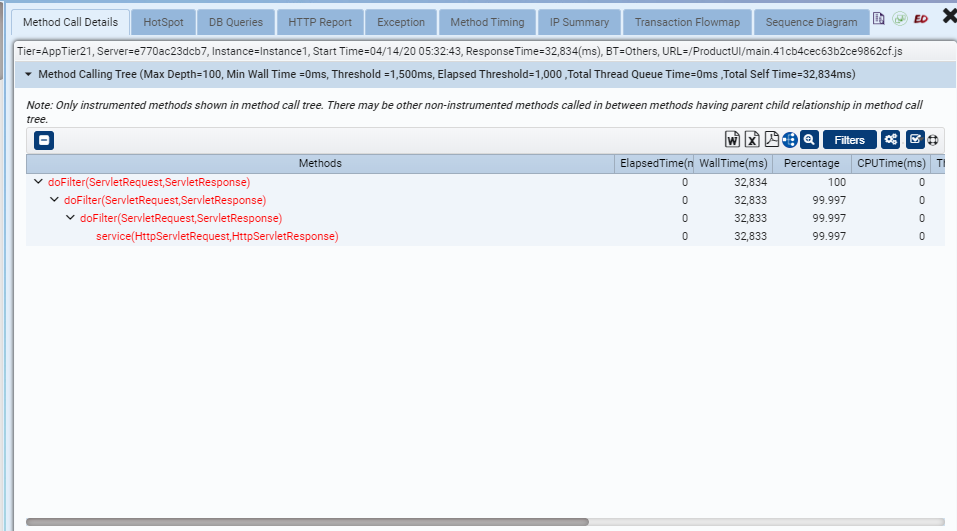
| Possible Reasons #1 | 1. Respective Flowpath may be Level 1 flowpath with Very Slow Category because of low instrumentation percentage
2. No Methods are instrumented in “Instrumentation Profile”. |
| Steps to Diagnose | 1. Increase the instrumentation percentage. Path : Home–>Profile–>General–>Flowpath–>Flowpath Instrumentation(%)
1. Run Auto Instrumentation Feature to know which methods are taking more time to execute and apply as Instrumentation Profile Path for Auto Instrumentation : Home –> Application–>Tier–>Server–>Instance–>Start Auto Instrumentation. 2. Then go to Home –>Instrumentation Finder –> Auto Instrument –>Auto Instrument List –> Download 3. Then Home –> Profile –> Configuration–> General –> Instrumentation Profile –> Apply Saved Instrumentation Profile from drop down list |
| Commands to validate / Solution | — |