Working with NetForest

NetForest comprises an analytics and visualization platform. NetForest is used to search, view, and interact with data stored in NetForest indices. Users can easily perform advanced data analysis and visualize the data in a variety of charts, tables, and maps.

NetForest makes it easy to understand large volumes of data. It is a simple, browser-based interface that enables a user to quickly create and share dynamic dashboards that display changes to NetForest queries in real time.

Login to NetForest

Follow the below-mentioned steps to login into NetForest:

  1. Enter the following URL (http://hostname/netforest) at the address bar of the browser and press ENTER. The NetForest login window is displayed.
Figure 7: Login Window
  1. Enter the Username and Password and click the Sign-in The Dashboard Home page is displayed. Click on Logs tab, and the NetForest home page is displayed.
Figure 8: Home Page

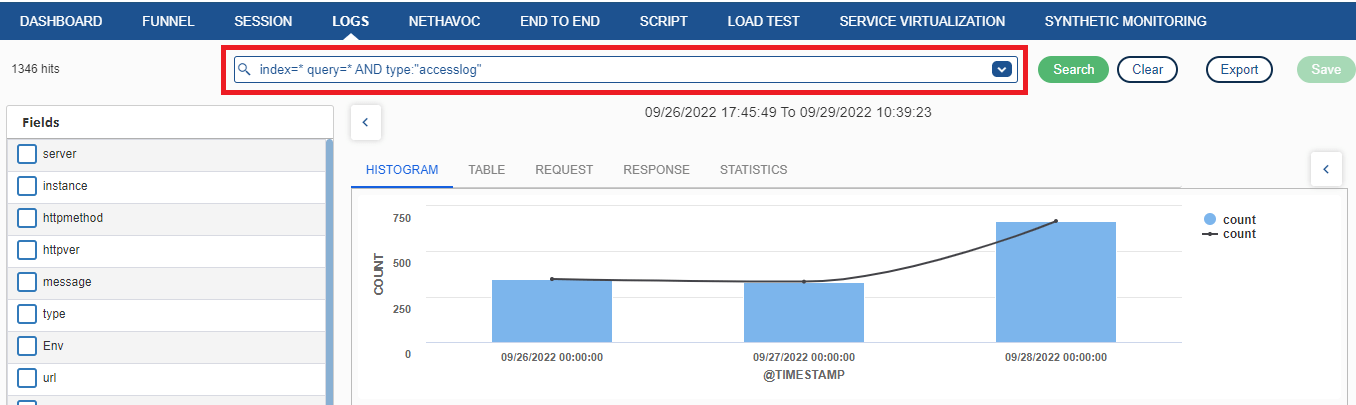
NetForest Home page consists of a left navigation pane that contains menu items, such as: Search, Clear, Export, and Save.

In the subsequent topics, a detailed description of all the sections and their features are provided:

Icon/Button

Description

Search enables a user to search data throughout NetForest and display it on the document table.

Chart enables a user to create graphical representation of the data in NetForest indices.

NetForest Dashboard displays a collection of saved charts.

This allows a user to schedule and generate reports. 

Alert enables a user to be notified of an issue.

Settings allow a user to perform some configuration on various aspects, such as index pattern, saved objects, advanced settings, and dashboard menu.

Monitoring allows a user to view/monitor various indexes and other information.

Used to manage users.

Using Sign Out, the user can exit from the NetForest system.

Working with Search

Overview of Search

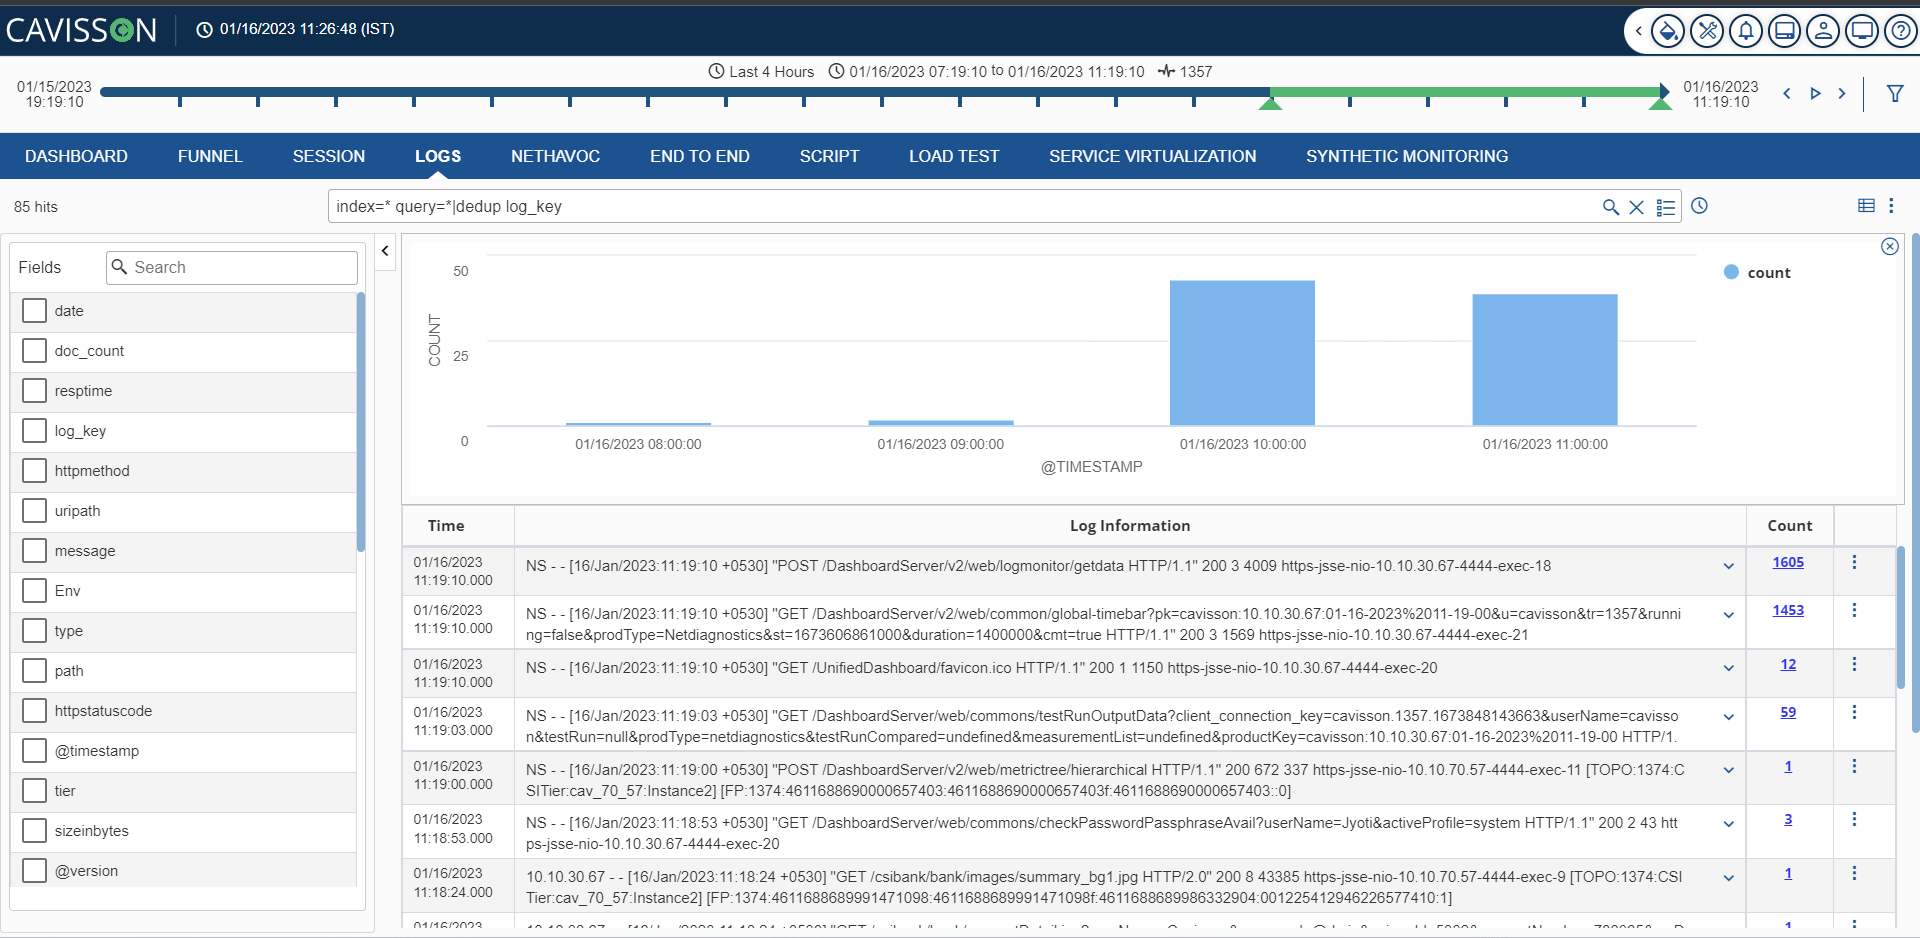
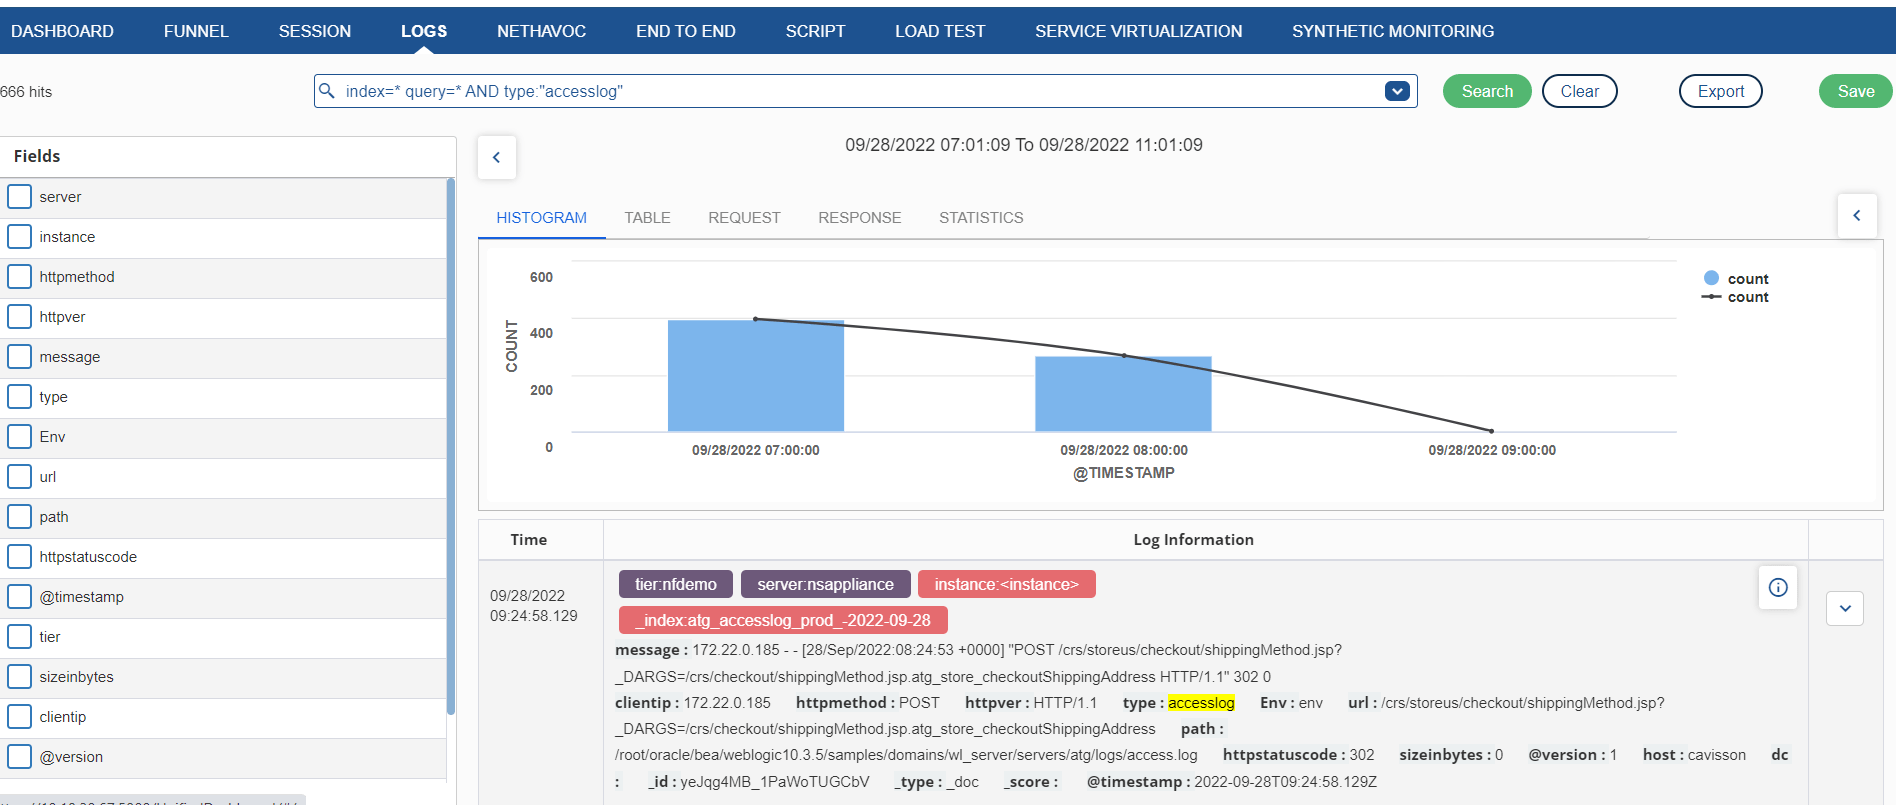
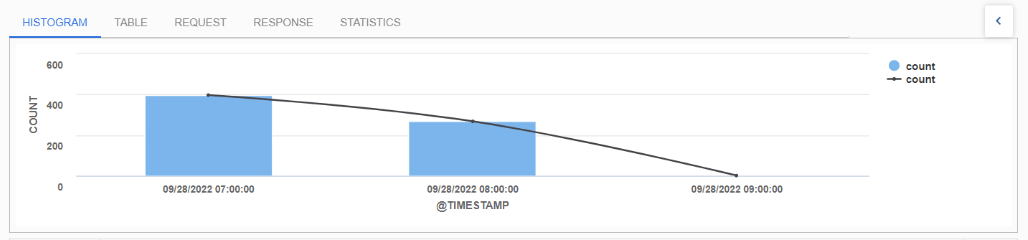
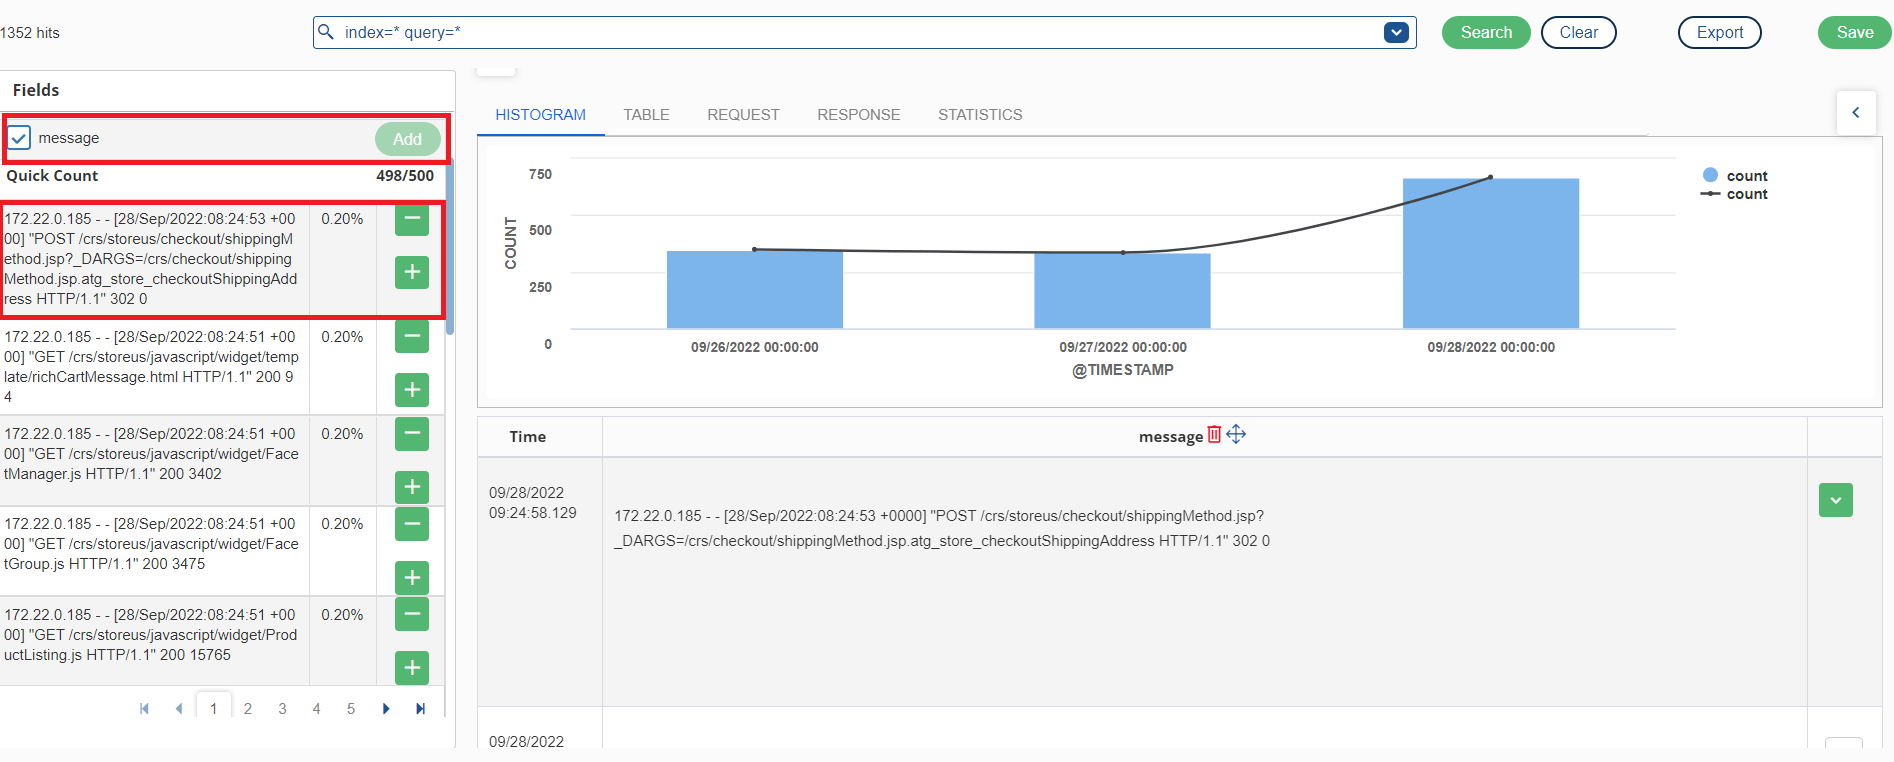
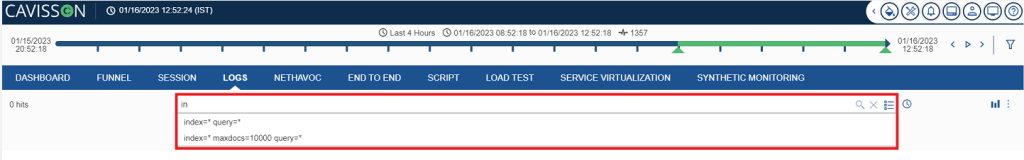
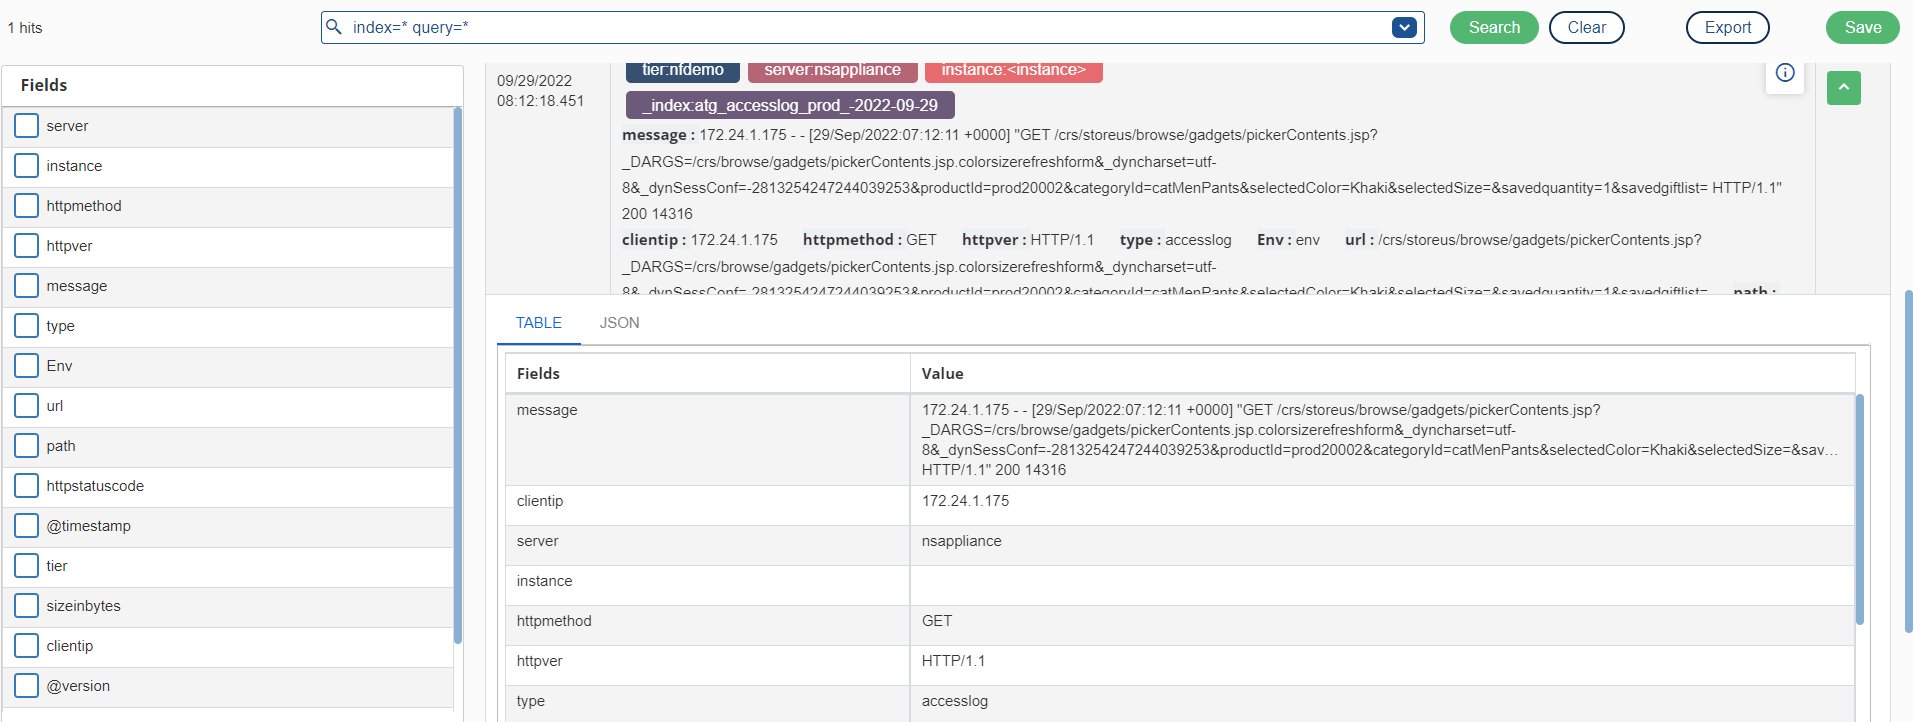
A user can interactively explore data from the Search page. User has access to every document in every index that matches the selected index pattern. Users can submit search queries, filter the search results, and view document data. The user can also see the number of documents that match the search query and get field value statistics. If a time field is configured for the selected index pattern, the distribution of documents over time is displayed in a histogram at the top of the page.

Figure 9: Search

Time Filter

The time filter restricts the search results to a specific time period. The User can set a time filter if the index contains time-based events and a time field is configured for the selected index pattern. By default, the time filter is set to the last 15 minutes. User can use the Time Filter to change the time or select a specific time interval or time range in the histogram at the top of the page.

On clicking the filter icon , the user should be able to open the filter option.

Figure 10: Filter Icon
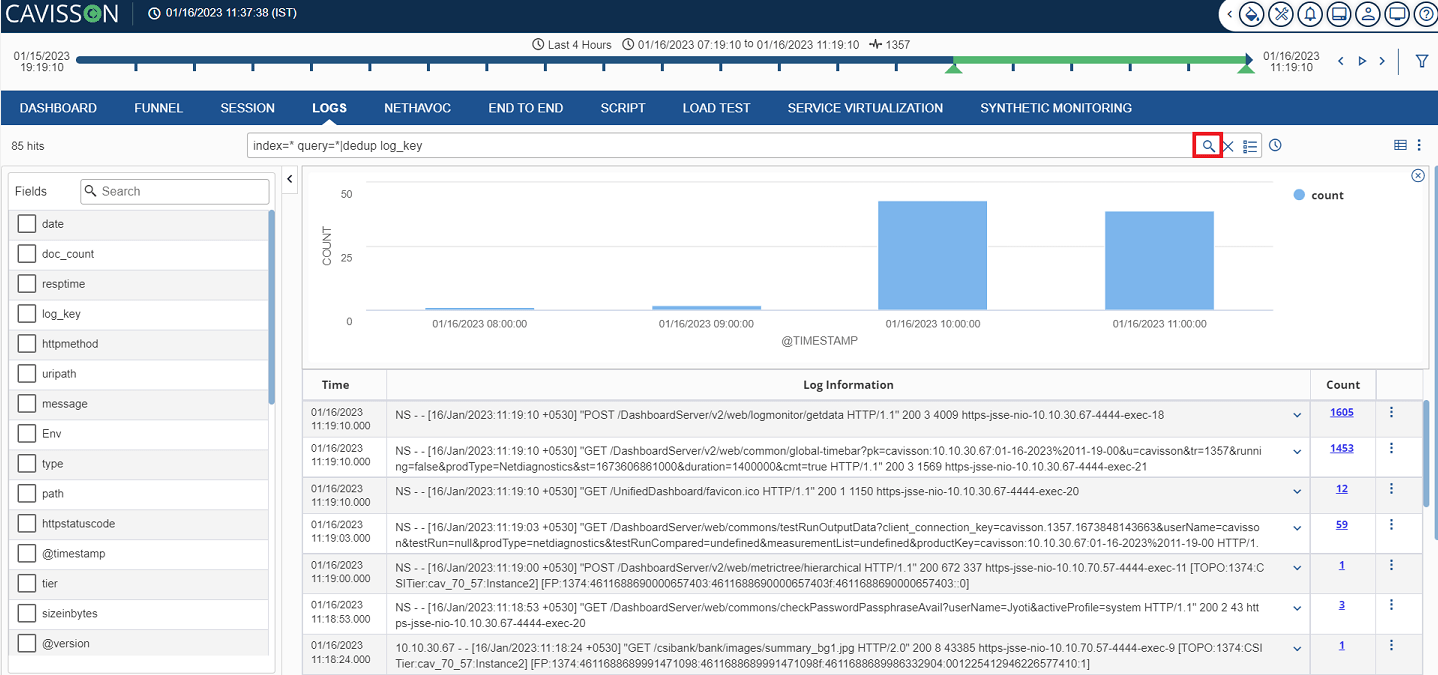
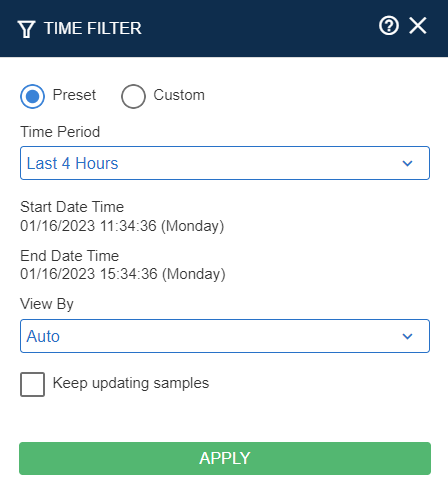
  1. Click the Time Filter icon on the NetForest toolbar at the top-right corner.
  2. On clicking the icon, there are two sections: Preset and custom.
Figure 11: Time Filter

3. In “Preset” time settings, the users should get the logs from current time to time like:

    • Last 4 hours
    • Last 24 hours
    • Whole Scenario
    • Past like: Yesterday, Last week, Last 2 weeks, etc.
    • Events like: Black Friday, Cyber Monday, Christmas Day, Good Friday, New Year Day, Thanks Giving Day, and Valentine’s Day.

 In “Custom” time settings, the users should get the logs of provided start and end time period.

Searching Data

For search data, user needs to click on the Query Search Bar, then select the index from the drop-down list, and then pass a query in the query bar to get the search results.

Figure 12: Query Search Bar

Whenever a user enters a query, the result is displayed in the following layout:

Figure 13: Result for Query Searched

Note: Data is gradually displayed as it is fetched from the NFDB. For example, if you search for seven days’ data, NF starts plotting data for 1st day, 2nd day, 3rd day, and so on until all seven days data is loaded.

This screen is categorized into the following sections:

Histogram

The result is displayed in the form of bar charts.

Figure 14: Histogram

Table

The result is displayed in the form of fields along with the time. By default, all fields are displayed.

Figure 15: Table

To view the result in Tabular or in JSON format, click the  icon corresponding to the result and select the Table or JSON tab respectively.

Tabular Format

Figure 16: Tabular Format

JSON Format

Figure 17: JSON Format

A link is provided to view the full report (in tabular and JSON format). User can click this link and view the report in expanded form (full screen).

Figure 18: Report in Expanded Form

Selection of Fields

User can select a field from the left pane where all and popular fields are listed. To add a field, mouse-hover over that field and click add  .

Figure 19: Selection of field

To remove a field from the selected fields, click the remove  button on mouse-hover a field.

Figure 20: Remove Button

Searching Data

User can search the indices that match the current index pattern by entering the search criteria in the Query Search bar. User can perform a simple text search or use the NetForest query syntax.

When a user submits a search request, the Histogram, Documents, Table, and Fields list are updated to reflect the search results. The total number of hits (matching documents) is displayed in the toolbar. The Documents table shows the first five hundred hits. By default, the hits are listed in reverse chronological order, with the newest documents displayed first. User can reverse the sort order by clicking the Time column header. User can also sort the table by the values in any indexed field.

To search data, click the Query Search Bar enter the search criteria in the Query bar, and press Enter or click Search to submit the request to NetForest.

  • To perform a free text search, simply enter a text string. For example: to search web server logs, enter apache to search all fields for the term apache.
  • To search for a value in a specific field, prefix the value with the name of the field. For example: to find all the entries that contain the value 200 in the status field, enter status:200.
  • To search for a range of values, user can use the bracketed range syntax, [START_VALUE TO END_VALUE]. For example, to find entries that have 4xx status codes, enter status: [400 TO 499].
  • To specify more complex search criteria, user can use the Boolean operators AND, OR, and NOT. For example, to find entries that have 4xx status codes and have an extension of php or html, enter status: [400 TO 499] AND (extension: php OR extension: html).

Saving the Search

Saving a search enables the user to reload and use it as the basis for charts. Saving a search saves both the search query string and the currently selected index pattern.

To save the current search, follow the below mentioned steps:

  1. Click Save on the NetForest toolbar, and the save dialog box appears.
Figure 21: Save Dialog box
  1. Enter a name for the search and click on the Apply  button.

Note: Whenever a new tier is added, a notification is displayed on the UI about the same.

Opening an Existing Search Query

To load a saved search, follow the below mentioned steps:

  1. Go to the User Option , and click on My Library.
Figure 22: My Library

2. On My Library option, click on the Searches On clicking the tab, data will be shown.

Figure 23: Searches Tab

Note: If the saved search is associated with a different index pattern than is currently selected, opening the saved search also changes the selected index pattern.

Autosuggestion in Search

Whenever a user enters a query, functions (commands and/or fields) are displayed as autosuggestions in the query bar. This enables the user to choose from the displayed functions. This saves the time of the user from typing the whole query.

Figure 24: Autosuggestion in Search

On submitting a search request, the indices that match the currently selected index pattern are searched. The current index pattern is displayed below the toolbar. To change the indices, click the index pattern and select a different index pattern.

Refreshing the Search Results

As more documents are added to the indices on searching, the search results displayed (that are used to display charts) get stale. User can configure a refresh interval to resubmit the searches periodically to retrieve the latest results.

Filtering by Field

User can filter the search results to display only those documents that contain a particular value in a field. User can also create negative filters to exclude documents that contain the specified field value.

User can add field filters from the Fields list or the Documents table. In addition, to create positive and negative filters, the Documents table enables the user to filter whether a field is present. The applied filters are displayed below the Query bar. Negative filters are displayed in red.

To add a filter from the Fields list:

  • Click the name of the field to apply the filter. This displays the top five values for that field.
Figure 25: Filtering by Field
  • To add a positive filter, click the Positive Filter button . This includes only those documents that contain that value in the field.
  • To add a negative filter, click the Negative Filter button . This excludes documents that contain that value in the field.

To add a filter from the Documents table:

  1. Expand a document in the Documents table by clicking the Expand button to the left of the document’s table entry.
Figure 26: Documents Table
  1. To add a positive filter, click the Positive Filter button to the right of the field name. This includes only those documents that contain that value in the field.
  2. To add a negative filter, click the Negative Filter button to the right of the field name. This excludes documents that contain that value in the field.
  3. To filter whether documents contain the field, click the Exists button to the right of the field name. This includes only those documents that contain the field.

Viewing Document Data

On submitting a search query, the 500 most recent documents that match the query are listed in the Documents table. User can configure the number of documents displayed in the table by setting the discover: sampleSize property in Advanced Settings. By default, the table displays the localized version of the time field configured for the selected index pattern and the document _source. Users can add fields to the Documents table from the Fields list. Users can sort the listed documents by any indexed field that is included in the table.

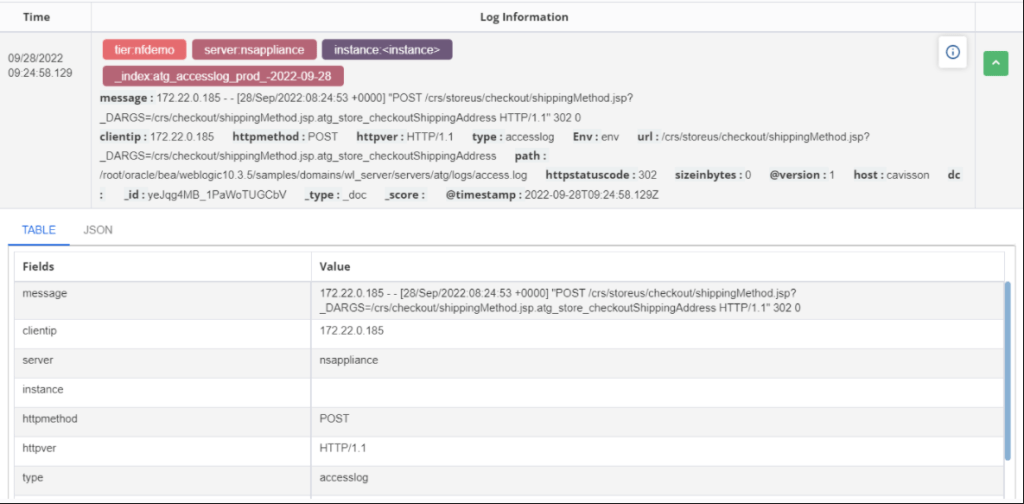
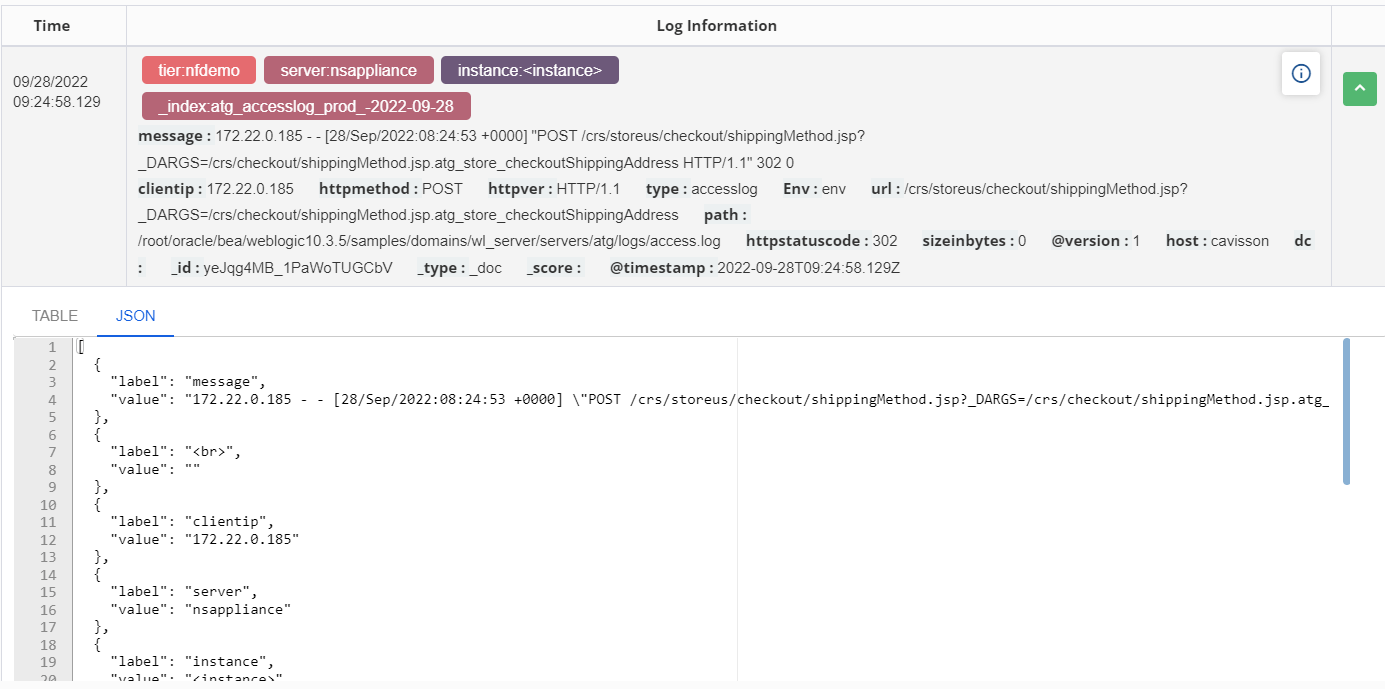
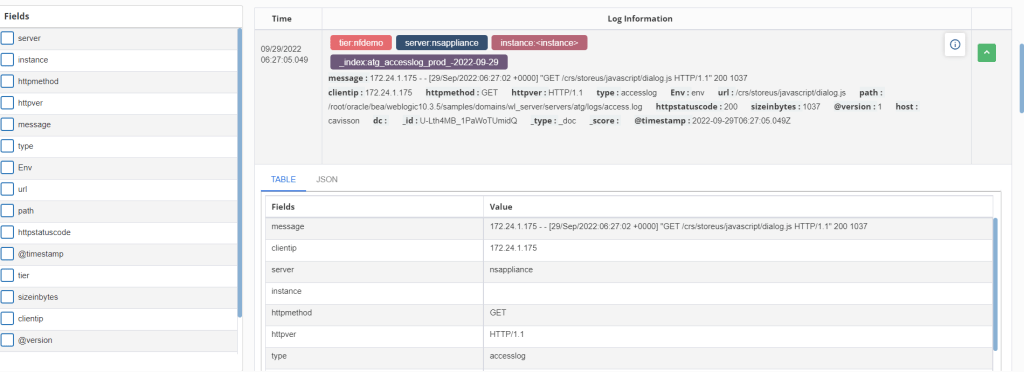
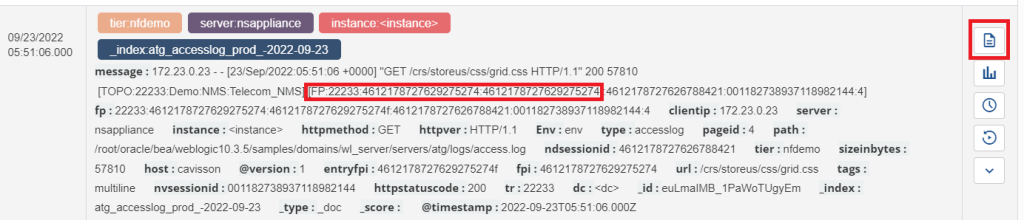
To view a document’s field data, click the Expand button  to the left of the document’s table entry.

Figure 27: Viewing Document Data

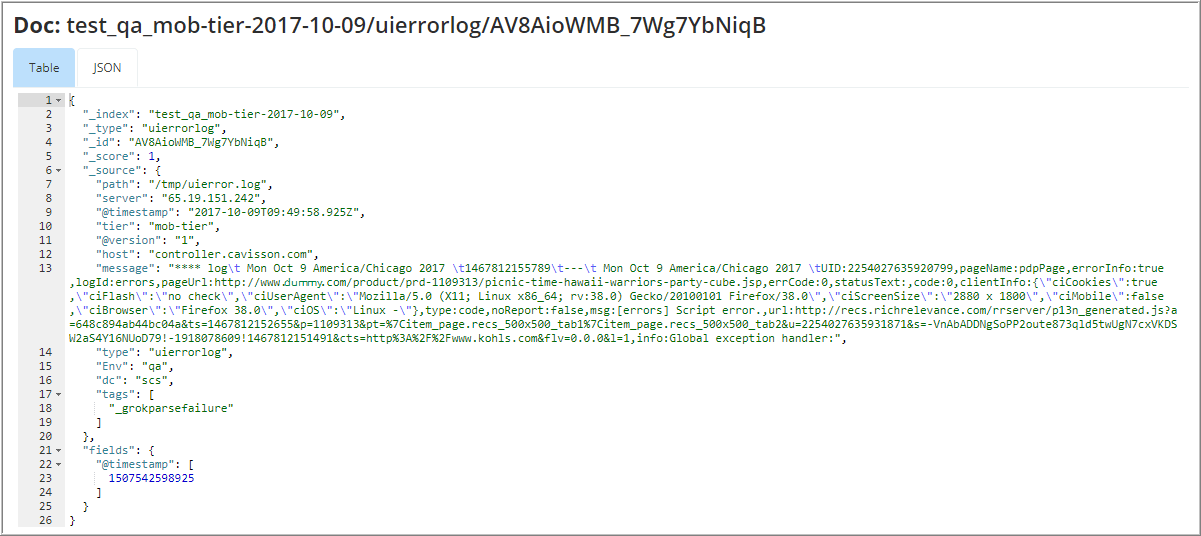
To view the original JSON document (pretty-printed), click the JSON tab. To view the document data as a separate page, click the document link. Users can bookmark and share this link to provide direct access to a particular document. To collapse the document details, click the Collapse button .

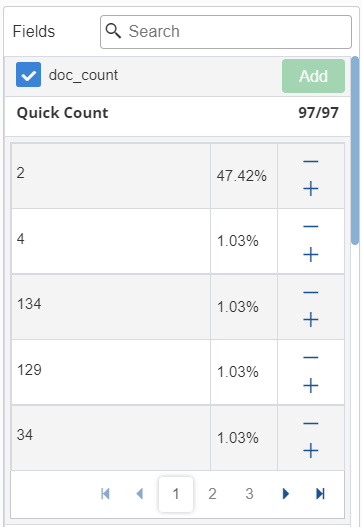
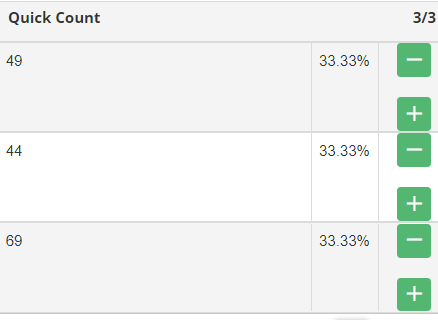
Viewing Field Data Statistics

From the Fields list, the user can see how many of the documents in the Documents table contain a particular field, what the top 5 values are, and what percentage of documents contain each value. To view field data statistics, click the name of a field in the Fields list.

Figure 28: Field Data Statistics

Sharing Snapshot URL

To load a saved search, follow the below mentioned steps:

  1. Click Share on the NetForest toolbar.
  2. Copy the link for sharing. Users can get the short URL using the Short URL

Additional Features

There are the following additional features in NetForest:

  • FlowPath Related features
  • Search Related features

FlowPath Related Features

  • Show all Logs by FlowPath ID.
  • Open Transactions by FlowPath ID.
  • Open Timing by FlowPath ID Report.
  • Open Replay by FlowPath ID Report.
Figure 29

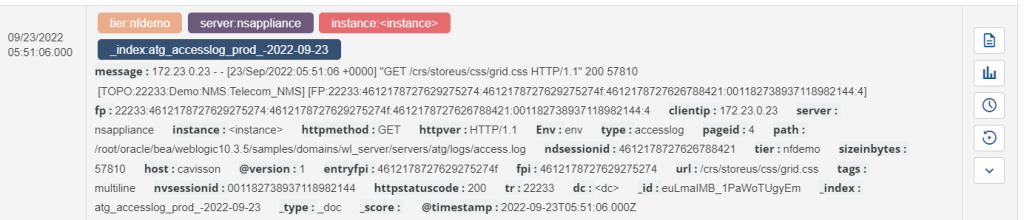
Show all Logs by Flowpath ID: To view all logs by FlowPath ID, click the  icon on the result section. The logs corresponding to that FlowPath ID are displayed.

Figure 30: Show All Logs by Flowpath ID

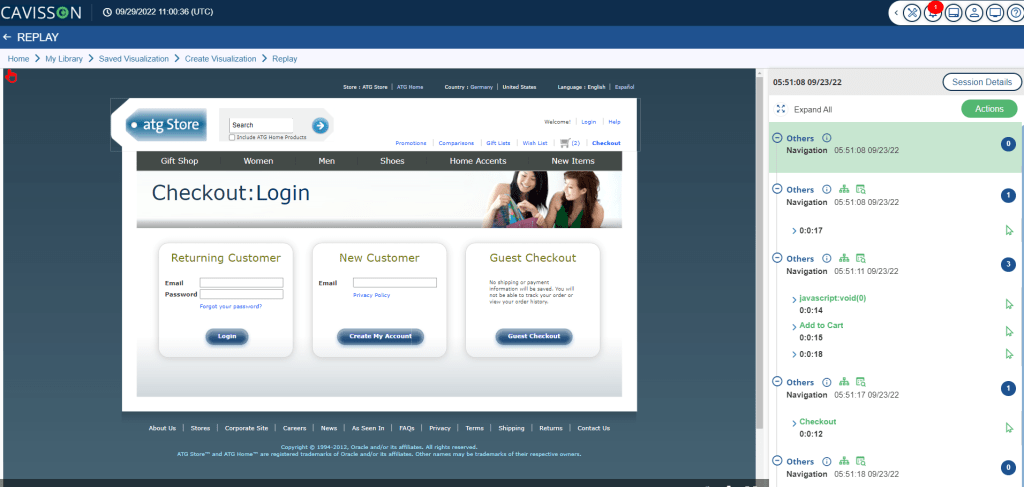
Open Transactions by Flowpath ID: To open transactions by FlowPath ID, click the  icon. The NetDiagnostics Enterprise – FlowPath report is displayed.

Figure 31: Open Transaction by Flowpath ID

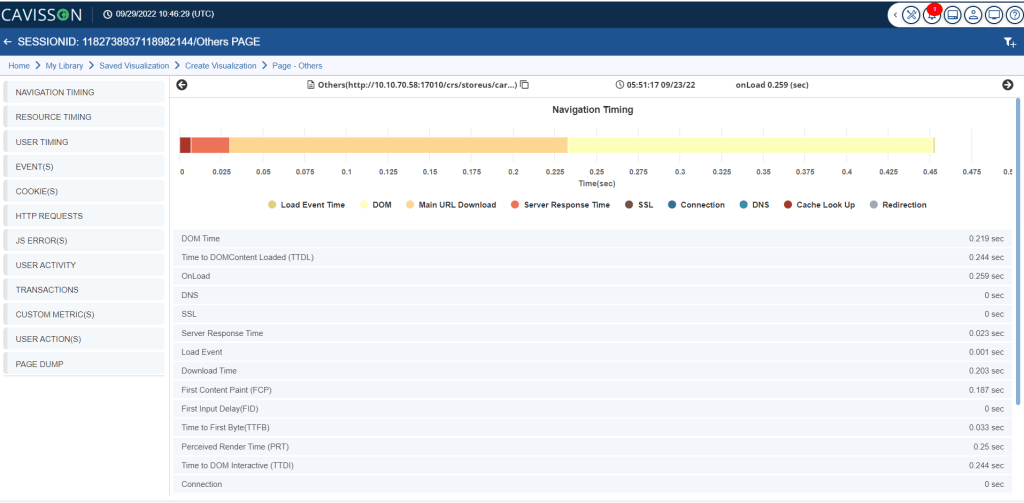
Open Timing by Flowpath ID: To open the NetVision timing report, click the   icon.

Figure 32: Open Timing by Flowpath ID

Open Replay Report: To open the NetVision replay report, click the  icon.

Figure 33: Replay Report

Search Related Features

  • Select any test in the log and click Search popup button to search for log entries with the same text.
Figure 34
  • Clicking on any field in the log entry displays all logs filtered with that field value.
  • Alert option navigates the user to the alert section (for adding a new alert rule). This has been described in the Alert