This query is used to draw any visualization (charts). A user can use * for using VIS query in all the logs. For use in specific logs, first filter it out and use the VIS query.
Note: VIS query will work only on charts, not on search.
Syntax:
*|VIS <Function name(parameters)>by<Field name [sortBy order= Ascending/Descending size=<value> customLabel=”name”]>
Example 1:
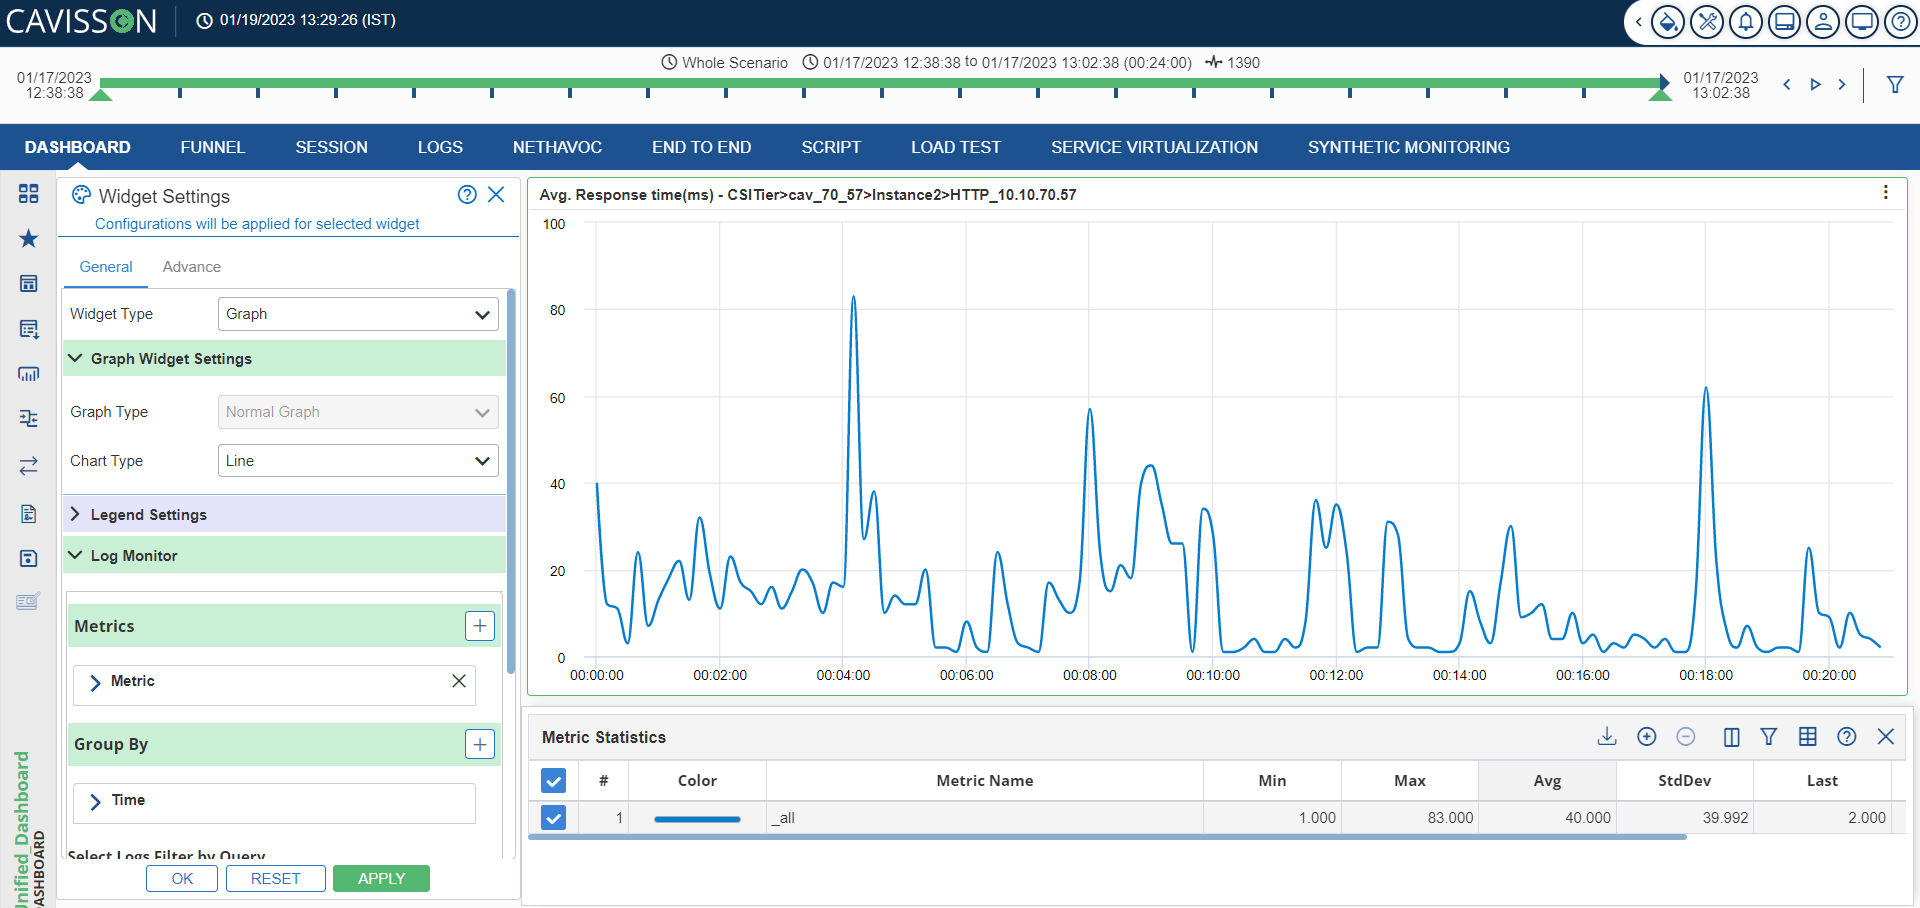
tier:updated|VIS Count() by @timestamp[interval=Auto]
Description:
Here, the tier is filtered out and then it calculates the count on that particular tier with respect to timestamp.
Output:

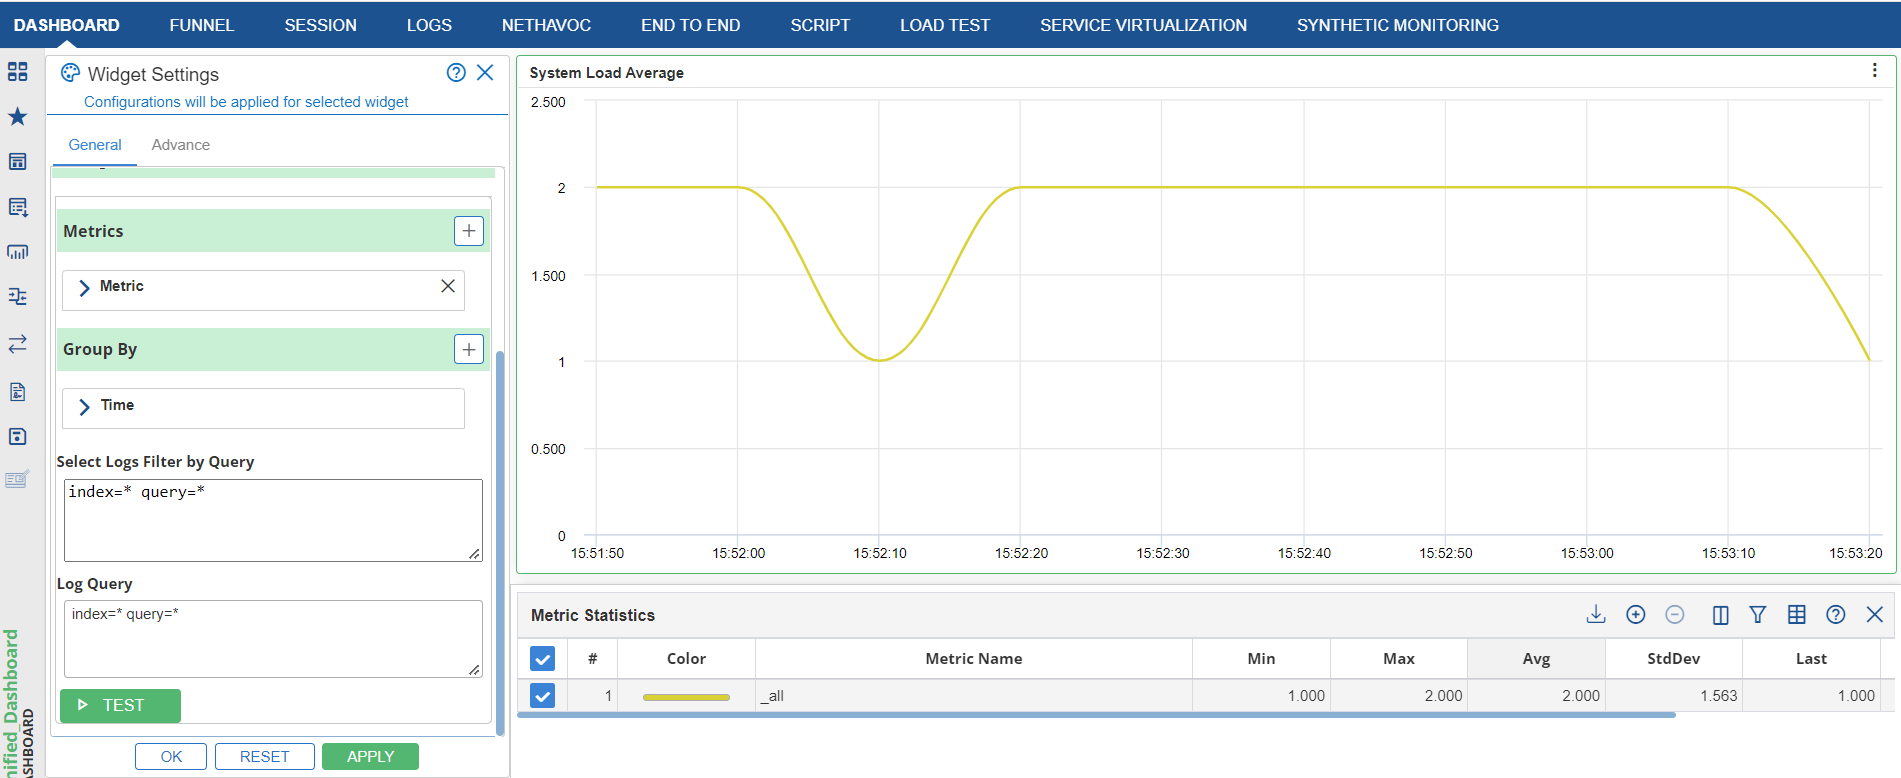
Example 2: tier: updated|VIS Count () by @timestamp[interval=Auto],resptime[]
OR
tier: updated|VIS Count () by @timestamp[interval=Auto],resptime[sortBy=1 order=Ascending Size=5]
Description: Here, the user can use multiple buckets as per the usage.
Output

Syntax: *|VIS <aggregation_name>(fieldname) by @timestamp[interval=Auto]
Different Supported Aggregations along with keywords:
- Count (): It provides the count of documents.
- Average (): It provides the average value with respect to time.
- Min (): This column displays the minimum value of the data sample of the metric.
- Max (): This column displays the maximum value of the data sample of the metric.
- Color (): This column displays the color of the metric.
Note: This column will not come for data and label widget.
- StdDev (): It will display the standard deviation of the data sample of the metric.
- Last (): This column displays the last value of the data sample of the metric.
- Time Series (): This column displays the count of metrics involved to create the current aggregated metrics.
- Metric Name (): This column represents the metric name.
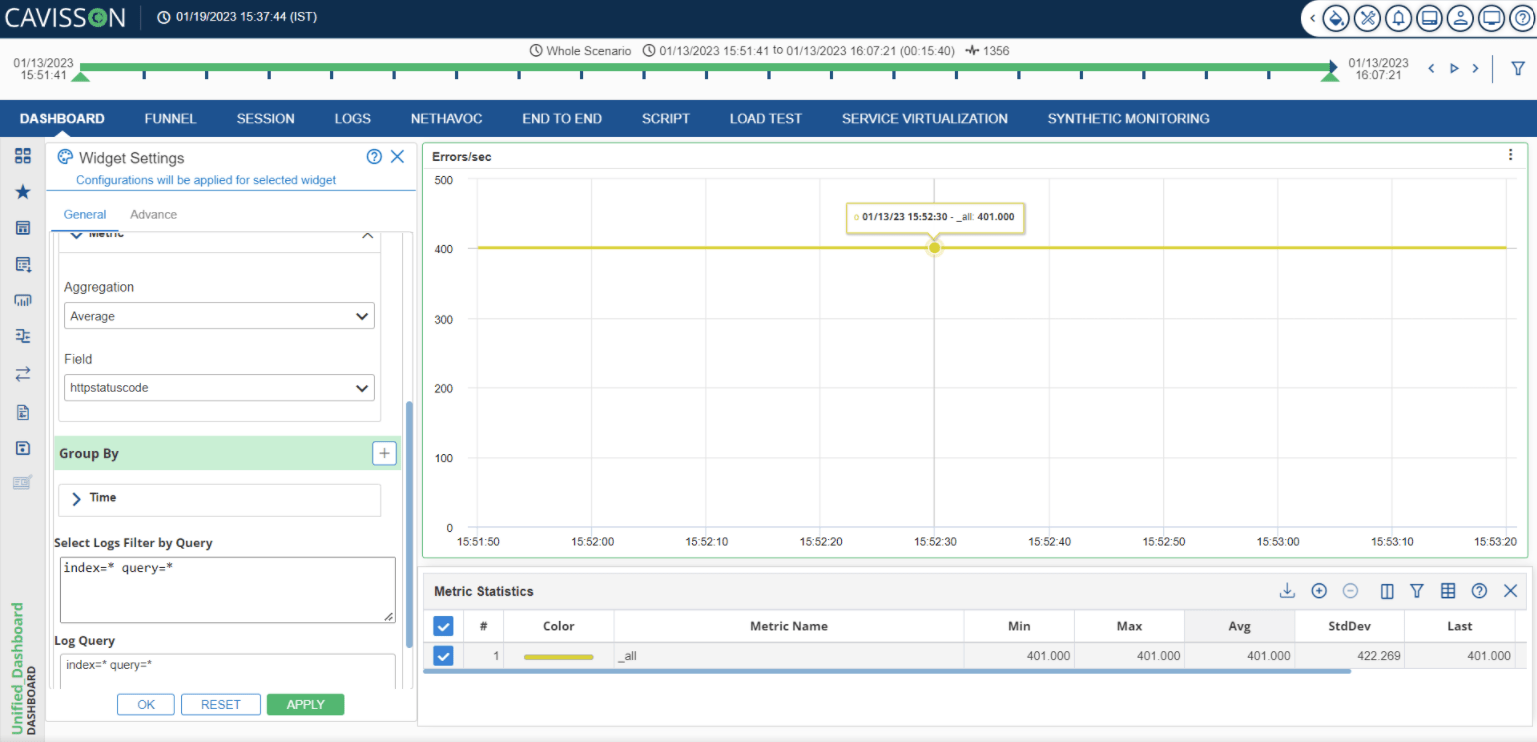
Example 3: tier:updated|VIS Average(resptime) by @timestamp[interval=Auto]
Description: To perform an operation on a particular field.
Output

A user can also provide custom label in VIS query to change/modify the label of columns and rows as per requirement. It is applicable for charts.
For count: *|VIS count(customLabel=query_count) by server[size=5 order=Descending orderBy=1 customLabel=server]
For others:*|VIS Average(resp_time customLabel=query_count) by server[size=5 order=Descending orderBy=1 customLabel=server]
Note: ‘customLabel’ does not support space in label name.
Range query in Visualization
User can also search a range query from the query bar. Below is the syntax along with an example to illustrate this feature.
Syntax: *|VIS Aggregation() by range(field_name[])
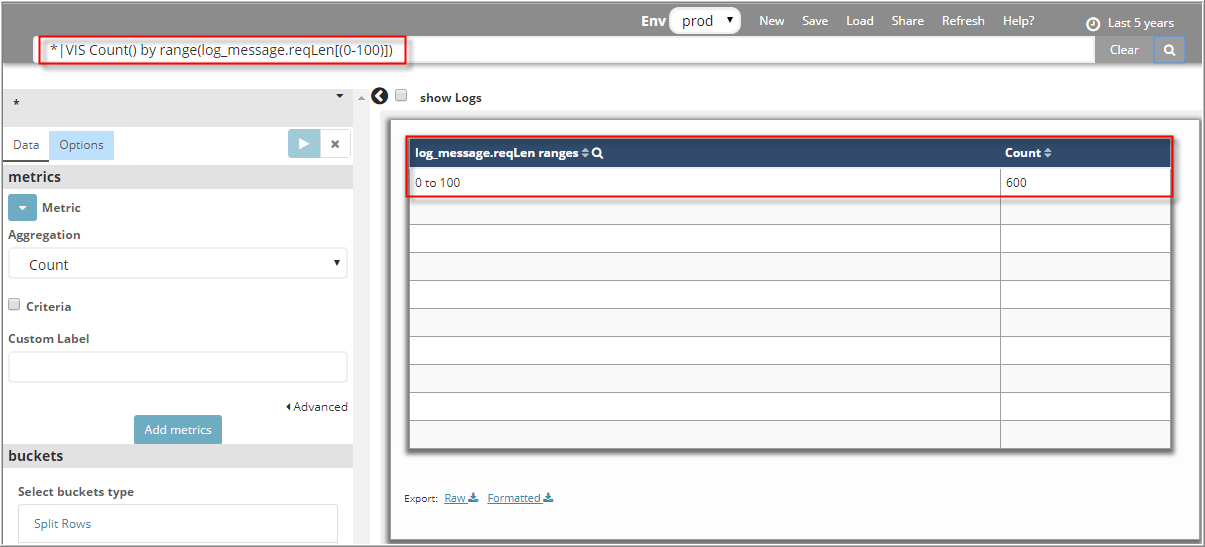
Example *|VIS Count() by range(log_message.reqLen[(0-100)])
Description: After successful execution of the query, results are displayed in the below format.

If user leaves the range empty, the default range values 0-1000 and 1000-2000 are used to display the results. |
Stats Query
This query is used to find the statistics/aggregation for the field, such as sum, count, avg, min, max. It can be grouped by another field.
Different Supported Aggregations along with keywords:
distinct_count(Y) | Returns the count of distinct values of the field Y. |
perc(Y) | Percentiles show the point at which a certain percentage of observed values occur. For example, the 95th percentile is the value that is greater than 95% of the data. |
sumsq(Y) | Returns the sum of the squares of the values of the field X. |
var(Y) | Returns the sample variance of the field X. |
stdev(Y) | Returns the sample standard deviation of the field X. |
earliest(Y) | Returns the earliest seen occurrence of the value of field Y based on timestamp |
Latest(Y) | Returns the latest seen occurrence of the value of field Y based on timestamp. |
min(Y) | Returns minimum value of the numeric field Y. |
max(Y) | Returns maximum value of the numeric field Y. |
count(Y) | Returns total number of occurrences of the filed Y. |
Avg(Y) | Returns average value of the field Y. |