Overview
This guide will help to set up a monitoring system for performance and production environments. The document has detailed guidelines from installing CMON to configuring monitors and verifying them.
Features of Monitor
- Monitoring of different server stats while the test is running.
- Get Server signatures before the test starts.
- Special checks while the test is running.
- Integrated with execution GUI for easy analysis and correlation with different metrics.
- To check the list of all supported technologies, visit cavisson.com.
Enhancement
LPS Module Masking Enhancement
Trace logs are implemented in LPS with 4 levels. There are no module level logs in LPS. If a user wants to set trace level 4 for access log monitors, that was not supported. Earlier when we enabled trace log, it gets enabled for all the modules. Due to that, lots of trace logs were generating and it was hard to diagnose the trace log as all of the LPS modules wrote their own trace log in one file. Now a new function is added which will enable logging of only specified monitors, the default will be level 1 (error logs).
How to Access
The user needs to follow the below steps to manage the monitor’s configuration:
- Open the web browser and type the address in the address bar
https://hostname/UnifiedDashboard/#/login. The product window is displayed.
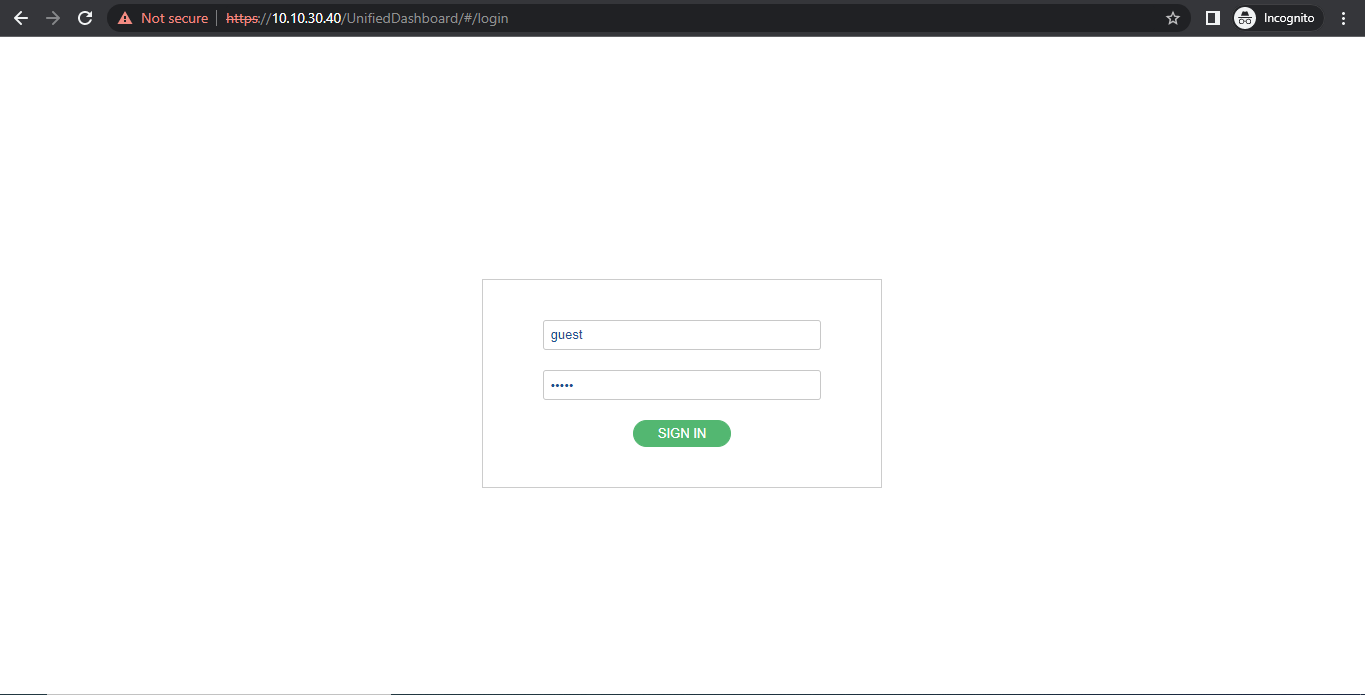
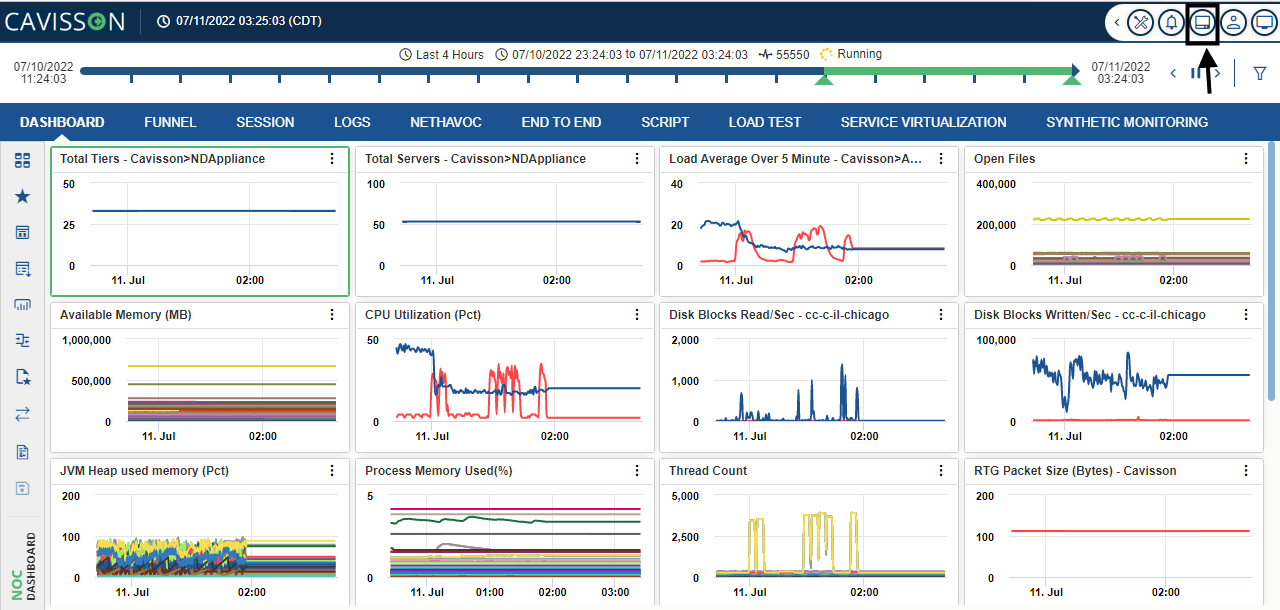
2. Login to the product using login credentials. The product homepage is displayed:
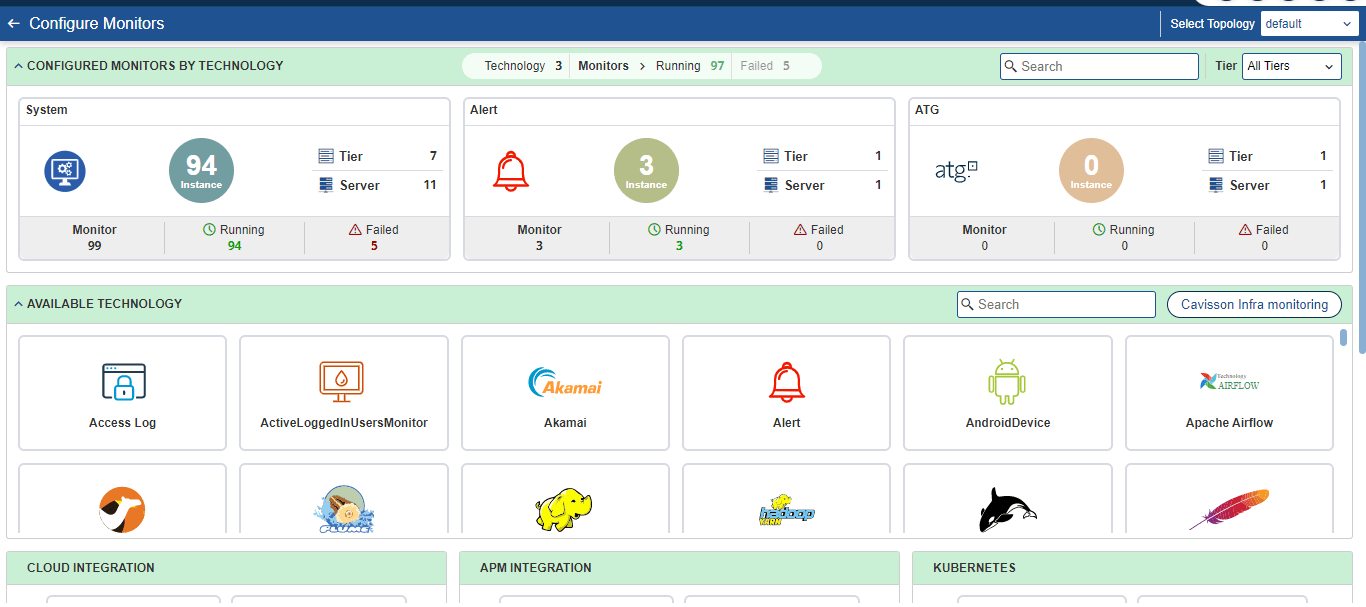
3. Click on Monitors. This will display the Monitor Homepage UI