You can perform various operations on widgets by clicking the icon on the top right corner of any widget. The operations include – Widget Settings (Chart settings, advanced settings, apply filters), apply time period and view by settings, view metric data, perform pattern matching on graphs, perform comparison on metrics, and run commands on server.
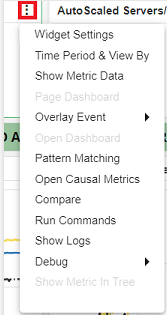
Widget Settings
The Widget Setting allows you to choose from multiple graph types to visualize a filtered group of records. You can select the visualization type that best suits your data, including bar, line, area, step, and pie. You can modify some or all of the following widget elements to match the look and feel of your Dashboard.
By widget setting, you can perform various settings related to widgets, such as chart settings, advanced settings, and can apply filters. These settings are further categorized into various sub-sections. The widgets are displayed in the Dashboard based on the configured settings.
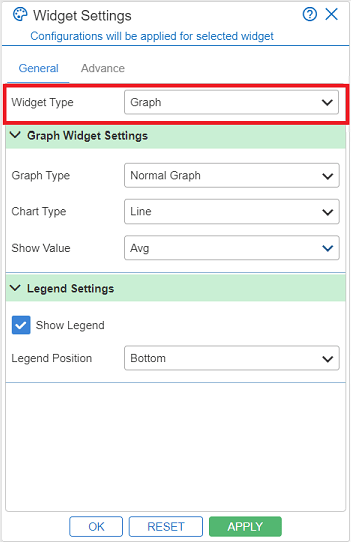
General
The General widget setting provides a basic implementation of different types of Widgets (e.g.: Data, graph, tabular, etc.) and chart (for example: area, line, bar, pie).
Widget Type
It is the representation of the widget on the panel. Select the Widget type, such as Graph, Data, Tabular, System Health, or Label. The next selection is based on the Widget type selected. Here, we are describing further options that are displayed on the selection of a particular widget type.
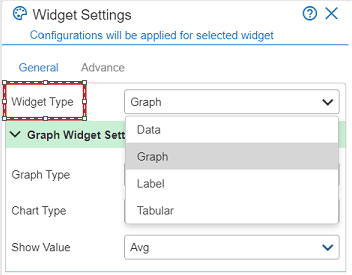
Widget Type – Graph
This option is selected to display metrics on that widget. Graphs can be of any type, such as Normal, percentile and trend. Based on the graph type, there are chart types, such as Line, Bar, Area, Percentile, Slab, Meter, Geo Map etc. In Geo map, locations can be displayed by country, state and city.
Graph Widget Settings
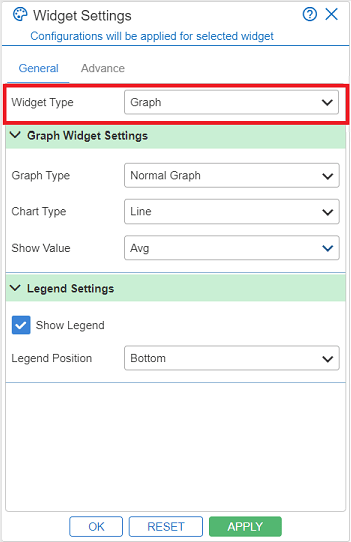
Graph Type: It allows you to choose from multiple graph types to visualize a filtered group of records. There are following options under this:
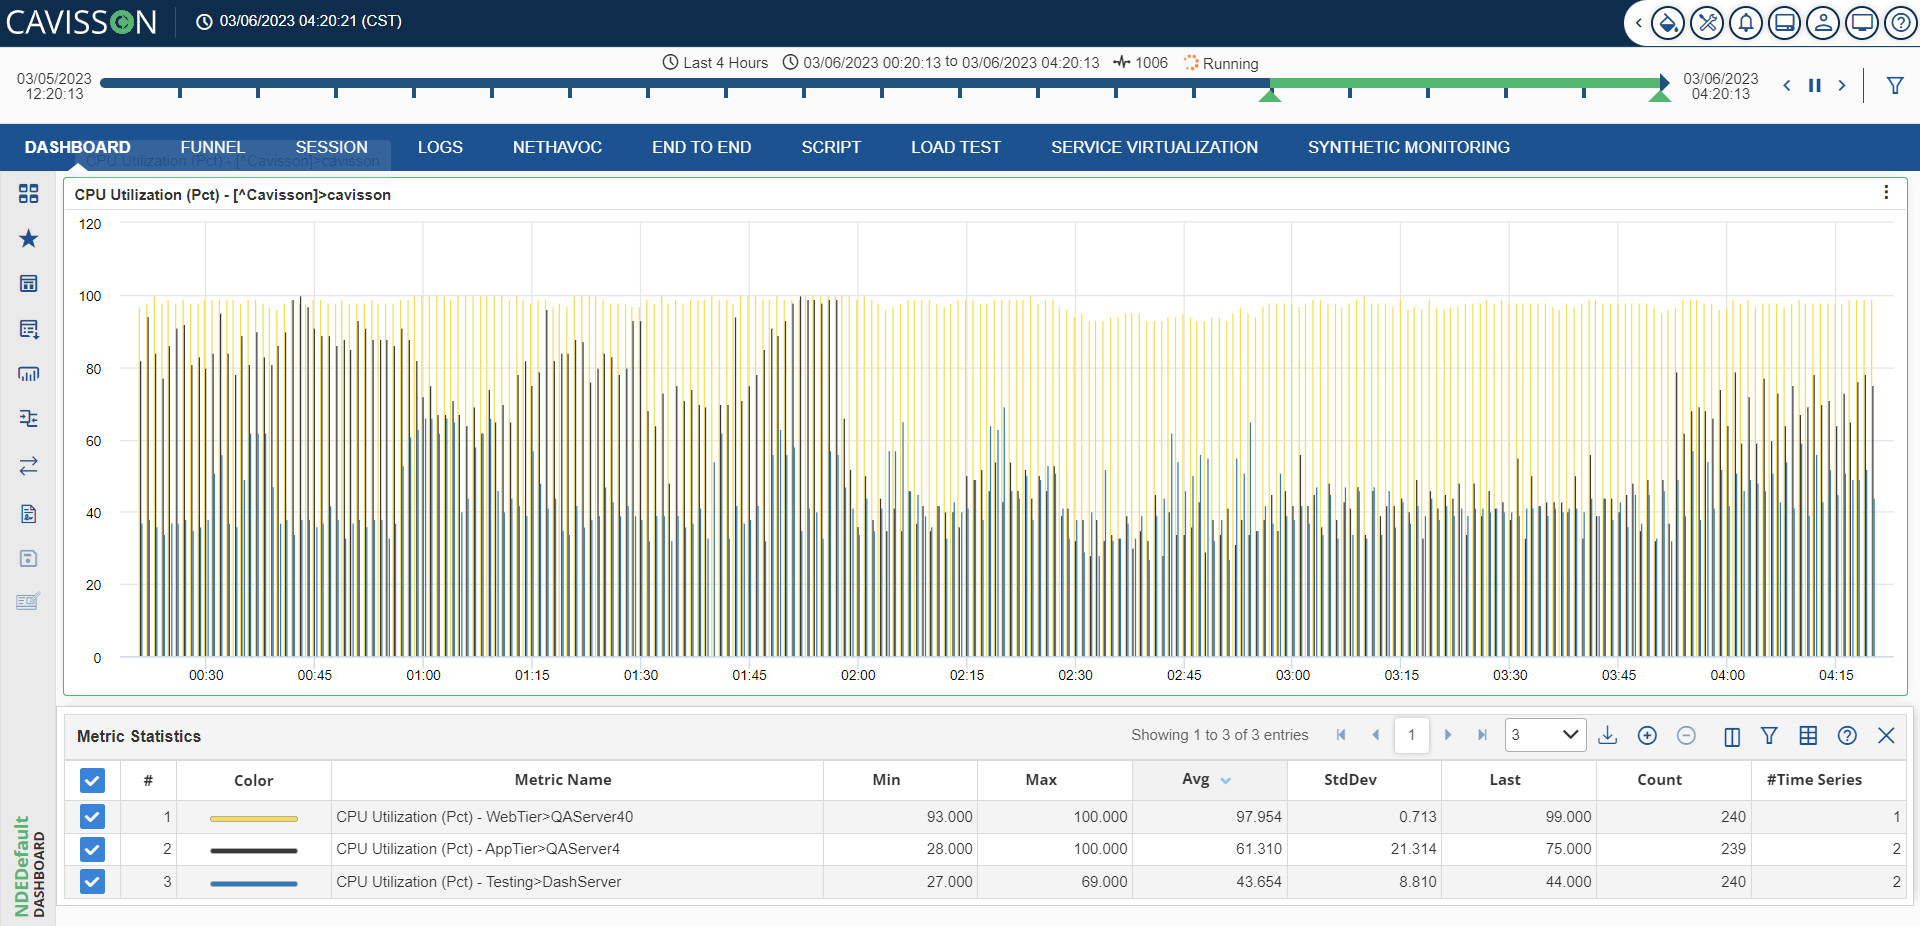
- Normal: This contains all the graphs. In the case of normal graphs and category graphs, you need to select the formula type too, such as: Average, Min, Max, Count, and Sum Count. You can add multiple formulas also. When you select graph type other than ‘Normal’ graph type, the ‘Graph Sample Filter’ option is disabled.
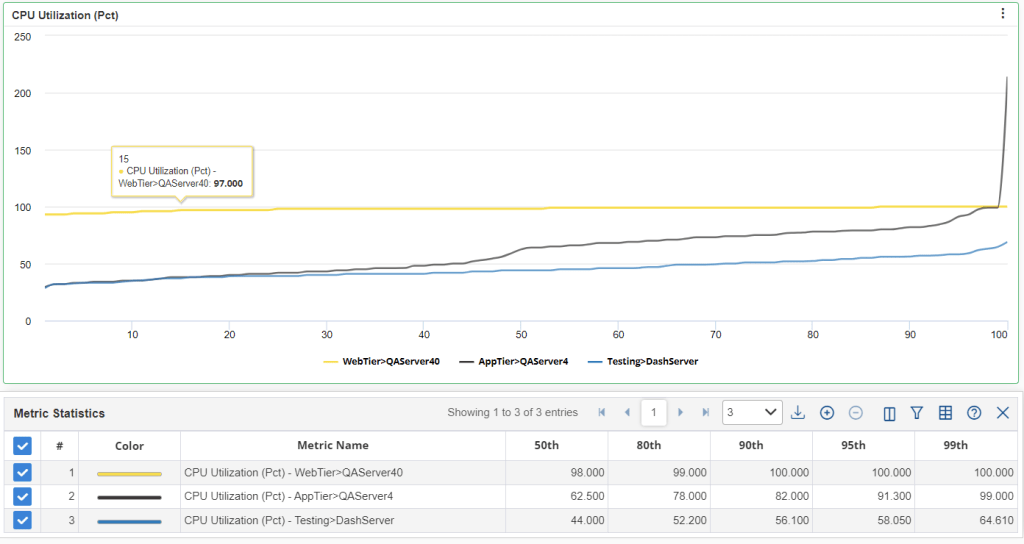
- Percentile: This contains only the percentile graphs. A percentile is the value of a variable below which a certain percent of observations fall.
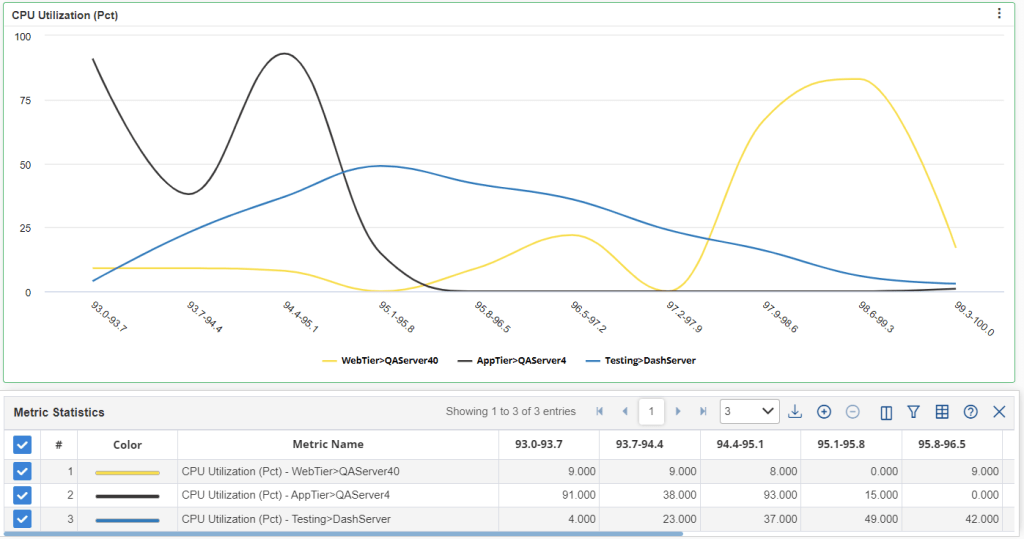
- Slab Count: Slab count graph is used to count the number of samples in a particular time interval.
- Category: The graphs belonging to this category are – Stacked area chart and stacked bar chart.
There are following chart types:
- Line: The charts displayed in the form of lines.
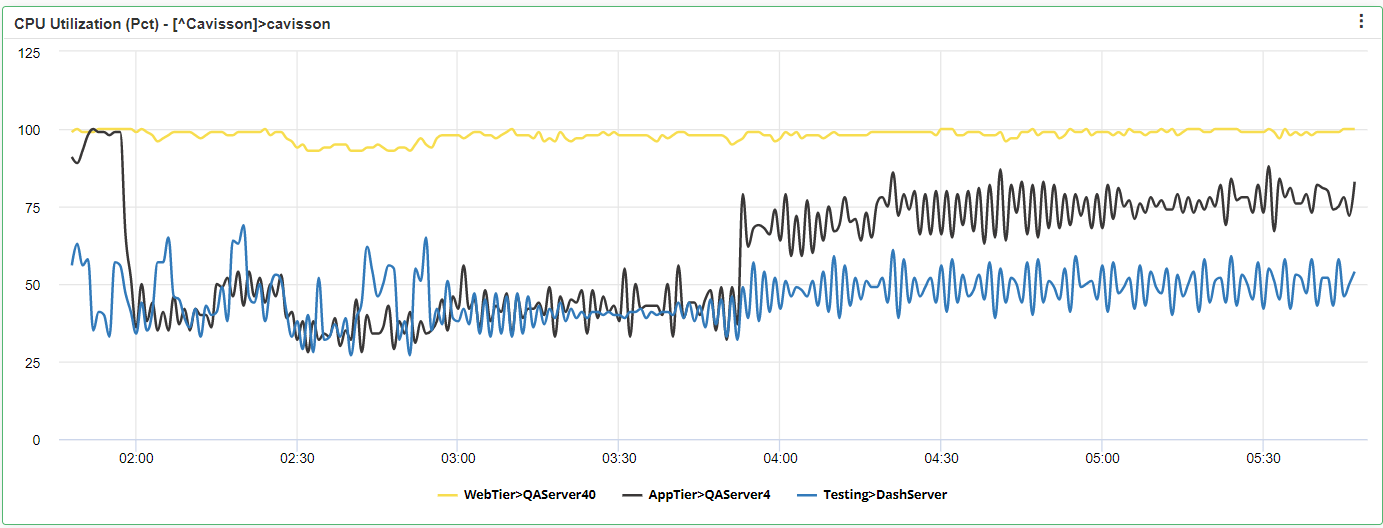
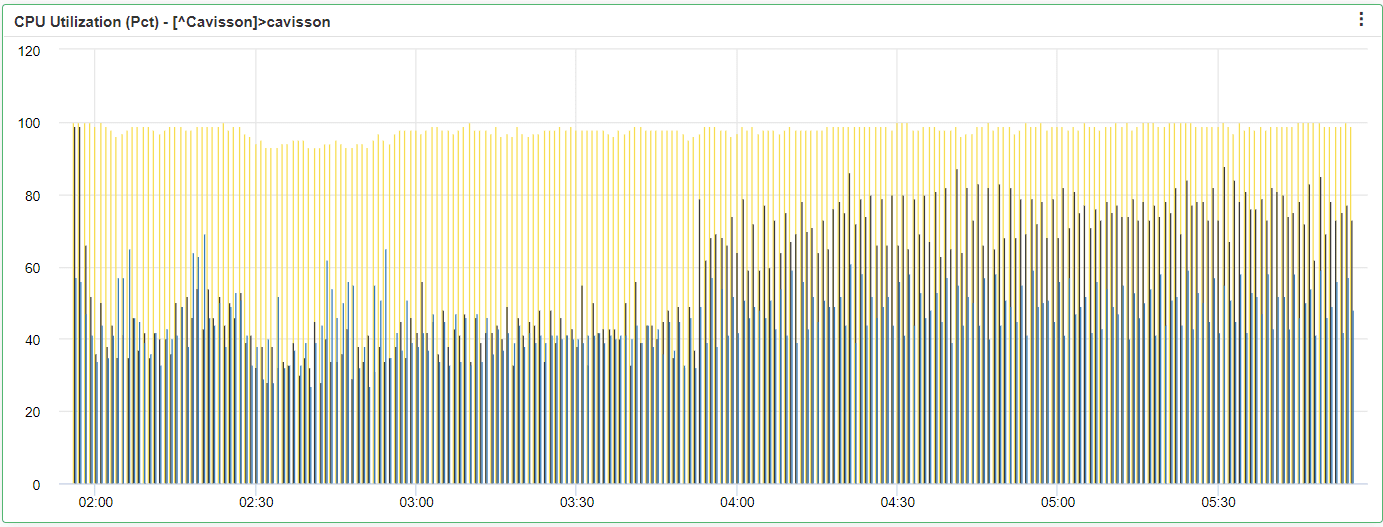
- Bar: In this case, the line chart is converted to Bars. You need to specify the criteria, such as: Avg All, Avg Top 5, Avg Top 10, or Avg Bottom 10.
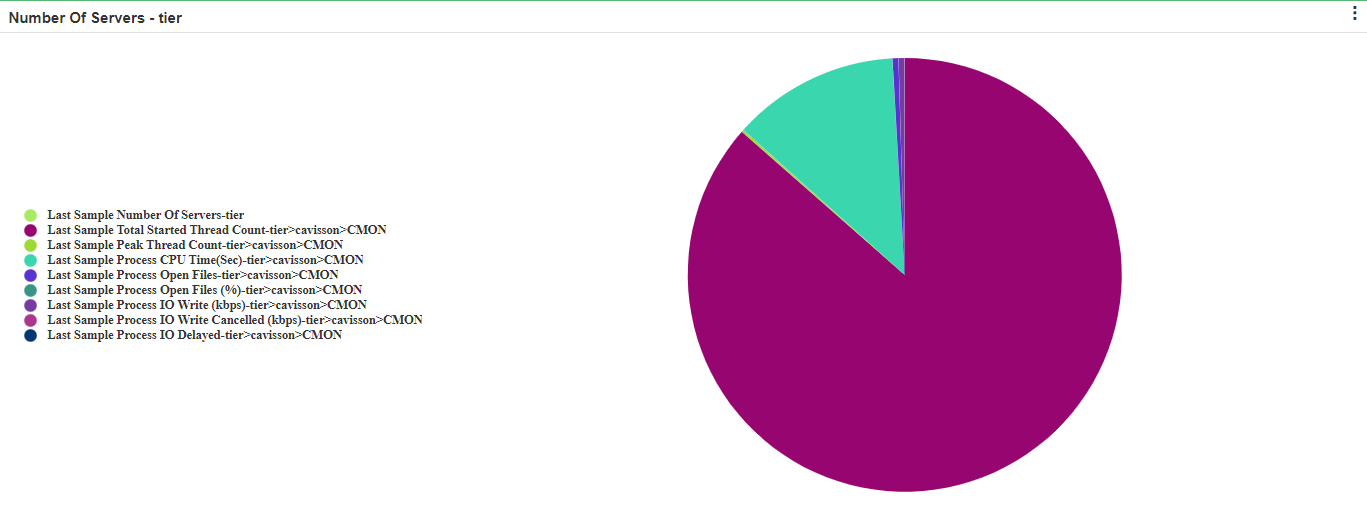
- Pie: It is useful in case of multiple graphs. If one graph is converted into Pie, then a simple circle filled with one color is displayed. It is needed to take the average value or Last value of the graph. If the graph type is cumulative then the system takes the last sample value otherwise the average value.
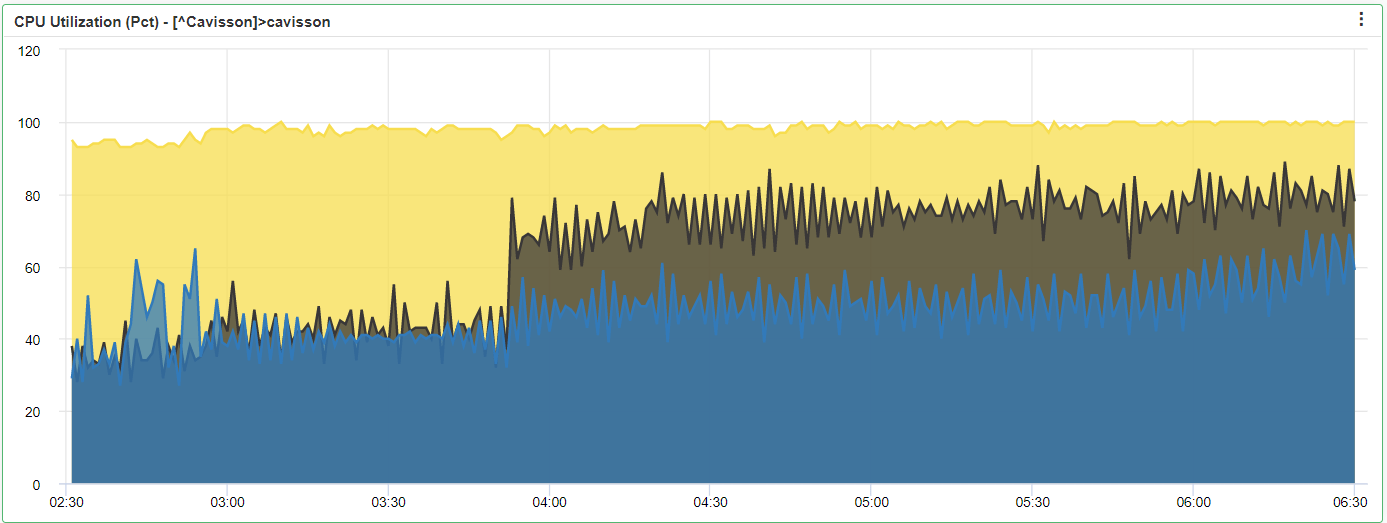
- Area: An area chart displays graphically quantitative data. The area between axis and line is commonly emphasized with colors and textures. Area chart is used to represent cumulative data using numbers or percentages over time. Use the area chart for showing trends over time among related attributes. The area chart is like the plot chart except that the area below the plotted line is filled in with color to indicate volume.
- Stacked Area: Stacked Area chart means the area chart of each graph is stacked on each other.

- Stacked Bar: In this case, the graph is converted to a Stacked Bar chart. Stacked bar chart means the bar of each graph is stacked on each other. It is useful in case of multiple graphs. If one graph is converted into a Stacked Bar, then it looks like a normal Bar graph.

- Dial: The purpose of Dial Graph is to analyses easily, the data in online mode how data variation is coming and to view samples of data in Dial Chart except Line Chart. Sample data is shown in the dial chart through Dial Tick Interval. You need to specify the criteria, such as By last value or By Avg value. You also need to set the properties, such as – Minimum, Maximum, Threshold, Warning, and Critical.

Meter: Purpose of the Meter graph is to analyses the data in online mode how data variation is coming and to view samples of data in Meter Chart except Line Chart. Sample data is shown in the meter chart through Dial Tick Interval. You need to specify the criteria, such as By last value or By Avg value. You also need to set the properties, such as – Minimum, Maximum, Threshold, Warning, and Critical.

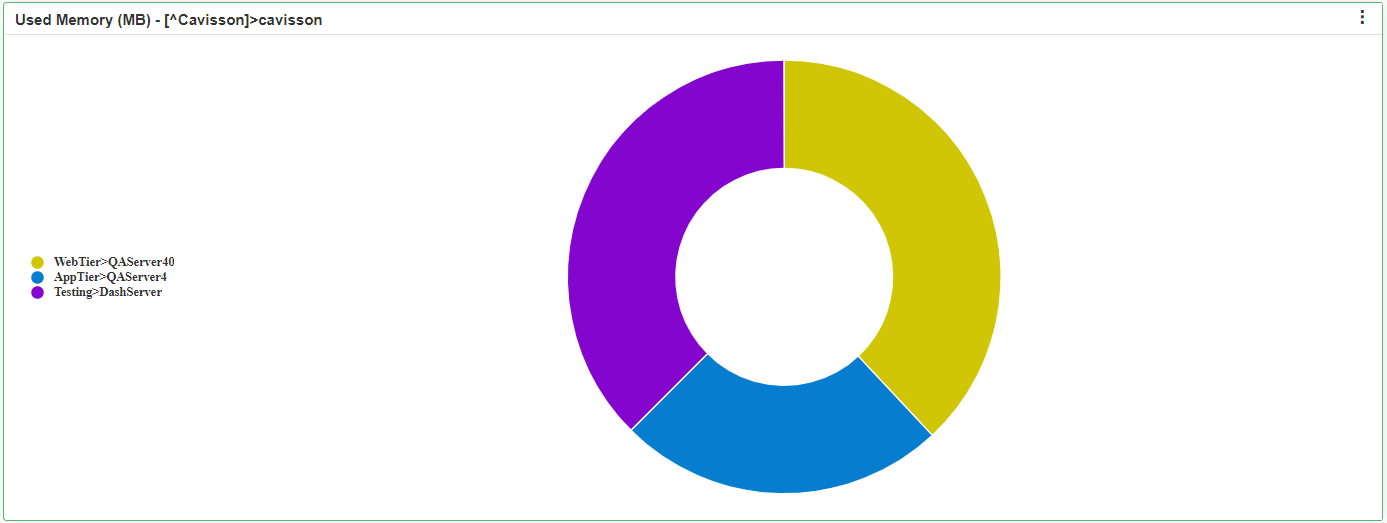
Donut: Donut chart is represented in the form of a donut. You need to specify the criteria either last or average.
- Dual Axis Line: Dual Axis Line is useful for comparing trends in two data sets whose numeric range differs greatly. A dual Axis chart allows you to summarize or plot two y-axis variables that have different domains. For example, you can plot the available memory on one axis and the free memory on another axis.
Note: You can edit the label of Y-axis in Dual Graph from Advance settings of Widget Setting.
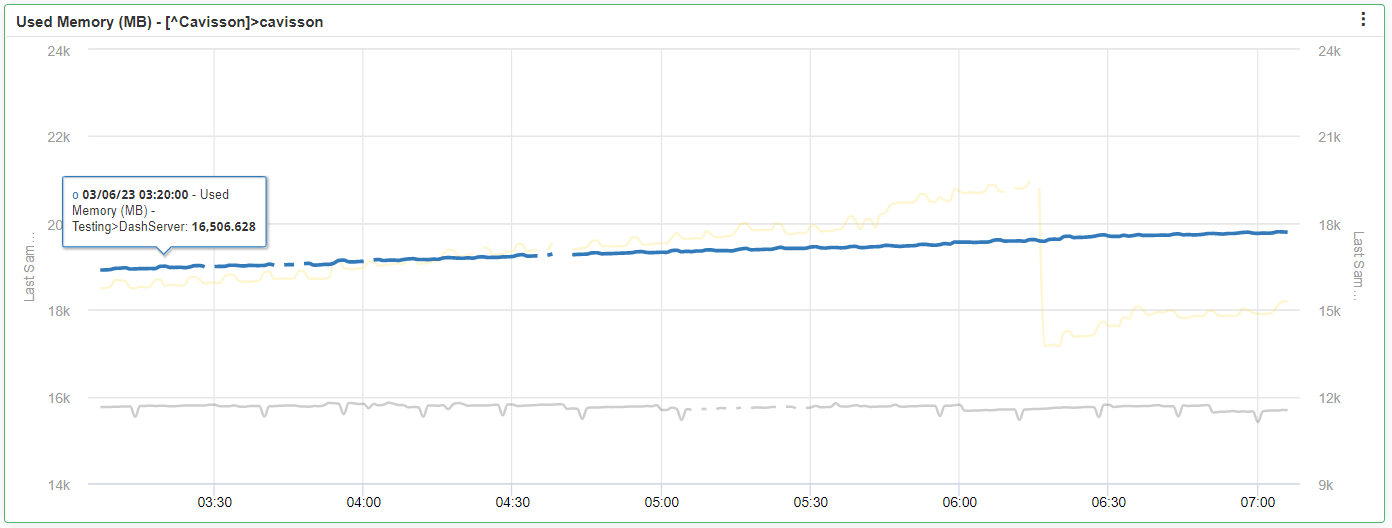
- Dual Axis Bar Line: A dual bar line allows you to summarize or plot two y-axis variables that have different domains. For example, you can plot the Available Memory on one axis with a Bar graph and the CPU Utilization on another axis with a line graph.
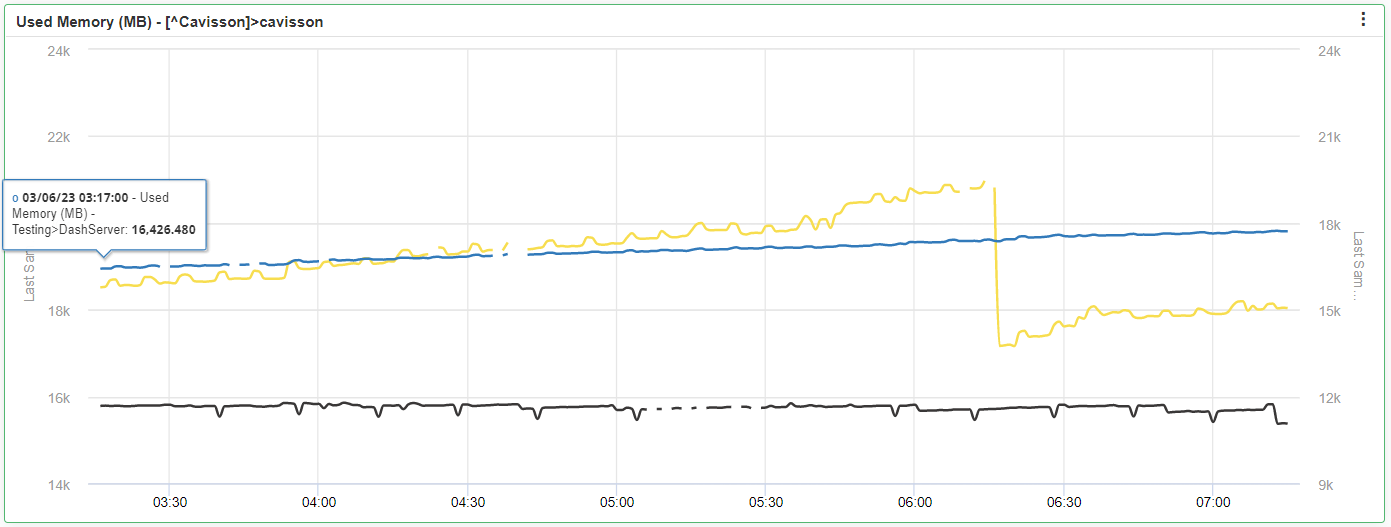
- Line Stacked Bar: If you want to see combined graphs of a stacked bar and line chart, then Line Stacked chart is used. In Line Stacked chart, first selected graph displays as line graph and other displays as Stacked bar graph.
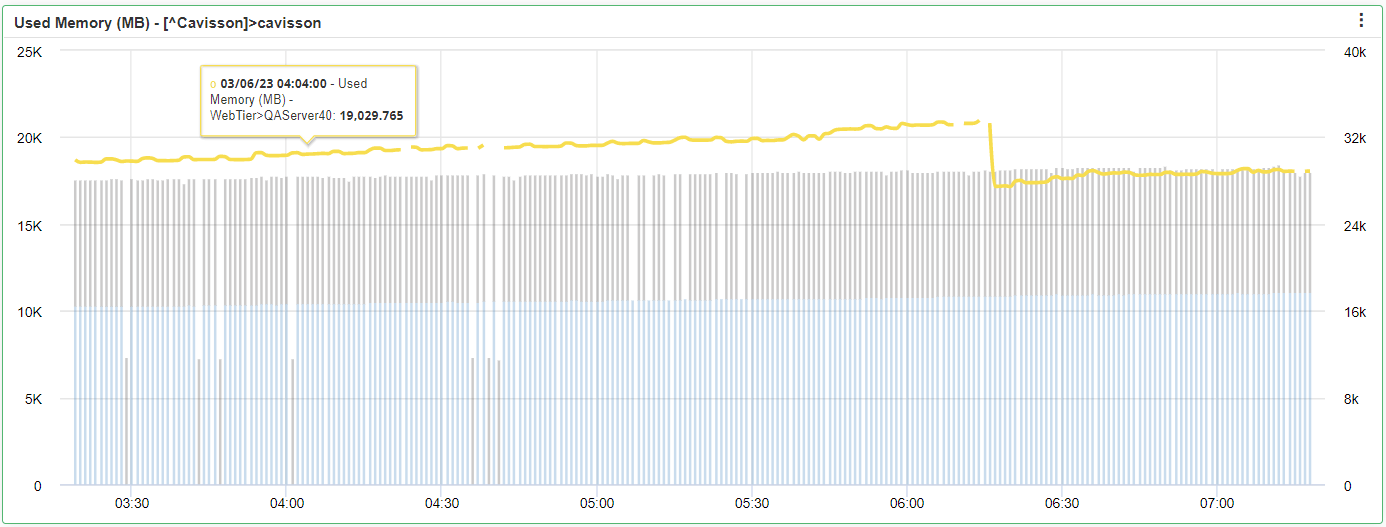
- Dual Axis Area Line: In this type of graph, one graph is displayed as an area chart and another graph is displayed as a line chart. It is also known as a multi-line area graph.

Formula Type: You can select the Data Field names, such as minimum, maximum, average, and sum count.
- Avg: Average value of all samples for selected time frame.
- Min: Minimum value of all samples for selected time frame
- Max: Maximum value of all samples for selected time frame
- Sum count: Sum count is the cumulative value of count of samples for selected time frame.
- c. Show Value: It will show the graph value in: Average, Count, Sum Count, Last Sample, Max, Min, Standard Deviation, Subject Count, and Sum.
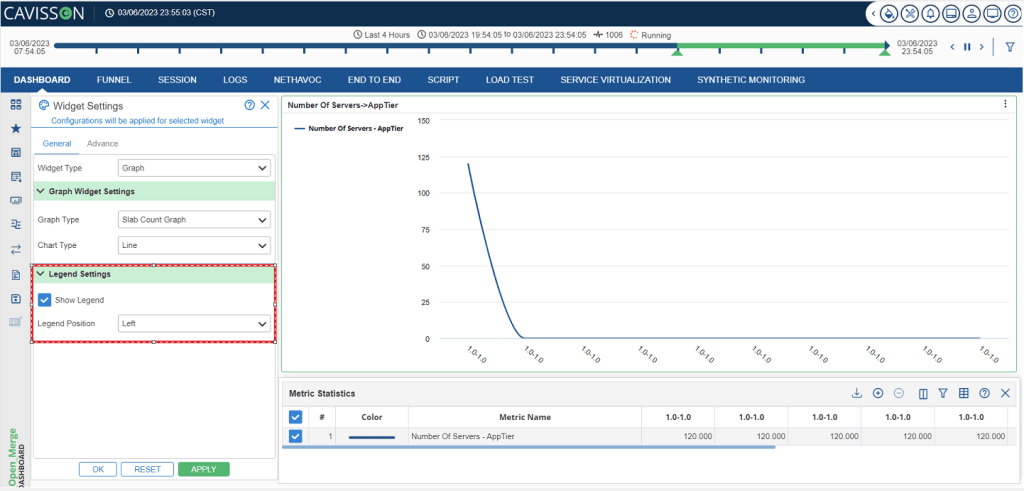
Legend Settings
This is used to set the legend position for graph(s) on a widget. To enable this, select the Show Legend checkbox and then select the legend position (left/right/bottom) from the drop-down list. In this example, we have selected Legend Position – Left.
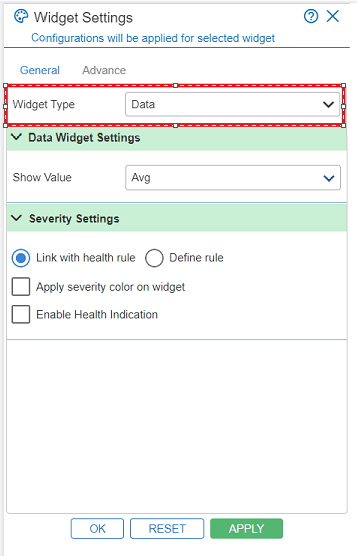
Data Widget Settings
Show Value: It is the criteria of the data field. The available options are as follows:
- Average
- Last Sample
- Maximum
- Minimum
- Sample Count
- Standard Deviation
- Sum
- Vector Count
Severity Settings
In severity settings, the user has two options:
- Link with Health Rule: This option will link the severity settings with the health rule. It has following two checkboxes:
- Apply severity color on widget: If a user selects this checkbox, the severity color will be applied on the widget.
- Enable Health Indication: If a user selects this checkbox, the health indicator will be enabled on the widget.
- Define Rule: This option is used for defining a rule.
Note: The above two checkboxes are common for both the rules. In case of Define Rule, the user has to select the Metric Health Operator from the given drop-down and also needs to enter the Critical, Major and Minor values.
· Once you have selected the values for all the respective fields, you have to click on the Apply ![]() button, to apply the widget settings.
button, to apply the widget settings.
· You can also reset the widget settings window by clicking on the Reset ![]() button.
button.
· To close the Widget Settings window, click on the Ok ![]() button.
button.
Widget Type – Label
Label widget type is used to create a blank widget with just a label in it. The main purpose of this widget type is to provide a heading / title to a group of widgets and place those widgets below this label widget. Further to this, you can perform formatting on the created label widget, such as: bold, italics, underline, font size, font color, text alignment, and many other formatting.
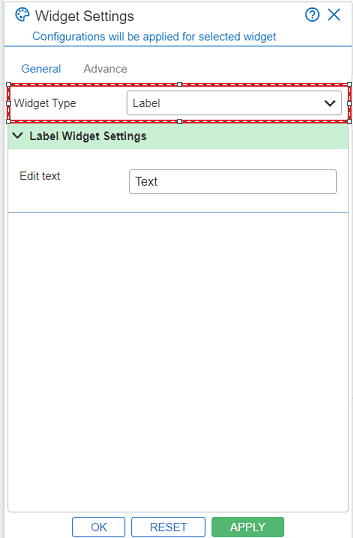
Example:

Widget Type – Tabular
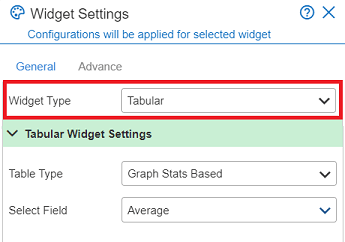
On selecting Tabular as Widget Type, you need to select the following options:
- Table Type: The available options are:
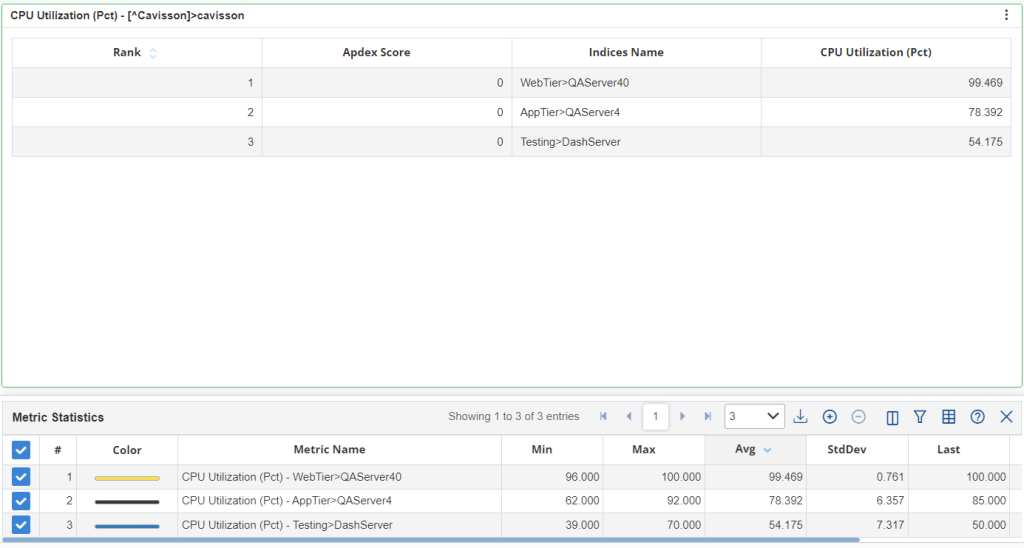
- Graph Stats Based: It displays the exact value on the graph panel that is displayed on the lower panel. These can be configured by the Select Field drop-down list (such as: average, max, min, and so on).
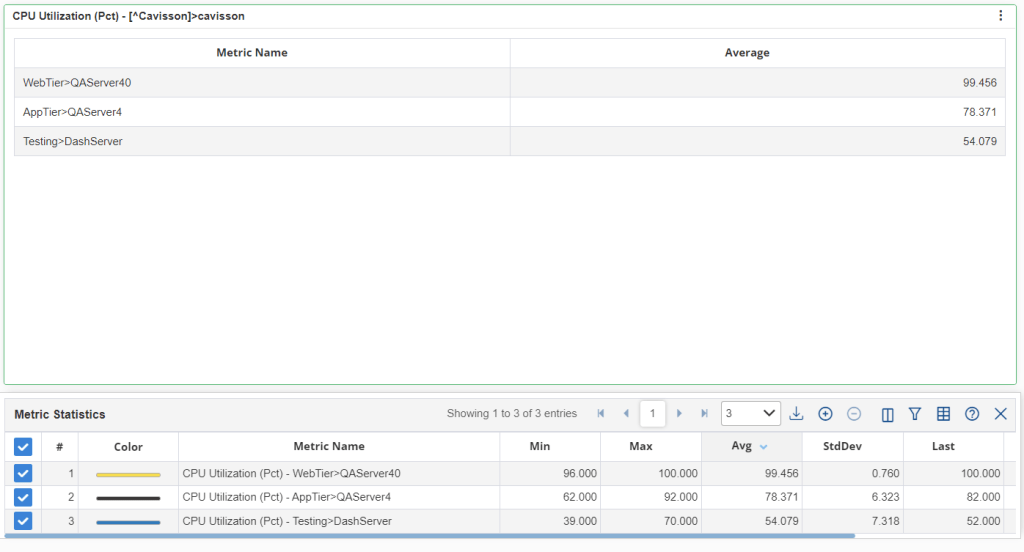
- Vector Based: This displays the graphs based on the rank and score of the graphs. Rank is given on the basis of sorting vector names.
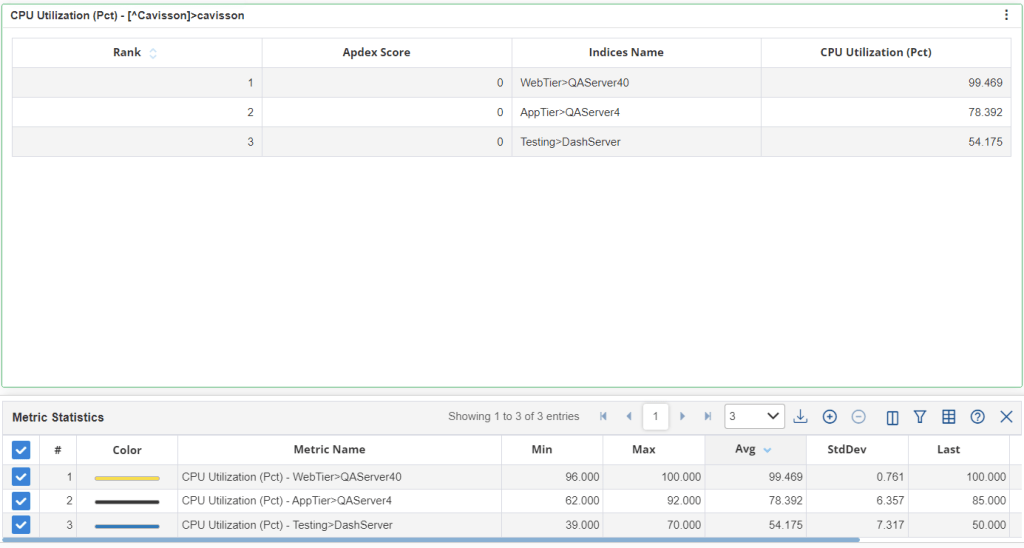
Notes:
- In case of Graph Stats Based table type, select the fields, such as: Average, Last Sample, Maximum, Minimum, Sample Count, and Standard Deviation.
- In case of Vector-Based Stats, you can enable the view of Rank and Score.
Example
Advanced Settings- Graph Widget
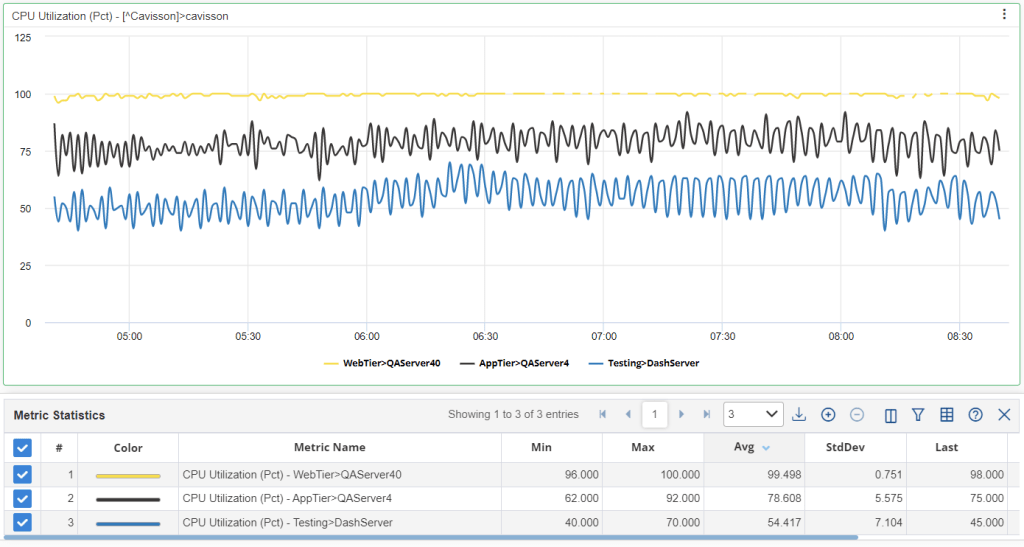
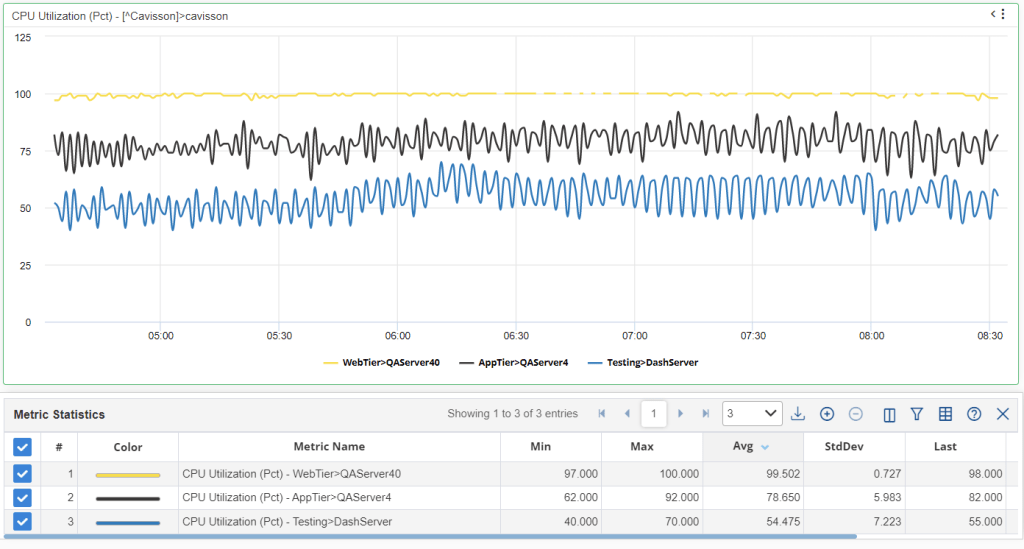
Widget Delay Time
Dashboard can shift back all the data points of all the metrics present on the selected widget by a specified amount of time. There are many environments where the data scraping is not instantaneous and when monitors fetch the data, we get a few minutes of old data at the current time.
This feature is useful for visualizing the data for the metrics where data is coming with some delay and using this feature user can shift back their data to match with the delay applied in the monitors.
E.g. if there is a delay of 10 minutes in fetching data from the data source through monitors, then the data for a duration of say 11:10 – 12:10 hours will be ingested in our time series database with their actual time period of 11:00 – 12:00 hours, and if the user has applied the time period of 11:10 – 12:10 hour, then after applying the shift back time of 10 minutes they will see the data for the time duration of 11:00 – 12:00 hours.



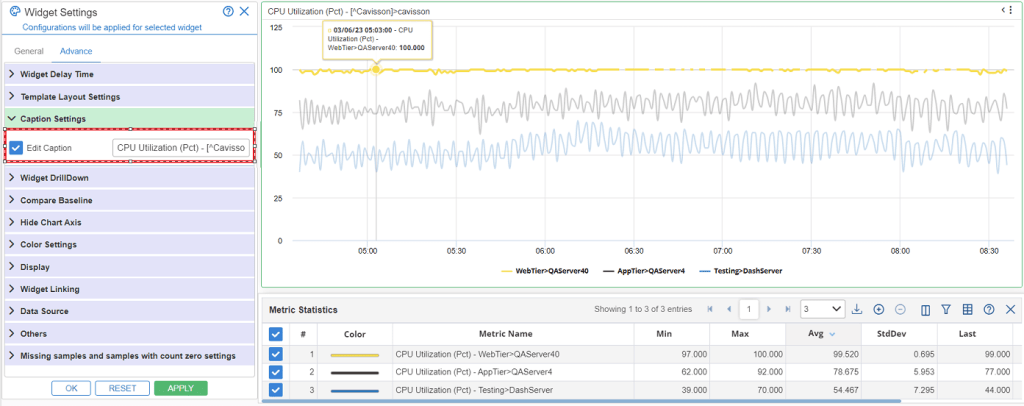
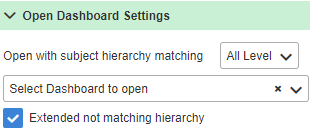
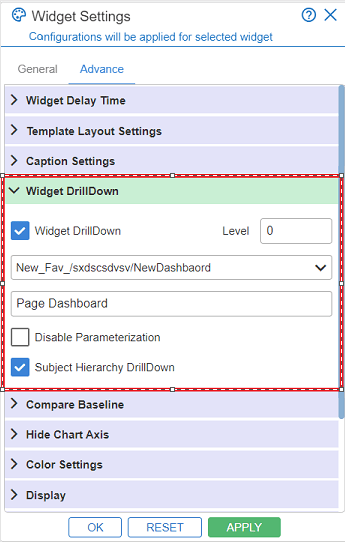
Compare Baseline
According to the baseline, it creates three lines CRITICAL, MAJOR, and MINOR. For Fixed Trend in Auto Baseline, you can only plot ‘Line’ chart in a widget for a given graph data range by setting Critical, Major, and Minor Baseline values from the Widget Setting window. You can set these values and can save them as a favorite. It also works with zoom charts.

Note: In Auto Baseline, other options are ‘weekly’ and ‘daily’ trends at widget level. In weekly mode, comparison is done on all the graphs with data of the previous week for the same graphs, in the same time frame. Similarly, in the daily trend mode, comparison is done with the previous day data.
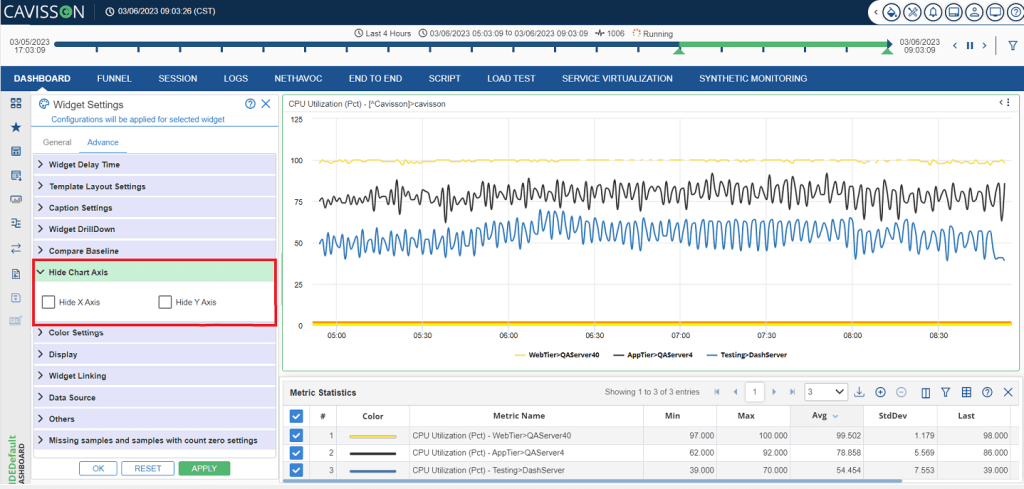
Hide Chart Axis
You can hide the X axis and Y axis of the charts in the widget based on your requirements.

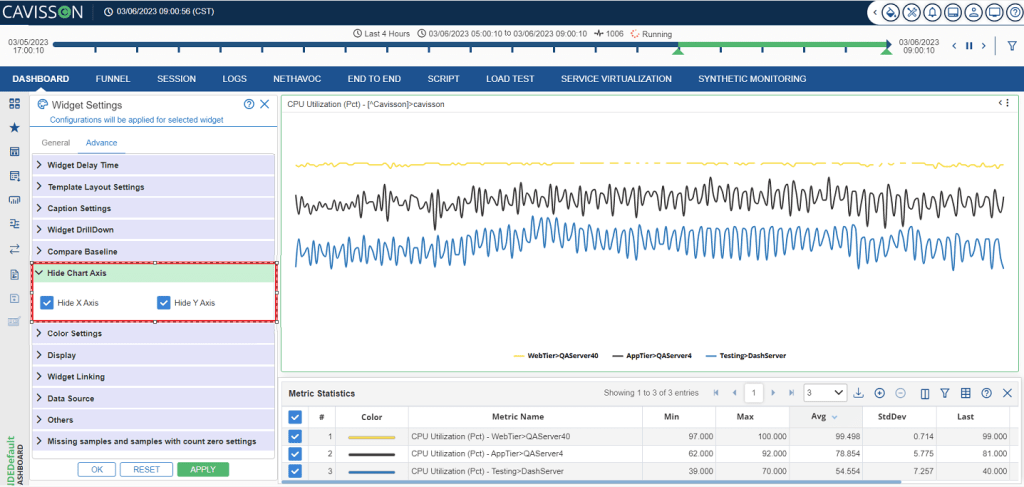
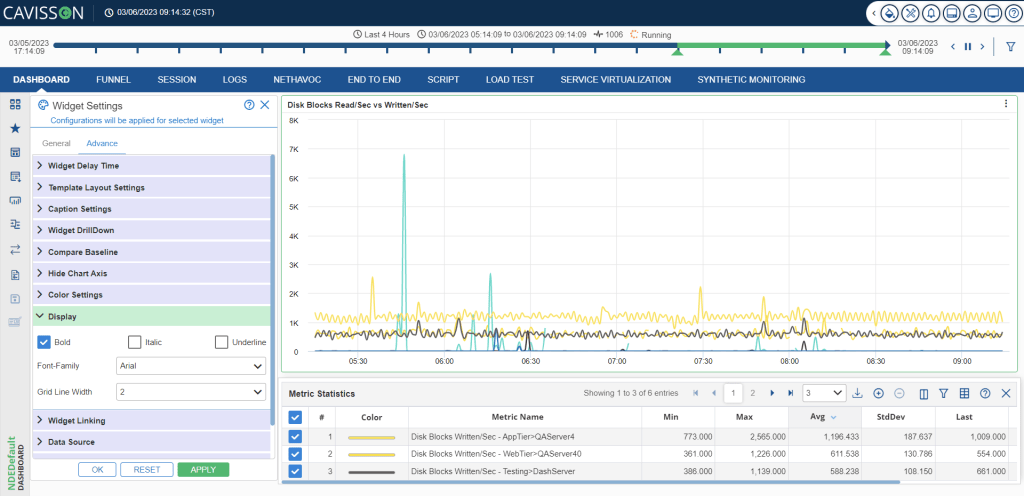
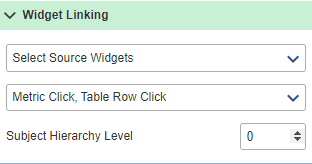
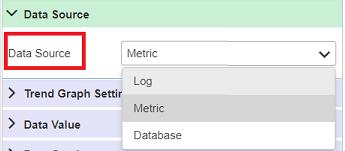
- Metric: This value is used to get data from the Dashboard. In case of metrics, you need to select the Graph Type from a list of available options.
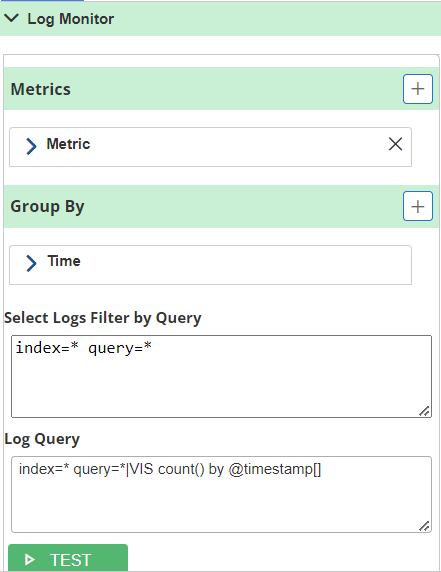
- Log: This value is used to get data from NetForest. In case of Logs, you need to specify the query for fetching logs.
- Database: This value is used to get data from the Dashboard. In case of data source, you have to select the type of the database to be used.
Note: Once the user has selected the Logs Filter by Query and have entered the Log Query, the user has to click on the Test button in order to get the response for the corresponding query.
Others

Template layout Settings
For details refer Template Layout Settings.
Open Dashboard Settings
Refer to Open Dashboard Settings.
Widget Linking
Refer to Widget Linking.
Data Source
Refer to Data Source.
Trend Graph Settings
Trend graph shows aggregated any specified statics data (Avg/ Min/ Max/ Last/ nth Percentile) value of all measurements and draws a graph of any type. Trend graph shows the metric in the widget for the selected time period.

Others
Refer to Others.
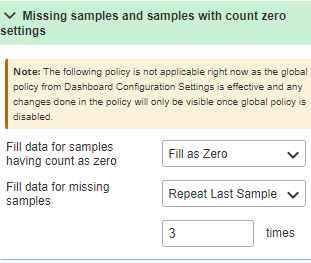
Missing Samples and samples with Count zero
Refer to Missing Samples and samples with count zero settings.
Advanced Settings- Label
Template Layout Settings
Refer to Template Layout Settings.
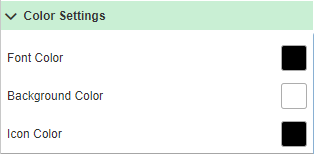
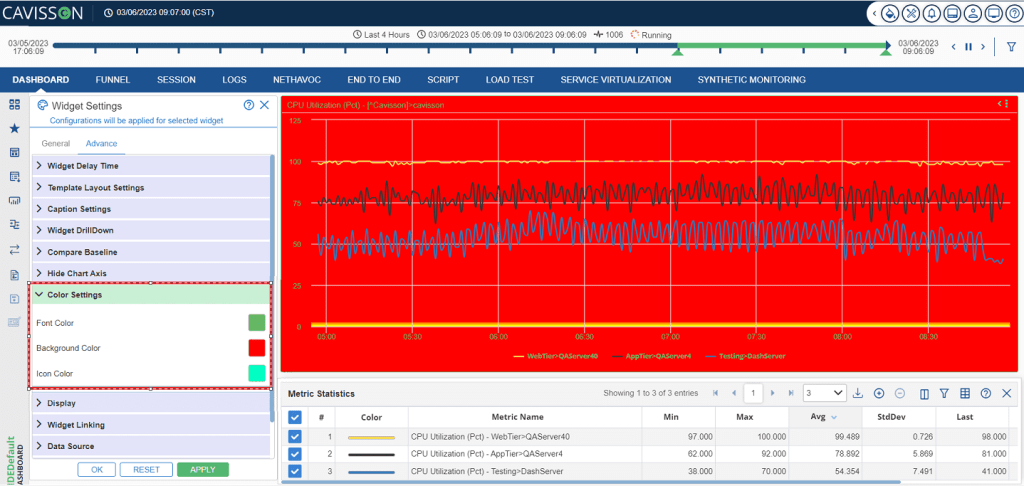
Color Settings
Refer to Color Settings.
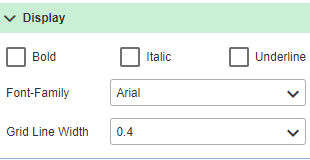
Display
Refer to Display.
Advanced Settings- Tabular
Template Layout Settings
Refer to Template Layout Settings.
Caption Settings
Refer to Caption Settings.
Open Dashboard Settings
Refer to Open Dashboard Settings.
Color Settings
Refer to Color Settings.
Display
Refer to Display.
Widget Linking
Refer to Widget Linking.
Data Source
Refer to Data Source.
Others
Refer to Others.
Show Metric Data
The graph data is displayed for the specified time period with information, such as sample time, and details of that particular graph.
- To navigate to the pages, use the navigation button displayed at the bottom.
- You can also download the graph data in various formats such as: PDF, Excel or Word.
- You can apply filters on columns, by clicking on the Toggle Columns option and can configure which columns to see and hide.
- You can see the Sample Interval Time along with Session Number and Average Count, by clicking on the Sample Interval Time
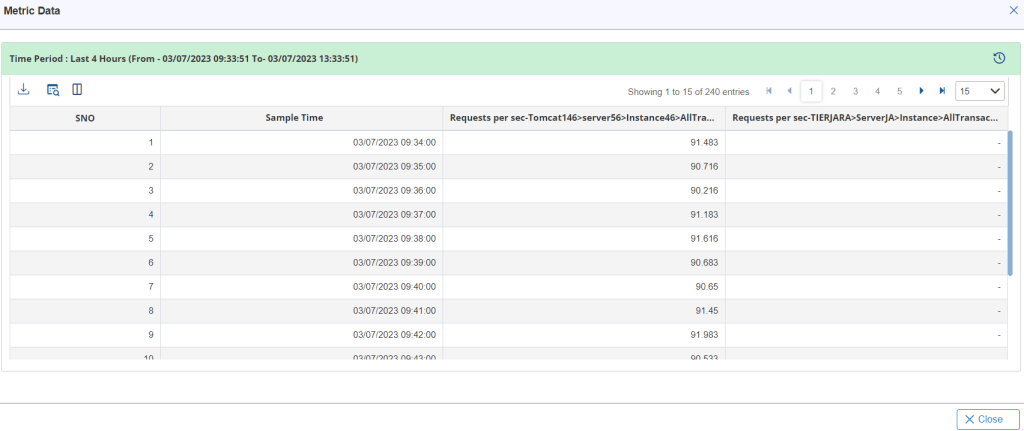
Note: To close the window, click on the Close button.
Page Dashboard
Using this feature, we can get all the other pre-bundled dashboard lists to have the same Attributes information. This feature provides us with an auto-suggested pre-bundled dashboard list for the selected graph in the widget, allowing the user to drill down any dashboards.

Overlay Events
Overlay event allows displaying stats of the generated alert in the graphs. We can get the alert events from Alert History. Based on its time stamp, you get annotations on the graph, to show the different types of Alerts (Critical / Major / Minor).
There is different representation for different type of Alerts:
- Tulip colored Background for Critical Alerts.
- Pale Red Colored Background for Major Alerts.
- Misty Rose colored Background for Minor Alerts.
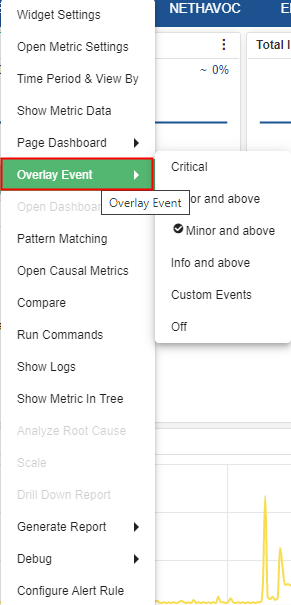
Viewing Overlay for Alerts
- By clicking on widget panel there we have an option of Overlays event.
- On further clicking Overlays event widget panel, we have following options.
- Critical
- Major and above
- Minor and above
- Info and above
- Custom Events
- Off
Critical
It will overlay critical events (on the same metric/metrics and subject being shown as graphs) on the graph for the duration which is applied on the Dashboard. Tulip colored Background will be get highlighted for the critical overlay event.
Major and above
It will overlay major events along with critical events (on the same metric/metrics and subject being shown as graphs) on the graph for the duration which is applied on the Dashboard. Pale red colored Background will be get highlighted for the Major overlay event and Tulip colored Background will be get highlighted for the critical overlay event.
Minor and above
It will overlay minor events along with critical and major events (on the same metric/metrics and subject being shown as graphs) on the graph for the duration which is applied on the Dashboard. Misty Rose colored Background will be get highlighted for the Minor overlay event, Tulip and Pale red colored Background will be get highlighted for the critical and Major overlay event respectively.
Info and above
It will overlay Info events along with critical, major, and minor events (on the same metric/metrics and subject being shown as graphs) on the graph for the duration which is applied on the Dashboard.
Custom events
All the havoc events and Custom events will available here. In the case of custom, a new window will open. In this two types of events are shown:
- Rule Based Events: It will overlay Rule Based Events based on their severity (on the same metric/metrics and subject being shown as graphs) on the graph for the duration which is applied on the Dashboard. Rules based events are configured on basis of their severity i.e; critical, major, minor, and info.
- Custom events: All the havoc events and Custom events will available here. On the basis on their severity it will overlay.

Off
It means there will not be any overlay events on the graph for the duration which is applied on the Dashboard.
Pattern Matching
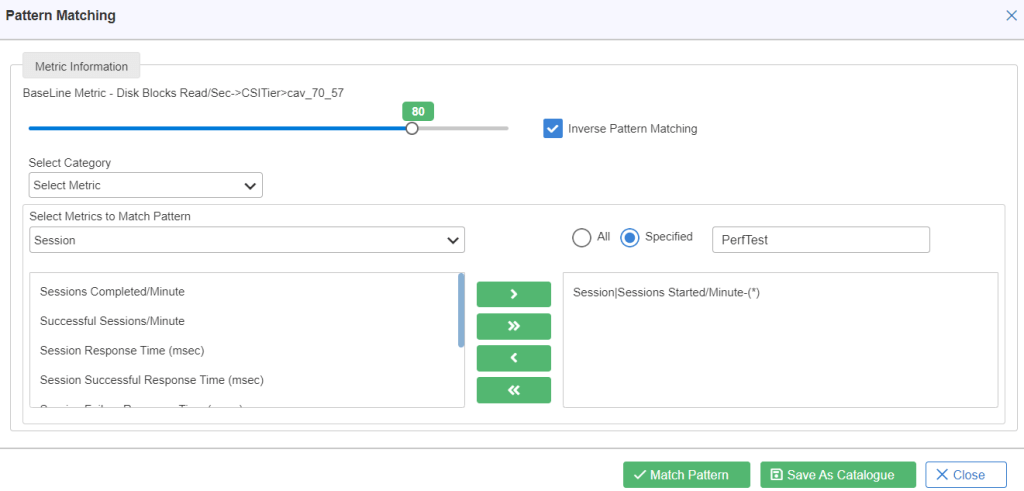
Pattern-Matching describes the degree of relationship between the metrics on the basis of threshold value. It finds and displays those metrics which are having the same pattern.

- Metric Information: It shows the baseline metric present on the panel, with which pattern- matching has to be done.
- Threshold: It is percentage value to recalculate deflection.
- Inverse Pattern Matching: Enable this checkbox to find deflection on both sides or one side.
- Select Category: In select category, there are following options a user can select from the drop-down which are listed below:
- Select Metric: You can select a specific group and correspond to that metric accordingly.
- Select Metric Catalogue: Shows all the catalogue previously saved.
- All Metrics: You can select all groups and correspond to that metric accordingly. In this metric, you can Skip Graph Type for either Cumulative or Response Time Graph.
- Auto Select Casual Metric: You can select a metric which is related to AIOPS.
- Select Metrics to Match Pattern
- Select Metric Name: All the metric names are listed in this drop down.
- Left text field area: All the metric names for the selected metric are displayed.
- Right text field area: Selected metric name from the left text field area is displayed.
- >>: It Adds the selected metrics.
- <<: Removes the selected metric name in the right text field area.
- Match Pattern: Matched metrics are displayed in the Dashboard window as shown in below Figure 200.
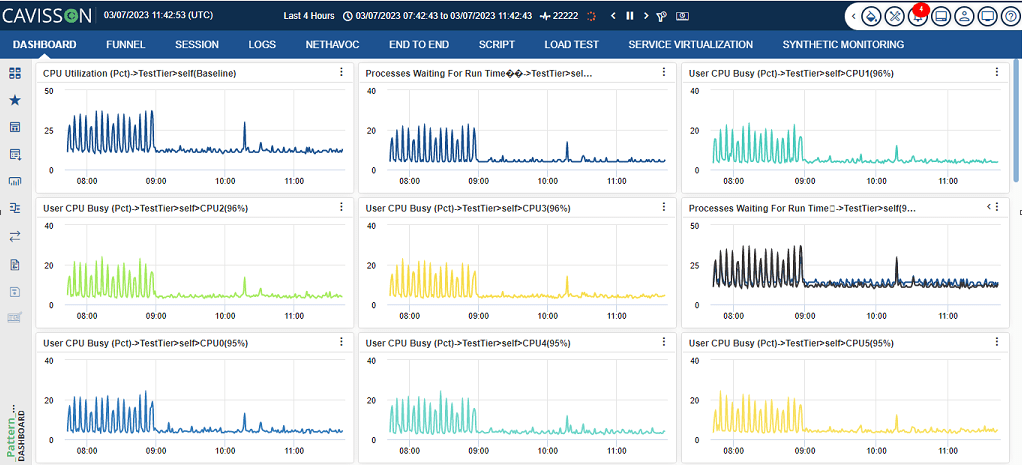
- Save as Catalogue: You can select multiple metrics and save them as a catalogue.
- Save Catalogue: After providing the Catalogue Name & Catalogue Description, and saving it, the Catalogue is saved by the provided name and the same is reflected in the Catalogue Management Window under Manage Catalogue.
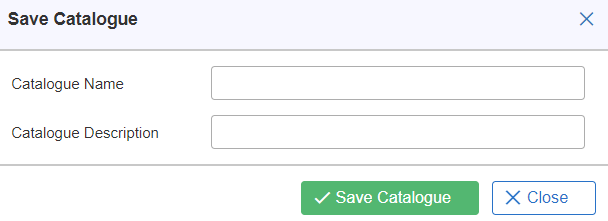
Note: A user has to Save a catalog first in order to execute the pattern matching option. For saving a catalog, the user has to click on the Save as Catalogue ![]() button, and fill the catalogue name and catalogue description.
button, and fill the catalogue name and catalogue description.
Window with Vector Group Selected: Two options are available for selecting indices – ALL and Specified.
- ALL: If ALL is selected, the Available Indices option is not displayed.
- Specified: If Specified is selected, the Select Indices link is enabled which opens a new window. If the selected metric is of vector type, a window is displayed to select vectors.
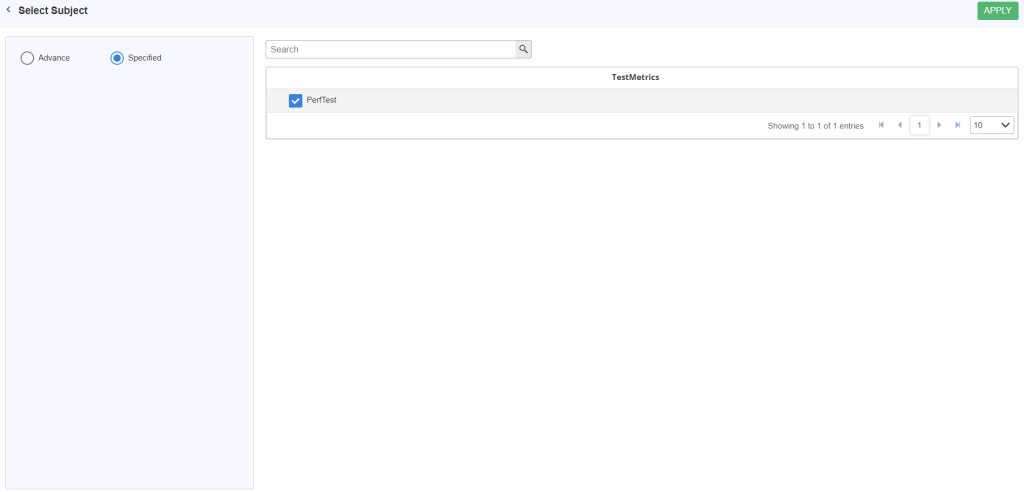
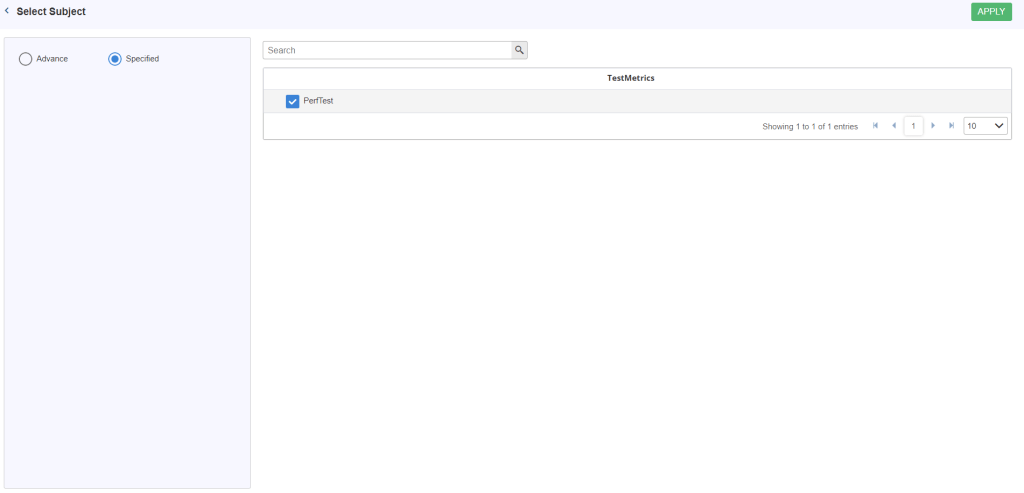
Specified Indices Selection Window: On click of the specified radio button, “Specified Indices Selection” window is displayed as shown in below Figure 203. This window contains two Tabs – Specified and Advanced which asks whether specific indices should be applied for all metrics or different indices (Advanced) for different metrics.
- Specified: If the Specified tab is enabled, then there is an option to select vectors. Specified tab contains the following buttons:
- ADD: Selected “available indices” is displayed in the “specified indices” text area.
- Remove: Selected indices are removed from “specified indices” text area.
2. Advanced: Contains option to select vectors on the basis of pattern. Advanced tab contains the following fields:
- Tier: Select the tier from drop down. In this option, user can select any one of the following:
a. ALL
b. Select Pattern
c. Cavisson
- Server: Select server from the drop down. The user can select any one of the following:
a. ALL
b. Select Pattern
c. Cavisson
- TSDB Node: In this option, the user has to select the TSDB node for the specified server. The user can select any one of the following:
a. ALL
b. Select Pattern
c. TSDBNode1
- Frequency: In this option, the user has to specify the time interval within which the data will come.
Note: Once the user has selected all the fields, they have to click on the Test button in order to get the data.
Delete: On clicking Delete ![]() in the Pattern Matching dialog box, the saved catalogue is removed from the catalogue list.
in the Pattern Matching dialog box, the saved catalogue is removed from the catalogue list.
Edit: It updates the existing catalogue which has been loaded for update. On click of the Edit button, the Catalogue management window is displayed with the following attributes:
- Name: Enter the name in the text box.
- Description: Enter the description in this text box.
- Select metric type: It contains two options. To select any metric type:
- Normal: To select the Normal radio button, Normal metric fields are enabled. You can add the metric.
- Derived: To click on the derived radio button, the derived metric is displayed.
- Select Graph (s): Click the Group name and select any metric in the left side of the text area and click >> to append in the right side of the text area.
- ADD: On click of the add button, graph is added in tabular format.
- Update Catalogue: You can update the catalogue successfully.
Sample Output

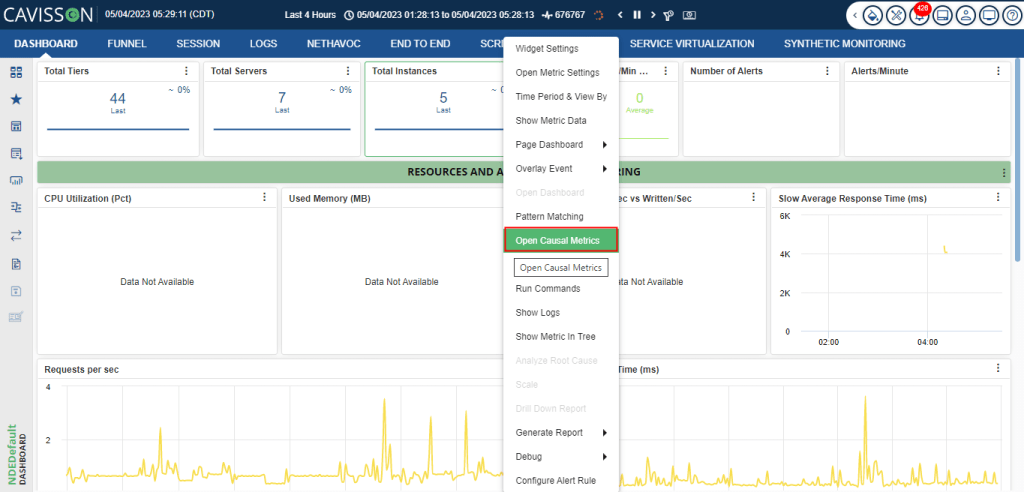
We have “Open Causal Metrics” in Widget Settings. It hits the AIOPs server to get the Causal metrics and applies pattern matching with default threshold i.e. 80%.
After getting the response from the AIOPs server, we validate all the metrics and add proper subject tags for the Causal metrics.
For Example
- If the subject level of the baseline metric is T1 > S1 > P1 > BT, the graph is TPS, and AIOPs server provided the affected metrics that is CPU Utilization.
We make a proper subject tag for CPU Utilization that is T1 > S1. - If the subject level of the baseline metric is T1 > S1, the graph is CPU Utilization. And AIOPs server provided the affected metrics that is We make a proper subject tag for TPS that is T1>S1>*>*.
If AIOPs does not provide any Causal metrics, then we will apply pattern matching using all the groups and graphs that are present in the hierarchy or subject level of baseline metric.
For Example:
- If the subject level of the baseline metric is T1 > S1, then we will consider all the groups and graphs that are present in T1 and T1 >S1.
- If the subject level of the baseline metric is T1 > S1 > P1, then we will consider all the groups and graphs that are present in T1, T1 >S1 and T1 > S1 > P1.
Support AIOPS in Pattern Matching
We have one more drop-down option “Select Causal Metrics using AIOPS”. After selecting this option, the AIOPs server will provide the Causal metrics in two parts i.e effects and causes. Until AIOPs server does not respond and is in pending state, “Match Pattern” button in Pattern Matching window will be disabled with the loading state.
Widget does not contain any metric then it will show a message “Not able to do pattern match using AIOPS, please drag a graph from tree”.
A favorite will open with baseline metric as a base for all the Causal metrics that are provided by AIOPs server i.e. causes and effect:
- Causes and affected metrics will be separated by a strip.
- First, we will show the causes and then the affected metrics in the favorite.
If the response from AIOPs server is empty i.e. there are no effects and causes found by AIOPs, then we will apply pattern matching using all the groups and graphs that are present in the hierarchy or subject level of baseline metric.
For Example:
- If the subject level of the baseline metric is T1 > S1, then we will consider all the groups and graphs that are present in T1 and T1 >S1.
- If the subject level of the baseline metric is T1 > S1 > P1, then we will consider all the groups and graphs that are present in T1, T1 >S1 and T1 > S1 > P1.
Compare
For details refer to Compare.
Run Commands
It is used to run commands on the server from the UI itself.
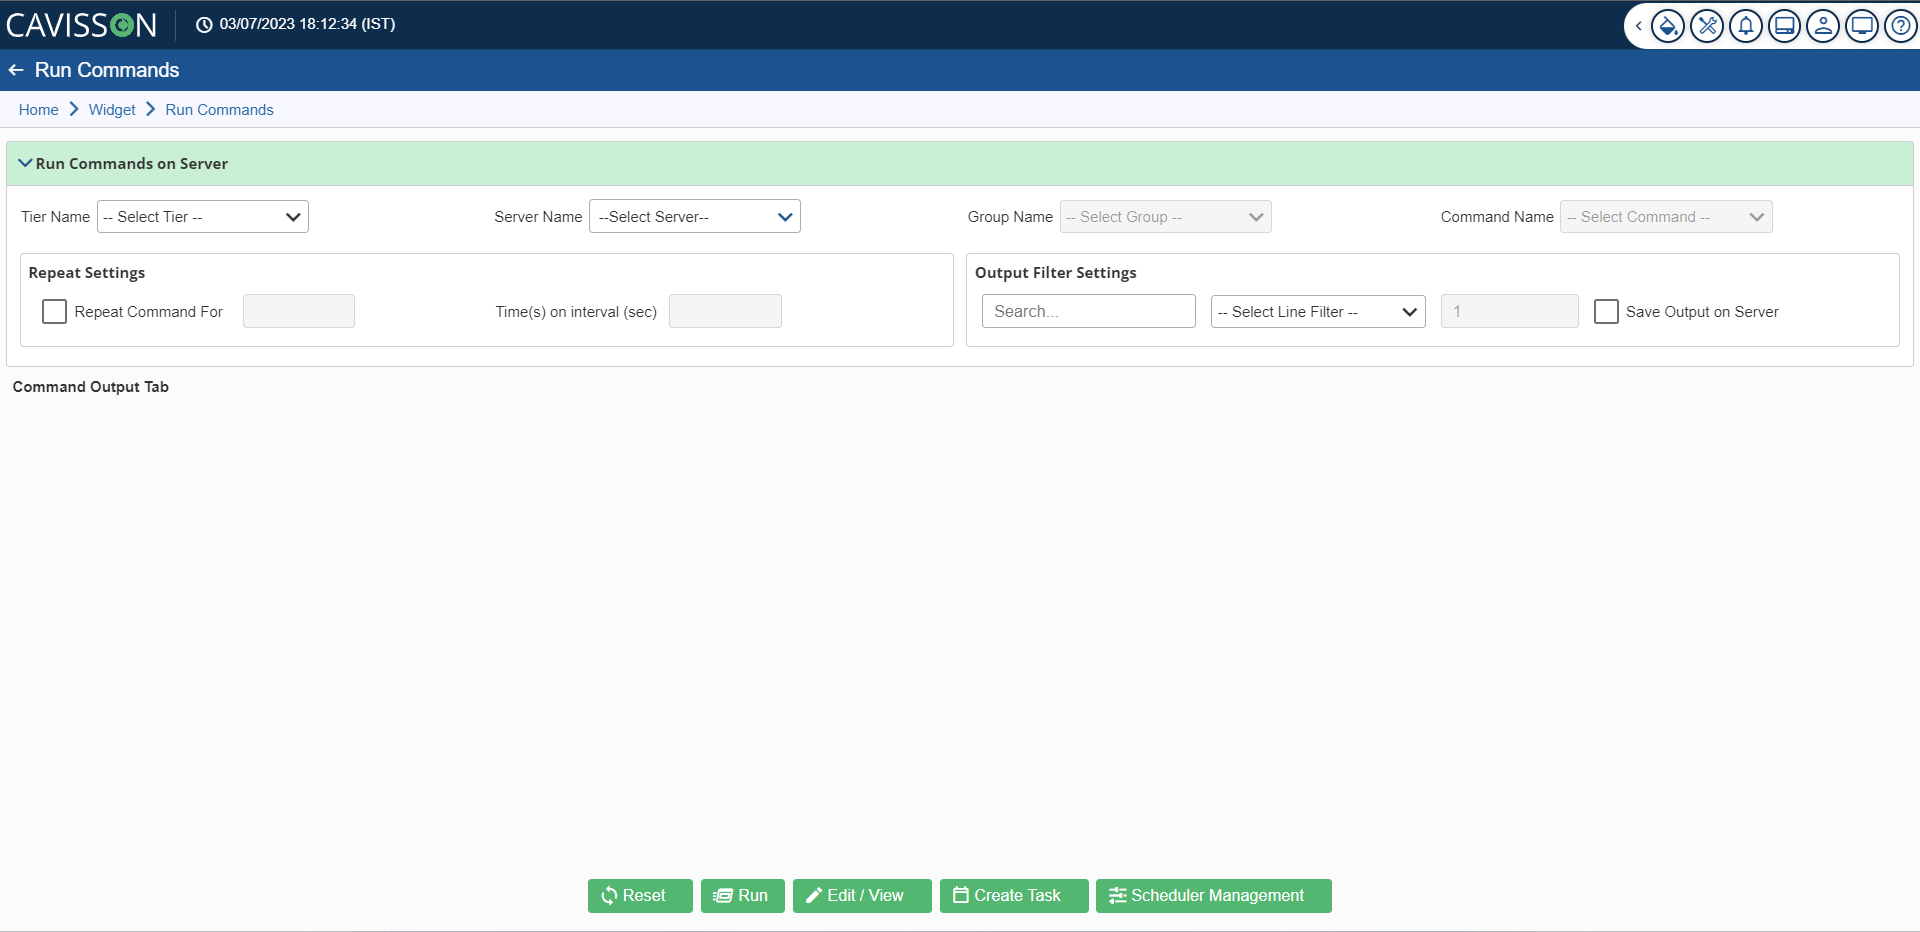
Run Command on Server
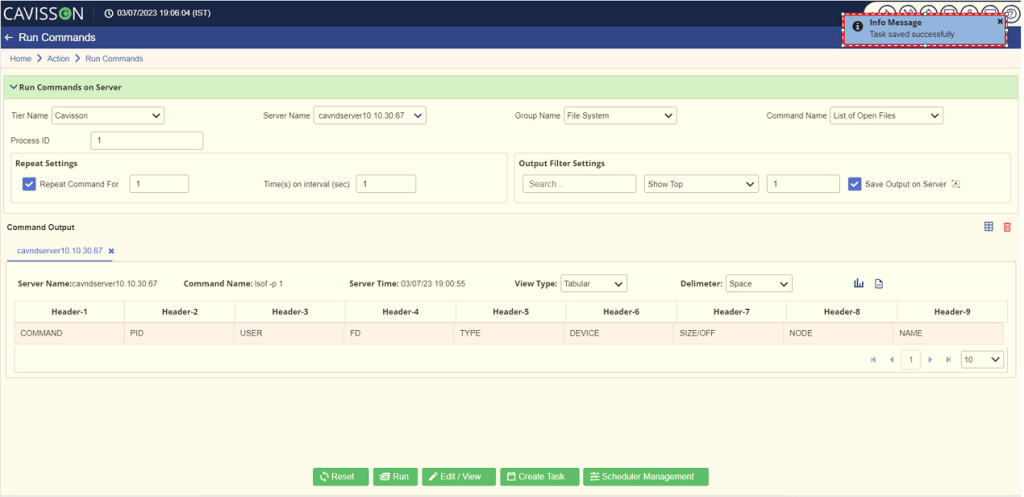
- Select the tier name, server name, group name, and the predefined command name that you want to run on the server. You may also need to mention some additional details based on the selection. To run a custom command, select Custom Group in the Group Name, select Custom Command in the Command Name, and enter the command.
- In the Repeat Setting, you can mention how many times you want to repeat the command and at what interval/frequency (in seconds).
- In the Output Filter Settings, you can mention the filter criteria and select whether you want the top rows or the bottom rows along with the count. You can also save the output on the server.
- Click the Run
 button, the command gets executed and the output is displayed in the Command Output section along with several other details, such as server name, command name, server time, and view type (text/ tabular). In the tabular format, you can also specify the column delimiter (such as space, tab, pipe). The output is segregated in various headers based on the delimiter selection.
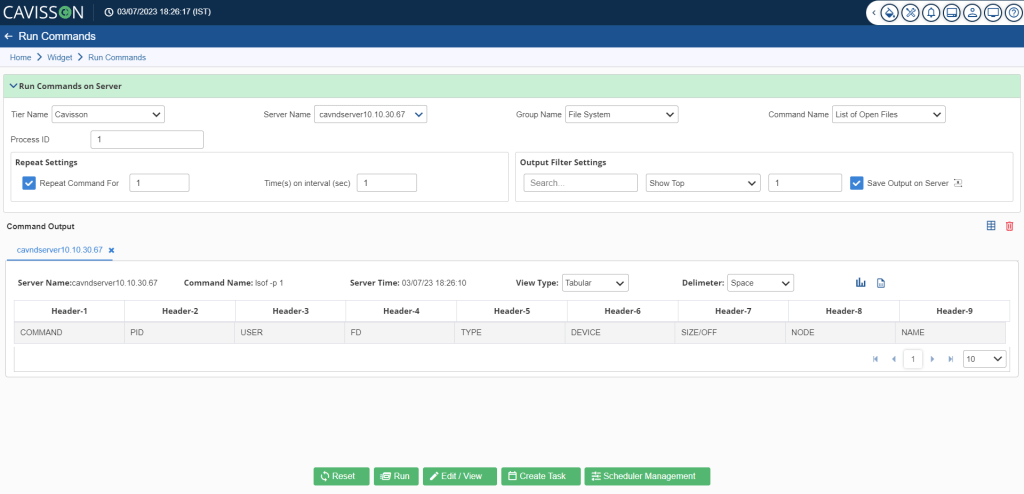

The downloaded Excel format is as follows:

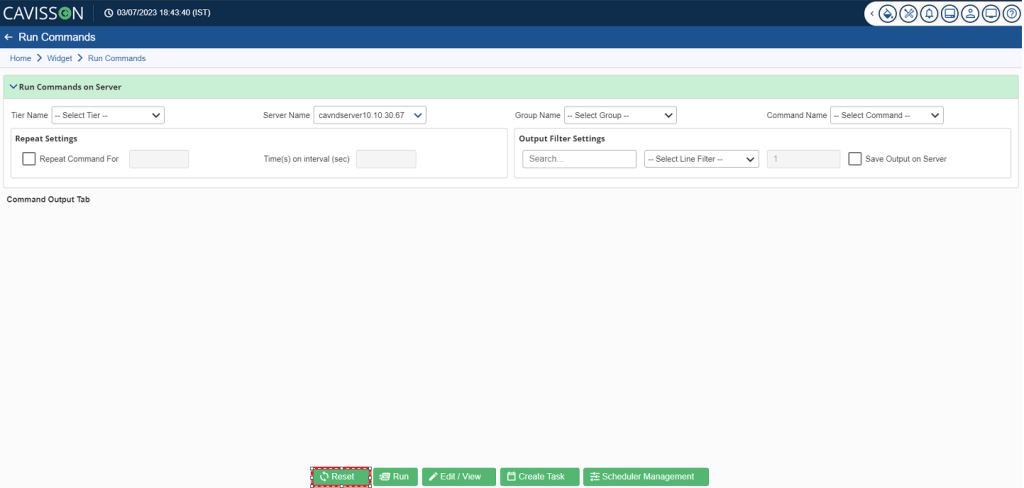
Edit / View
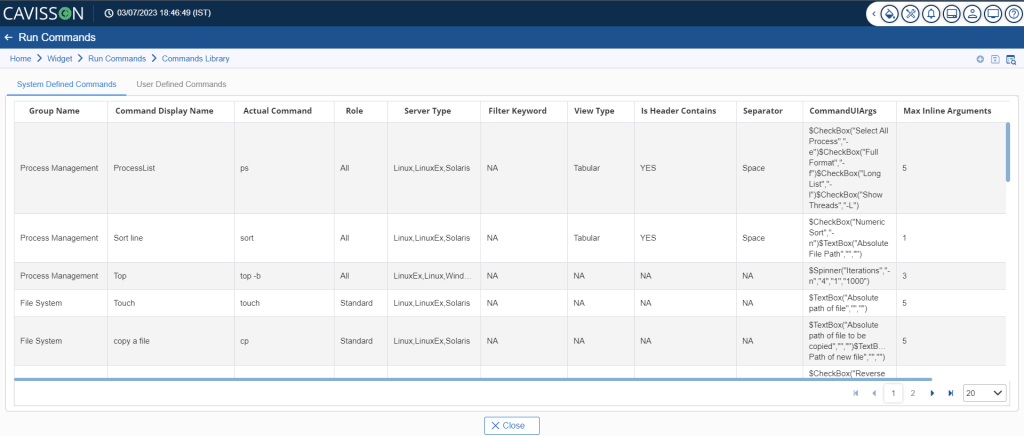
In this section, you can view the System Defined Commands and User Defined Commands.
System Defined Commands
The details displayed are as follows:
- Group Name
- Command Display Name
- Actual Command
- Role
- Server Type
- Filter Keyword
- View Type
- Is Header Contains
- Separator
- Command UI Arguments
- Maximum Inline Arguments
- Description
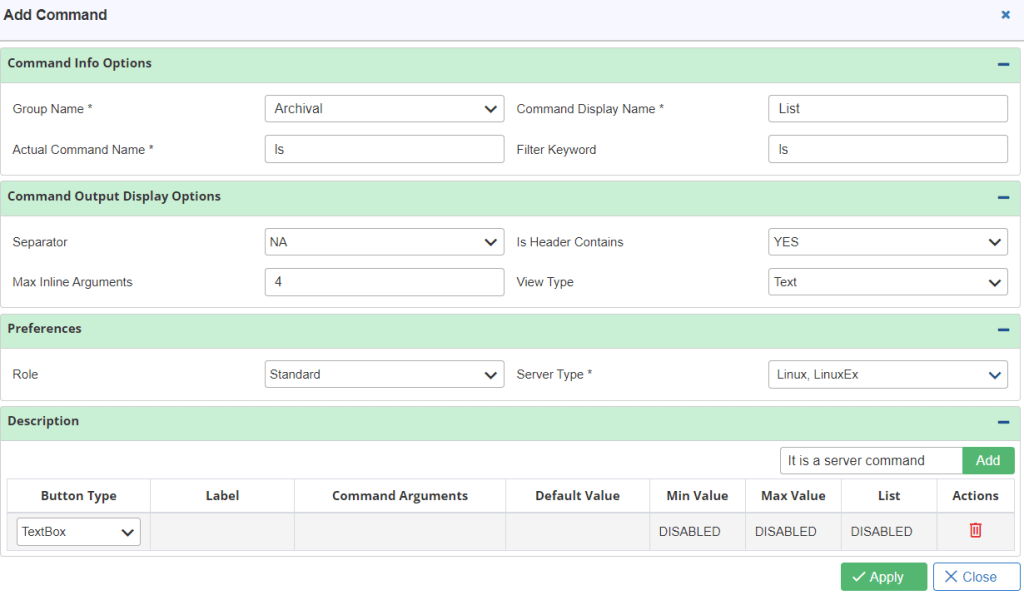
- Command Info Options
- Group Name
- Command Display Name
- Actual Command Name
- Filter Keyword
- Command Output Display Options
- Separator
- Is Header Contains
- Max Inline Arguments
- View Type
- Preferences
- Role
- Server Type
- Description
Notes:
- The ‘Command on Server’ button navigates you to the Run Command window where you can run commands on the server.
- The ‘Command in File Editor’ button navigates you to the ‘System Defined Commands’ and ‘User Defined Commands’

Note: There are the following options that a user can perform after adding a command which are listed below:
- Save Command: On clicking this option, the user can save the command. To perform this operation, the user has to click on the Save After a user click on the Save
 icon, it will show a pop-up indicating the Command is saved successfully.

2. Toggle Filter: On clicking this option, the user can filter out the table data by providing a text.

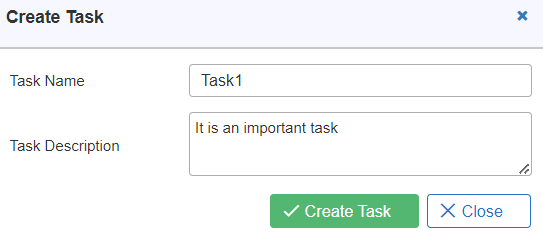
Enter the task name and task description. Then, click the Create Task ![]() button, a confirmation message is popped up stating that the task is saved successfully as shown in Figure 215. Once created, that task can be re-run at backend after a specific interval of time or on any date through Scheduler Management. In the subsequent section, the scheduling of tasks is described.
button, a confirmation message is popped up stating that the task is saved successfully as shown in Figure 215. Once created, that task can be re-run at backend after a specific interval of time or on any date through Scheduler Management. In the subsequent section, the scheduling of tasks is described.
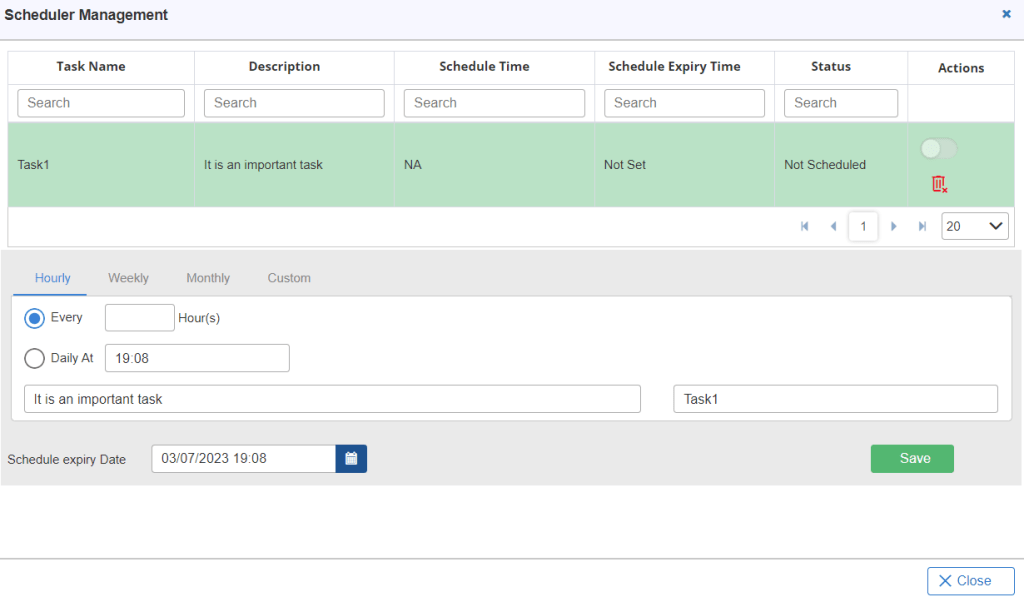
Note: User can schedule it on an Hourly, Weekly, Monthly and Custom basis. First, select the required tab and provide the details accordingly. Then, specify the Scheduled Expiry Date and click the Save ![]() button. At this date, the schedule is expired and the task is not executed further. You can use the Disable/Enable
button. At this date, the schedule is expired and the task is not executed further. You can use the Disable/Enable ![]() icons to disable/enable or to delete a task click on the Delete
icons to disable/enable or to delete a task click on the Delete ![]() icon.
icon.
Hourly

Weekly

Monthly

Custom

Note: If you want to close the window, click on the Close ![]() button.
button.
Root Cause Analysis
By using this feature, the user finds cause metrics for Root cause analysis using the classification of metrics. Also using the classification which will be stored with metadata in TSDB, the user will able to do integration point root cause analysis in case of a spike at integration points.
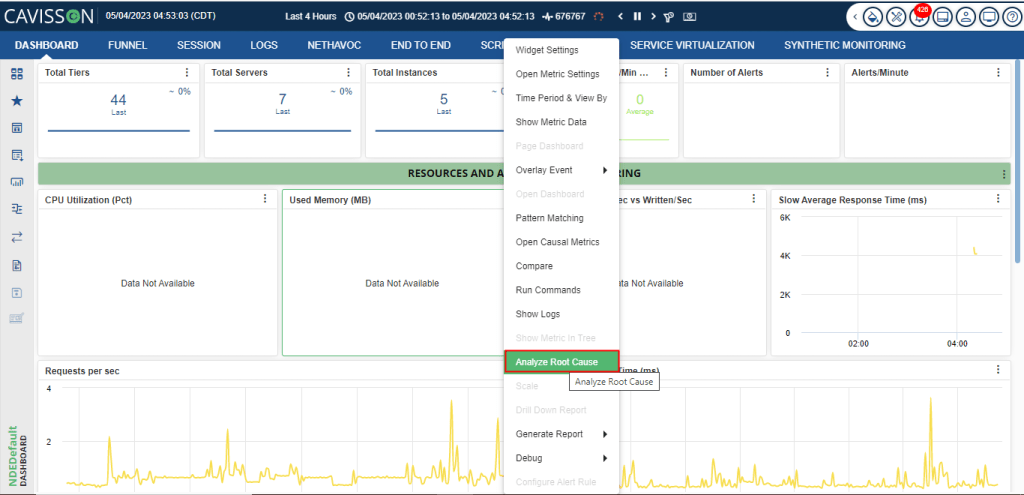
Scale
This feature is added to reduce the visualization and interpretation complexities arising from having large as well as small graph values on the same widget. Scaling enables a distinct display of very small values compared with very high values on the same widget. Two scaling modes are provided, logarithmic and auto.
Note: Once scaling is ![]() enabled, icon is displayed over the widget.
enabled, icon is displayed over the widget.
Key Pointers
- Scaling can be changed/applied from the widget.
- If the scaling option is changed/applied from the widget, then it applies to that widget only.
- If scaling by specified metrics is selected, then on the selection of metrics from the lower pane or from the widget, the scaling is changed.
- From the configuration UI, you can change the default option of scaling.
- Using the Scaling Threshold value, you can scale the graph as and when needed and can calculate the Scale Factor based on that.
- The graphs, which are being scaled, are displayed with the dash and dotted line respectively.
- The scale factor is being calculated and it could be seen in the lower panel as ‘X’ (Scaled up) and ‘/’ (Scaled down), based on the nature of the graphs.
- The scale factor is displayed in whole numbers.
- A specific range is maintained for the graphs where scaling is applied and maximum graphs will have the Scale Factor as 1. For example: If the scaling threshold is 20 and the max value of the graph is 100 then all the graphs having values lesser than 100/20 are scaled with the Scaling factor Nx1. All the graphs having values greater than 100*20 are scaled with Scaling factors shown like Nx2 or Nx/3.
Example:
In the graph panel, there is a graph with low values (CPU Utilization) and hence it is difficult to view the graph data concerning the higher valued graphs.
To have a better view, you can apply scaling on the graphs. There are two modes of scaling – Auto and Logarithmic.
Auto
This mode is applied to the graph having the highest value.
Note: The scaling factor is calculated and displayed in the lower panel automatically. To find the actual value at any instance, mouse over to that instance. You can change the scaling base metric by clicking if from the lower panel. Scaling is re-calculated according to the selected metric and redraws the chart.
Logarithmic
Here we can use logarithmic scaling to handle a large number of metric or graphs. In mathematics, the logarithm is the inverse operation to exponentiation, just as division is the inverse of multiplication and vice versa. That means the logarithm of a number is the exponent to which another fixed number, the base, must be raised to produce that number. In simple cases, the logarithm counts factors in multiplication. For example, the base 10 logarithm of 1000 is 3, as 10 to the power 3 is 1000 (1000 = 10 × 10 × 10 = 103); 10 is used as a factor three times.
Scaling Off
To disable scaling from the graphs, select Off from the scale menu. This laid the graphs in their original form.
Area Range Graph
Area Range graphs is a chart type, which is applicable based on the configured threshold. This is implemented to resolve the UI slowness due to a large number of graphs on the panel. The area-range graph plots the higher value and lower value samples from a set of graphs, which makes it lightweight and quick to update and render.
Geo Country Map: This shows the map of the country which is selected in the Widget.
Widget Metric Limit: It shows the limit of the Widget plotted.
Widget Count limit: This shows the limit of the count in the widget.
Shows data points: In this, the data point is shown in the graph if samples are below the given limit.
Apply Zoom: Select this check box to apply zoom on widget.
Offset line: Select this check box to show the offset line.
Shows Logs
This feature allows the user to correlate metrics information with logs generated by the application and helps the user to identify any issue reported in the logs.
It provides support for accessing logs from multiple sources including NetForest and Splunk. The unique proposition offered here is by having integration of logs during the Netstorm performance load testing which forms an envelope for the application logs to give summarized data with transaction time and overall status. Then users can follow any specific streams to see the real application logs with the time taken in each stage.
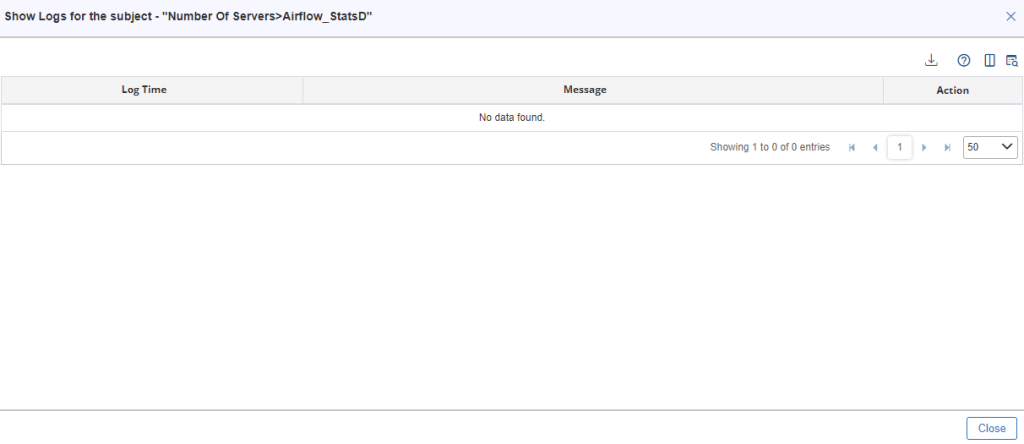
The logs data is shown in a tabular form, with the priority attributes shown in the default view, with an option for the user to view other columns also by adding more custom columns in the table. The description of columns and actions is given below –
- Log Time: Transaction/Application log time according to the dashboard time zone.
- Message: It will display the message and information about the log entry.
- Log Stream: A log stream is a sequence of log events that share the same source and are used for correlating the logs.
- Log Group: Groups of log streams that share the same settings and configuration.
- Follow Stream: Shows full stack of the selected Application/Transaction logs.
- Diff(MS): Time taken by that Transaction/Application step.
- There are two Action icons under this category-:
- The show Full Message: User will see the full message or information in a popup window.
- The follow Log Stream: User will see the Start /End Transaction /Application Logs.
Show metrics in a tree
Using this option, the user can find and highlight metrics in a tree that is present in the widget. If there are multiple metrics on the widget, then only the selected metric will be highlighted. For details refer to Metrics.
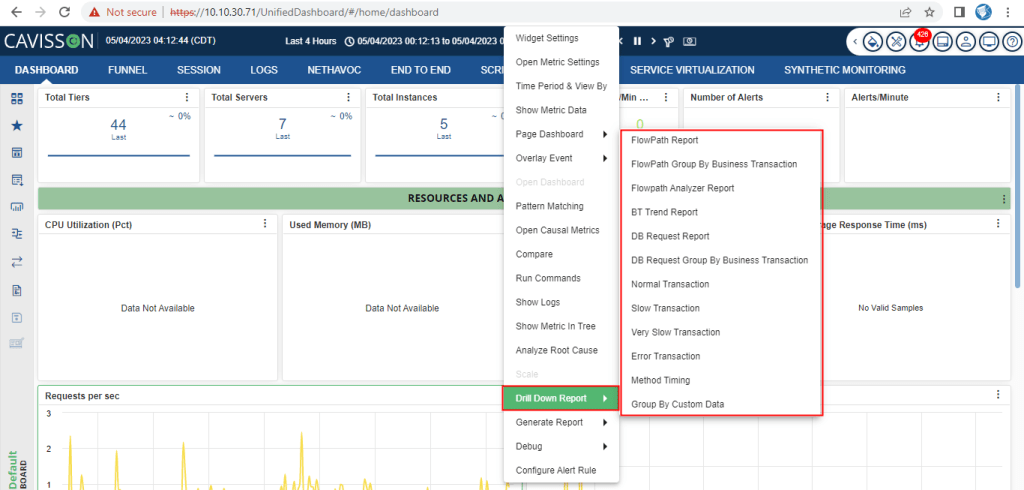
Drill Down
Drill down contains various reports based on the metrics:
- Flowpath Report
- Flowpath group by business transaction
- Flowpath Analyzer Report
- BT trend report
- DB request report
- DB request group by business transaction
- Normal transaction
- Slow transaction
- Very slow transaction
- Error transaction
- Method timing
- Group by custom data
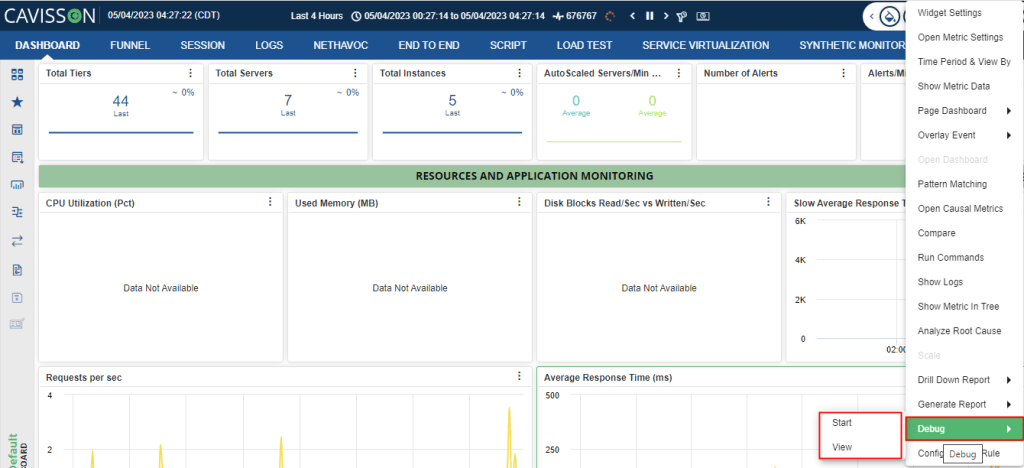
The debug menu will have the following sub options:
- Start: On clicking Start, the UI will start sending the requests with additional parameter debug set to true in the request header.
- Stop: The UI will stop sending the debug flag in the header.
While the Debug process is in progress, the UI will show a blinking red dot on the widget to alert the user that the rest calls are being debugged which may cause a slight overhead compared to normal operation.
- View: There will be an option to view the Captured Jsons in the latest Rest calls which were debugged through a UI which will show the Request and Response Jsons captured for NodeJs, tomcat and TSDB. These will be fetched from the database based on time range and panel Id.
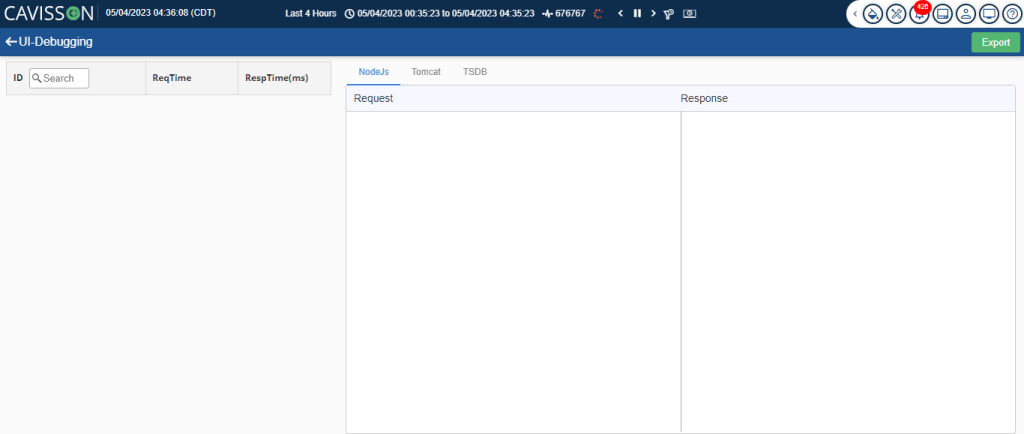
Note: Users will have an option to export the data to a file as download where all the Jsons of a particular request will be downloaded into a file to be analyzed later.