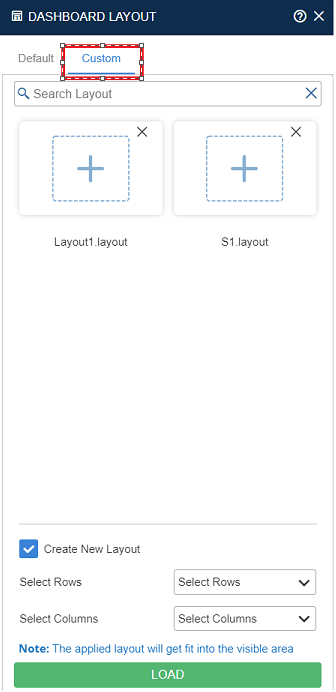
This feature helps in comparing metrics in the dashboard for multiple time frames as well as metrics of two or more test runs (In case of Netstorm). Compare is allowed only for a single metric in one graph. Metrics can be compared in two different ways i.e. side by side comparison & Trend compare.
In Side by Side comparison, you can compare two or more measurements (Time frames or Test runs) in the same graph parallelly for a single metric. While in Trend Comparison, you can compare metrics in form of trend graph i.e. connected graph of multiple measurements (Time frames or Test runs) for a single metric. Trend comparison helps you to analyze the behavior pattern of a matric at different events or in different test runs.
Metrics can be compared in both online and offline modes. In online mode, two graphs are displayed, one static baseline graph and one current running test run/session graph.
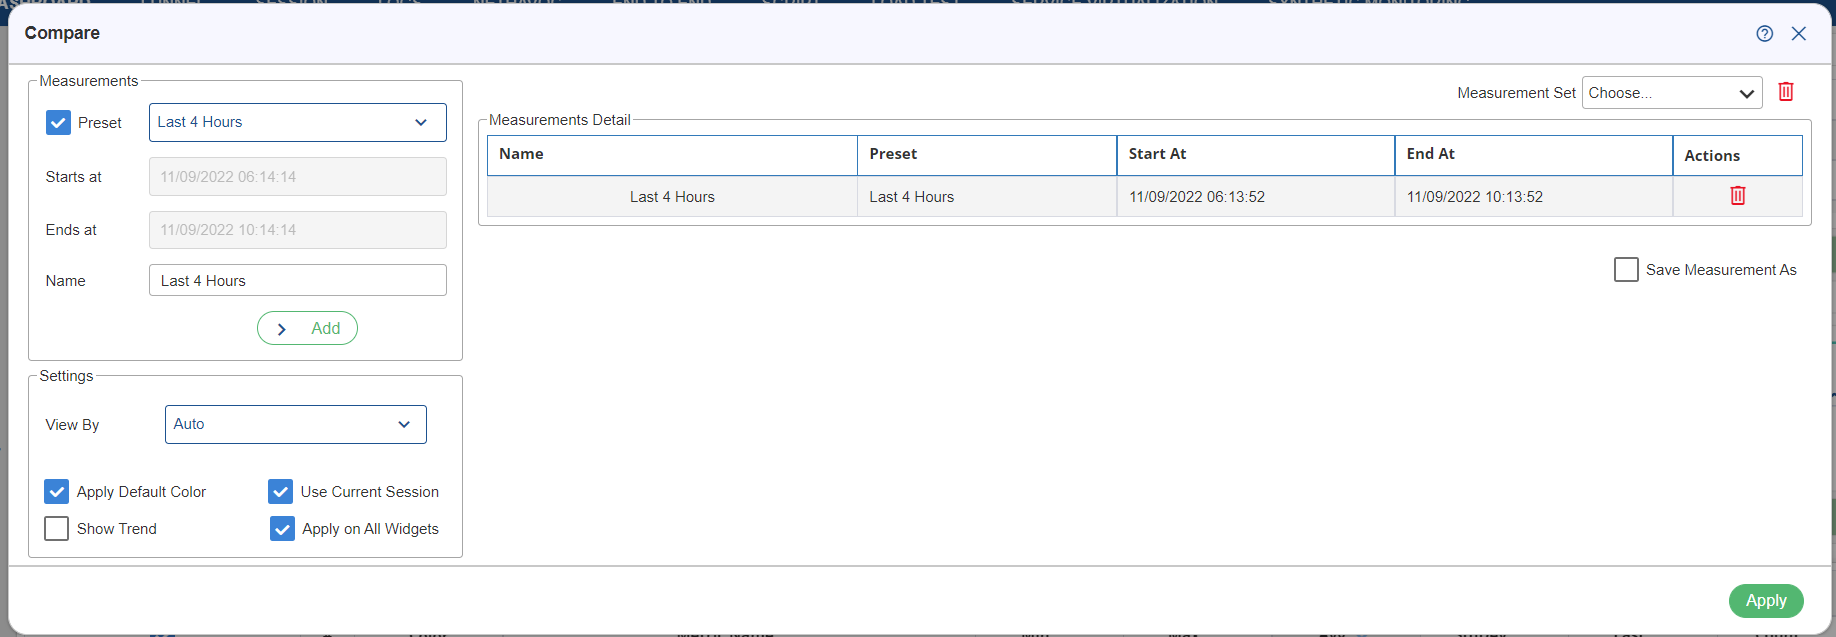
Measurements
Measurement is the set of periods to be compared. In the case of Netstorm, Test run is also termed as measurement.
Preset is the period of one entity for the comparison. There are following options within Preset:
- Live: It is to compare live data. For example – Last 5 minutes, Last 10 minutes, Last 30 minutes, Last 1 hour, Last 2 hours, Last 4 hours, Last 6 hours, Last 8 hours, Last 12 hours, Last 24 hours.
- Past: It is to compare past data. For example – Yesterday, Last week, Last 2 weeks, Last 2 months, Last year.
- Events: It is to compare data for some specific events. For example – Black Friday, Christmas Day, Good Friday, Cyber Monday etc.
- Whole Scenario: It is used to compare data for whole scenario.
- Time Back: In time back, we can compare the data on: Hourly, Daily, Weekly and Monthly basis.
Note: Starts at and Ends at options are enabled where you can fill the start & end date and time of the measurement. It is enabled when you do not select the Preset option. In the case of NetStorm, two options are displayed on selecting Custom – Absolute and Elapsed. In the case of Absolute, enter Start Date, Start Time, End Date and End Time. The specified date/time should be in range with the current session.
Starts at
It is used to specify the start time to execute the compare.
Ends at
It is used to specify the end time for executing the compare.
Name
It is used to specify the name of the preset.
Update
It is used to update the details (in the left panel), by clicking on the Update button.
Measurements Details
In measurement details, there are the following fields which are listed below:
- Name: It is a unique name, which is assigned for the particular measurement. Auto suggestions for measurement names are provided based on the start and end time of the measurement, Day & current session.
- Preset: It is the period of one entity for the comparison.
- Start at: It is the start time of the measurement.
- End at: It is the end time of the measurement.
- Action: It is used to delete a measurement from the table.
Note: If a user wants to save the measurement details, they need to click on the Save Measurements As checkbox.
Settings
In settings option, user can set the following options:
- View By: You can set a sample interval in graphs for comparison by changing the unit & value in the View by & View by Value option. View by contains the following options:
- Auto: It is used to select sample intervals automatically as per duration of compared measurements.
- Second: It contains the values, such as 10 Sec, 20 Sec, 30 Sec, 40 Sec & 50 Sec.
- Minute: It contains the values, such as 1 Min, 2 Min, 4 Min, 5 Min, 10 Min, 15 Min & 30 Min.
- Use Current Session: User can add the default dashboard as baseline measurement by checking Include default dashboard as baseline checkbox given in the right pane of the compare dialog box.
- Show Trend: To enable compare for trend compare. You can compare the value of a single metric at multiple events or in multiple measurements in the form of connected trend graphs. On clicking Show Trend, the color option is not visible.
- Apply on All Widgets: User can apply to compare all widgets of the Dashboard or active one. If this check box will be checked then compare will apply to all widgets otherwise only the active widget.
- Apply Default Color: To apply default color on all the widgets.
Applying Compare
Once the required number of measurements are added in the right panel of the compare dialog box, you can apply comparison by clicking the Apply ![]() button in the right pane of the compare dialog box.
button in the right pane of the compare dialog box.
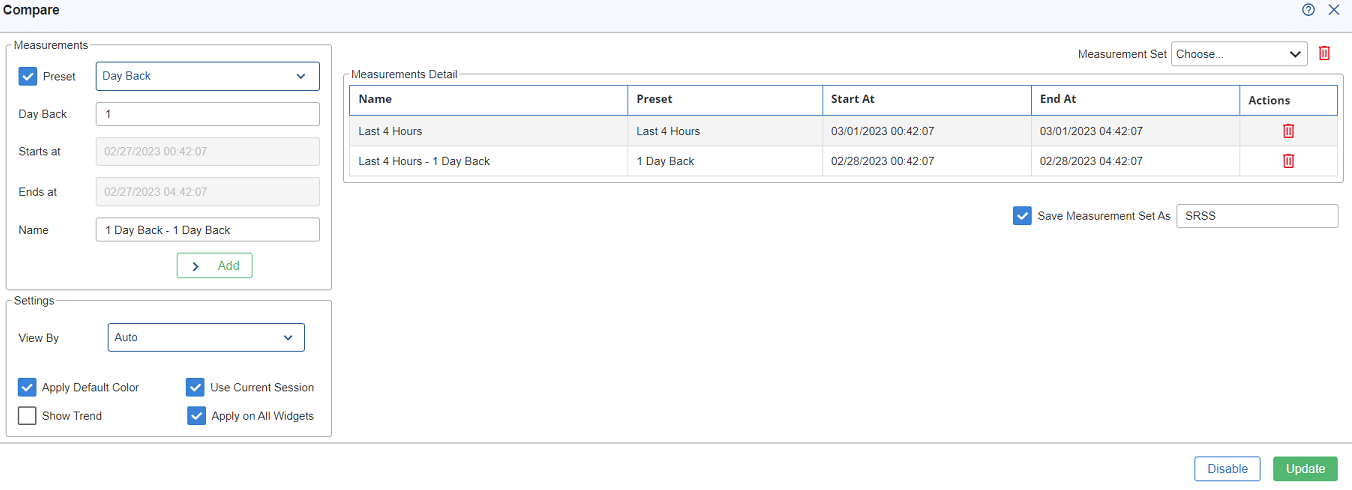
To apply compare session with added preset, the user has to click on the Update button to apply the compare. On clicking the update button, the applied compare will be displayed as shown in below figure.
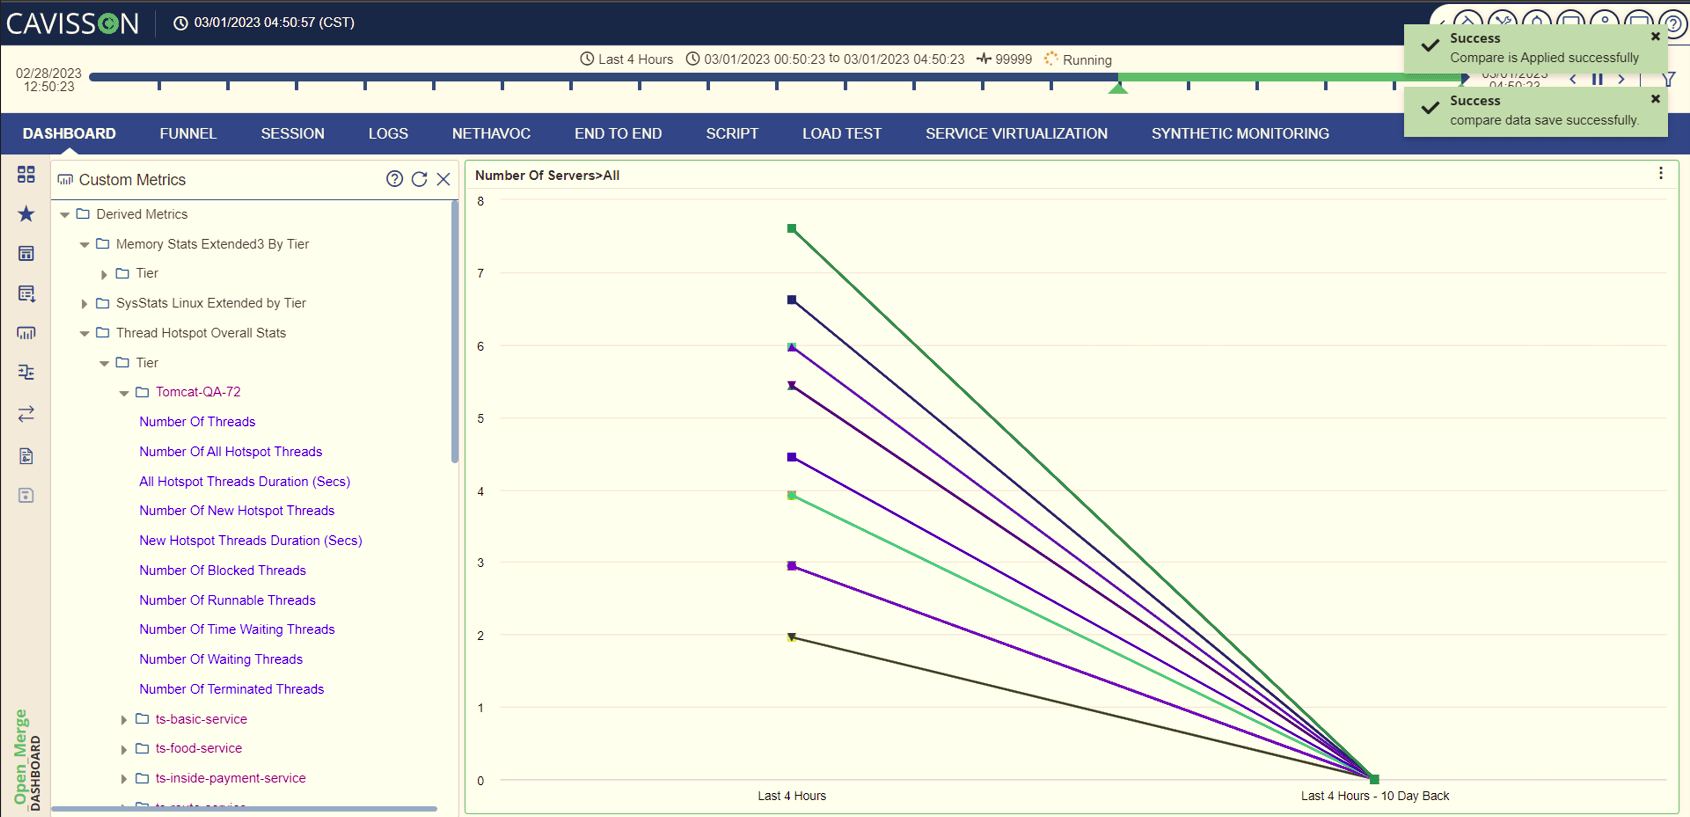
Note: Once the compare session has been applied with the applied preset, a confirmation message will be displayed on the top right corner of the window.
Operation on Compared Graphs
Following operations can be performed on compared graphs in Dashboard:
- Zoom: You can apply zoom on the compared graph panel.
- Select single metric: If you select a single metric on a compared graph, then that graph is compared if the metric is present in all measurements. If the metric is not present in any measurement, then it displays zero value for that measurement.
- Select multiple metrics: If you select multiple metrics (All metrics of a group) on a compared graph then only the first metric is compared.
- Load Favorite: If favorite is loaded on a compared graph then only the first metric of each panel of favorite is compared.
- Change Color: You can change the color of measurements from the lower panel.
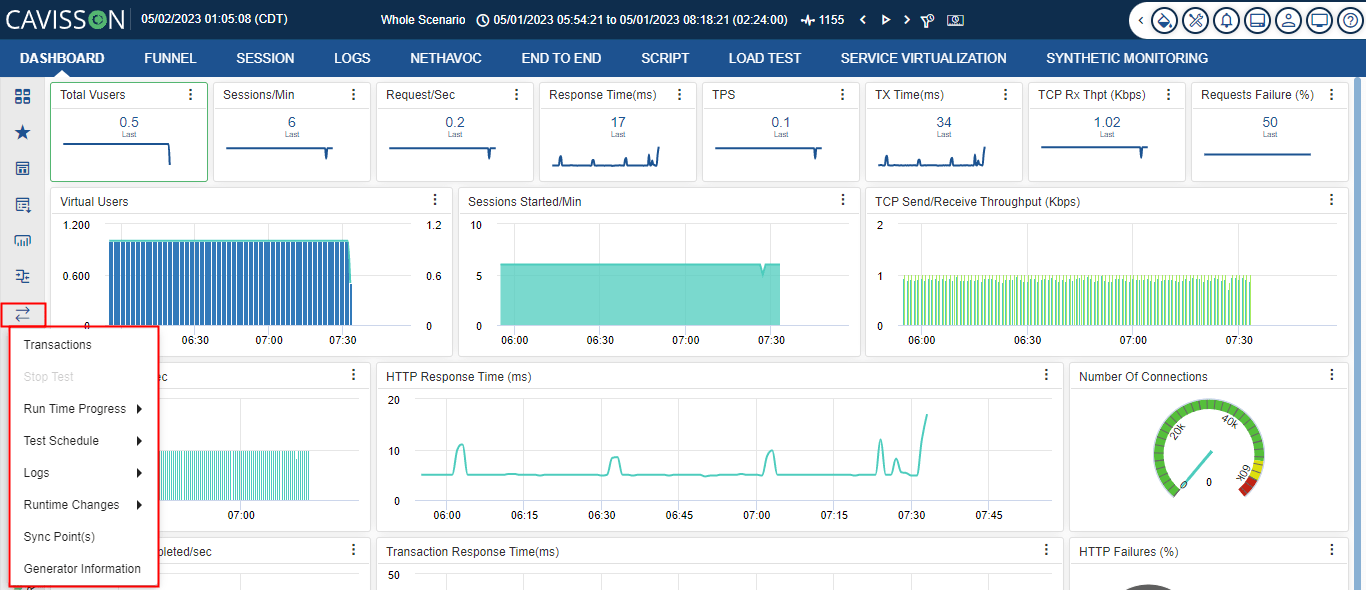
Transactions
Any sequence of page clicks is grouped as a transaction. Transactions are added to measure the response time of a particular logical action as performed. You can see the detailed reports on click of a transaction link.
Transaction Criteria: You can view All/Success/Failed transactions in this window by selecting the appropriate option from the list. Whenever you perform drill-down by applying ‘Success’ filter, only the ‘Success’ column is displayed and the ‘Fail’ or ‘Fail %’ columns are not displayed. In addition, whenever you perform drill-down by applying ‘Failure’ filter, only the ‘Fail’ and ‘Fail %’ columns are displayed and ‘Success’ column is not displayed.
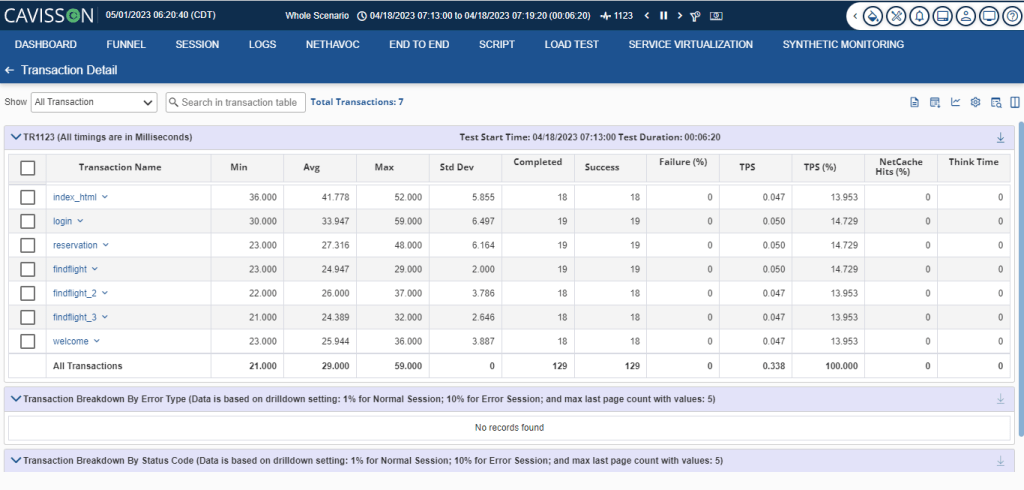
There are the following fields in the transactions:
- Transaction Name: It is the name of executed Transaction in the Test Run. To view the transaction summary report, click the transaction name link.
- Min: This field shows the minimum time (sec) taken by the transaction in a sample period/ cumulative.
- Avg: This field shows the average time (sec) taken by the transactions in a sample period/ cumulative. Click the link to open the transaction detail report.
- Max: This field shows the maximum time (sec) taken by the transaction in a sample period/ cumulative.
- Std Dev: This field shows the standard deviation in the data (sec) in a sample period/ cumulative.
- Completed: This field specifies the number of completed transactions in a sample period/ cumulative. Click the link to open the transaction instance report.
- Success: This field specifies the number of successful transactions in a sample period/ cumulative. Click the link to open the successful transaction instance report.
- Failure (%): This field shows the transaction failure percent in a sample period/ cumulative.
- TPS: This field shows the transaction completed per sec in a sample period/ cumulative.
- TPS (%): This field shows the percentage of transactions per second in a sample period/cumulative.
- Think time: This field shows the added page think time in the transaction.
- NetCache Hit%: Shows the % of hits in the net cache.
In addition to the above, we also have the following options:
- Show: Through this, we can select the transactions which we want to see like all transactions, successful transactions, or failed transactions.
- Global Search: Through this, you can search any data from the given transactions available.
- Total transactions: It shows the total number of transactions for the selected TR.
- Open Page Dump Report: If the user clicks the icon, it opens the page dump page. Page dumps consist of HTTP Requests, Responses, and page dumps.
- Open Transaction Summary Report: This report displays a Transaction summary, such as transaction name, minimum duration, average duration, maximum duration, median duration, 8th percentile, 90th percentile, 95th percentile, 99th percentile, script count, several tries, success, fails attempts, and fail percentage.
- Show Dashboard: It shows the transaction in graphical form based on:
- Transaction time(ms)
- Transaction completed/sec
- Transaction failures (%)
By clicking dashboard
- Configuration: To configure the percentile view for the transactions, use this option.
- Column Filter: Use this option to filter the columns within some range.
- Show/hide columns: Use to select the columns which are needed to be hidden or shown as per requirement.
Downloading Transaction Details
You can download the transaction details in Excel format using the icon on the bottom left corner of the window.
Stop Test
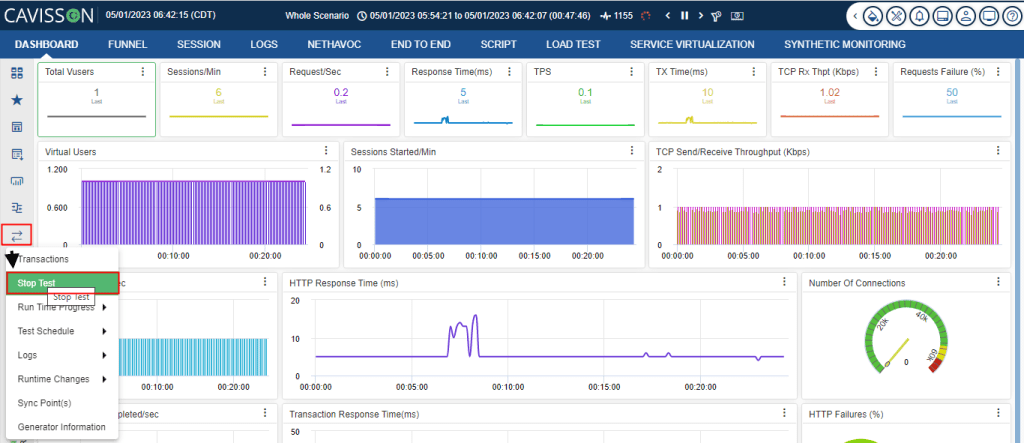
This Option is used to stop any running test. To access this, click on Manage Load and then click on stop test as shown in the figure below.
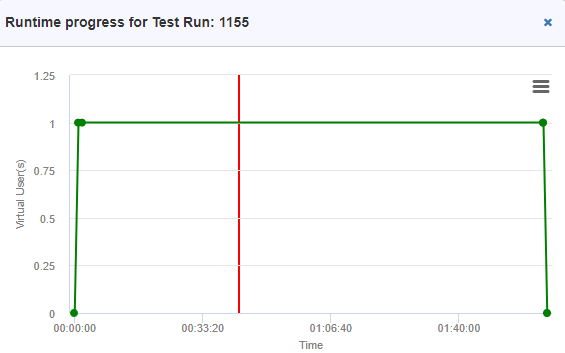
Runlogic Progress
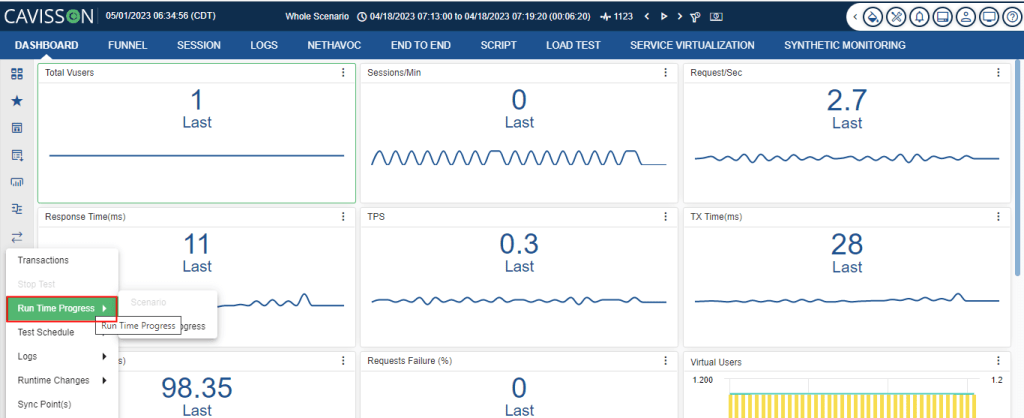
This section is used to view the RunLogic runtime progress, which is configured via script manager. RunLogic Progress allows users to visualize at what rate the netstorm virtual user executing flows and page. It allows comparing the expected rate vs actual rate per second for each block, flow, and page. You can access runlogic progress by- Dashboard -> Manage load ->Runtime progress -> Runlogic Progress.
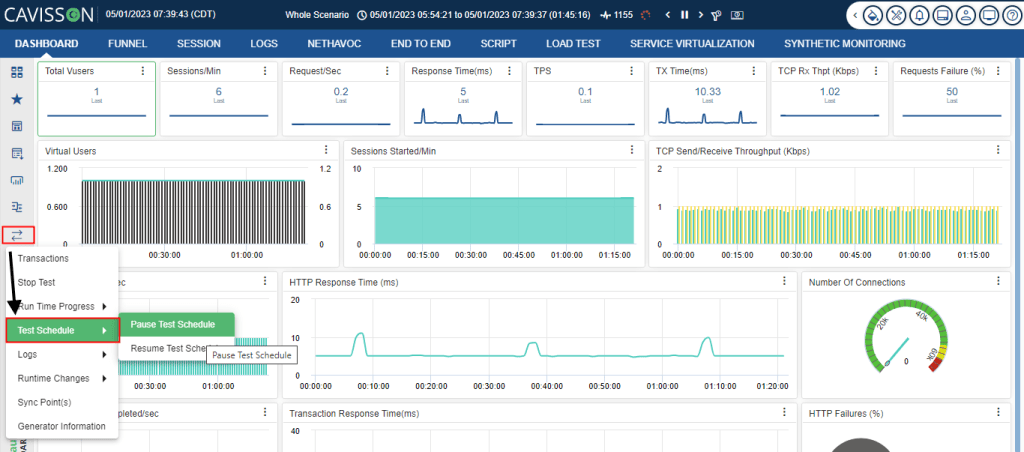
Test Schedule
Through the help of this option, you can pause a schedule test or you can resume the test if it is paused.
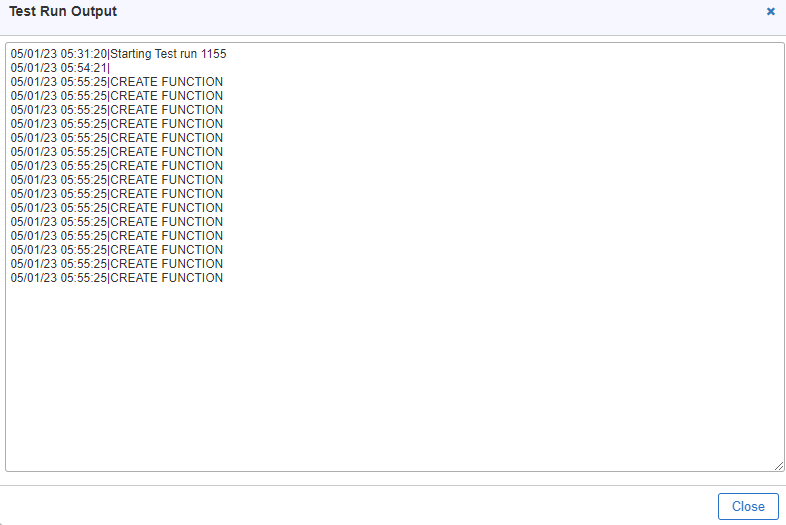


Execution Trace Log
An execution trace log, also known as a trace log or execution log, is a type of log file that records a detailed account of the execution path of a software application or system. It provides a record of all the operations performed by the software application, such as function calls, memory usage, input/output operations, and error messages. This window displays total test cases along with number of executed, passed, and failed. This displays a table with having details for test cases and their corresponding results.

Runtime Change Logs
A runtime change log, also known as a change log or revision log, is a record of changes made to a software application or system during runtime. It provides a record of all modifications, updates, and revisions made to the application during its execution. This window displays details for Runtime changes logs that include details, such as source, status, date/time, owner, applied by, and description.

Event Log
This shows all event(s) generated in the current test run.
Log Viewer
A log viewer is a software tool that is used to view and analyze log files generated by software applications or operating systems. It allows users to easily navigate through log files and view the recorded events, errors, warnings, and other information in a user-friendly interface.
Log viewers are typically designed to work with various types of log files, such as system logs, error logs, event logs, execution trace logs, and more. They can display the log data in various formats, such as tables, graphs, or charts, and provide tools to filter, search, and sort the log data based on specific criteria.
In log viewer we can see and download the logs.

Log viewer have following options:
- Access Log: An access log is a file or a combination of files that contains a list of all user interactions or accesses made to the server. Access log files are stored on a server with structure specific to a server type.

- Debug Log: A debug log, also known as a debugging log, is a record of events that occur during the execution of a software program or system. It is used to help developers or system administrators identify and diagnose issues or errors that occur during runtime.

- Error logs: An error log, also known as an event log or system log, is a record of events that occur within a software application or operating system. It is used to capture and store information about any errors, warnings, or other events that may impact the performance or stability of the system.

- Setup Debug log: A setup debug log is a type of log file that records information about the installation and setup process of a software application. It can provide valuable information for developers, system administrators, or end-users who are trying to diagnose issues or errors that occur during the installation or setup process.

- Startup Error log: A startup error log is a type of log file that records any errors or issues that occur during the startup process of a computer or application. It can provide valuable information about the cause of any problems that prevent a computer or application from starting up correctly.

Test Status Report
The test status is derived from the SLA’s defined in Netstorm check engine. Check engine is a collection of rules that are set at test metrics such as transaction response time, failures and at system/application metrics. The test status report is based on checkprofile added in a test to check whether it is passed or failed.

Runtime Changes
Runtime changes refer to any modifications or updates made to a test during its execution or runtime. These changes can include modifications to the code, configuration settings, data, or other resources used by the application.
Runtime changes can occur for a variety of reasons, such as to fix bugs or errors, add new features or functionality, or update the test.
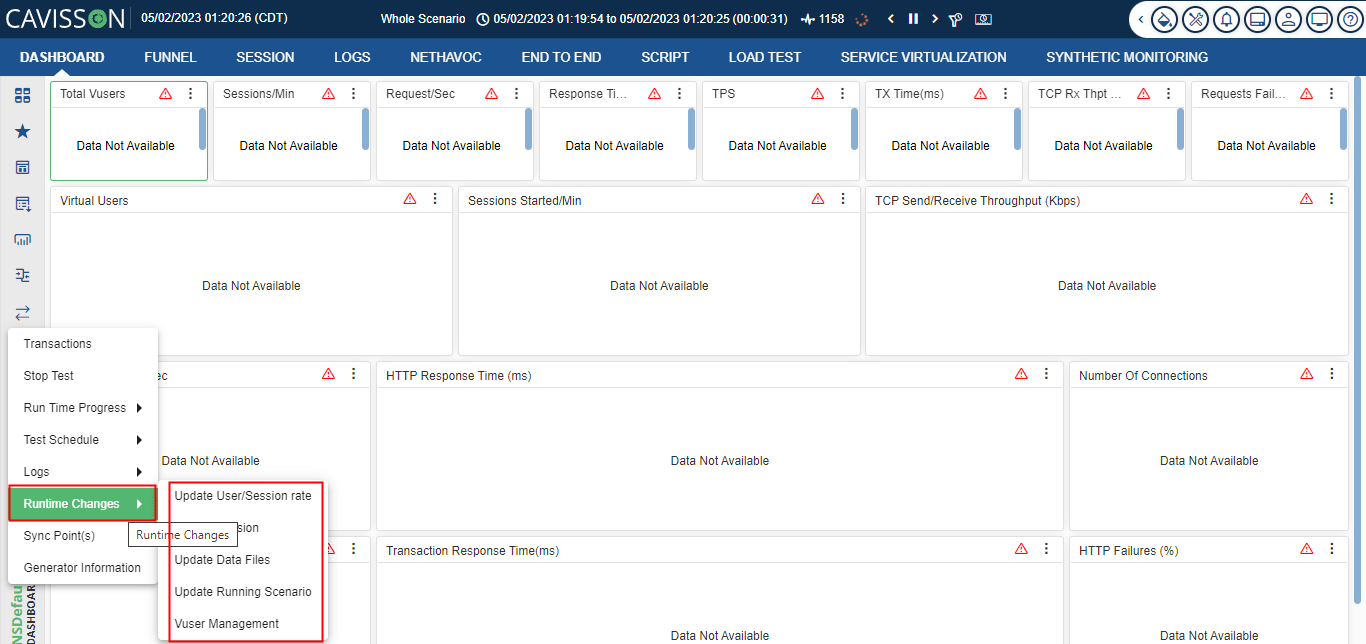
- Update User/ Session rate: This option is used to do run time changes configuration that includes updating user(s) and session rate.
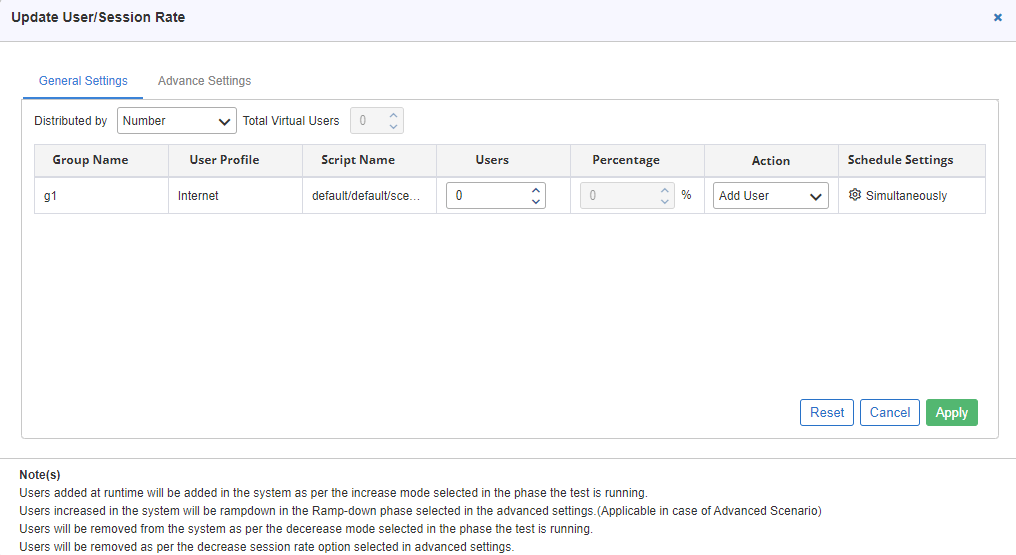
It has the following fields:
- Distributed by: Select whether the distribution is to be done by number or percentage.
- Total Virtual User: Mention the total number of virtual users.
- Group Name: Shows the name of the group for which the rate is calculated.
- User profile: Shows the name of the user profile.
- Script Name: The name of the script from where the user session rate is to be calculated.
- Actions: Shows whether the user is to be added or removed.
Note(s)
- Users added at runtime will be added in the system as per the increase mode selected in the phase the test is running.
- Users increased in the system will be rampdown in the Ramp-down phase selected in the advanced settings. (Applicable in case of Advanced Scenario)
- Users will be removed from the system as per the decreasing mode selected in the phase the test is running.
- Users will be removed as per the decrease session rate option selected in advanced settings.
- Update Session: This option is used to update the session.
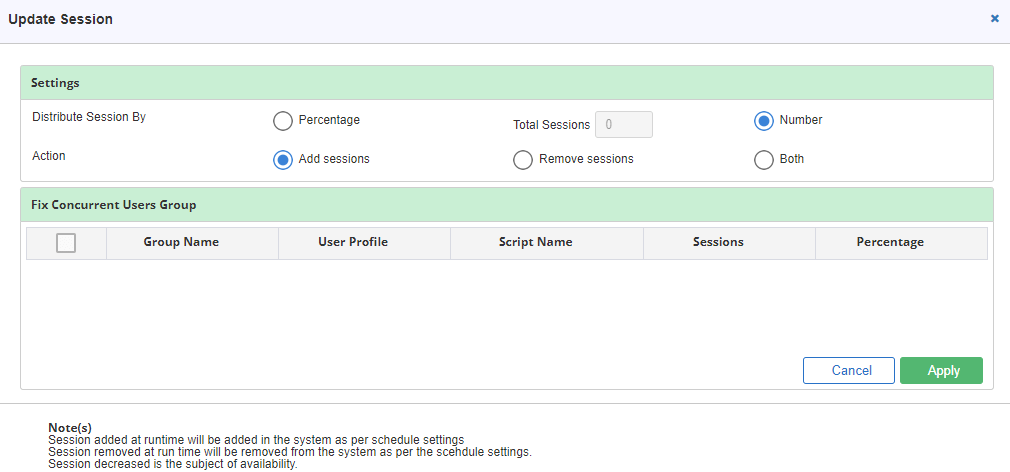
Note(s)
- Session added at runtime will be added in the system as per schedule settings
- Session removed at run time will be removed from the system as per the schedule settings.
- Session decreased is the subject of availability.
- Update Data files: This option is used to update data files. You can append content to a data file or replace the content of a data file with another data file. It is supported in online mode only.
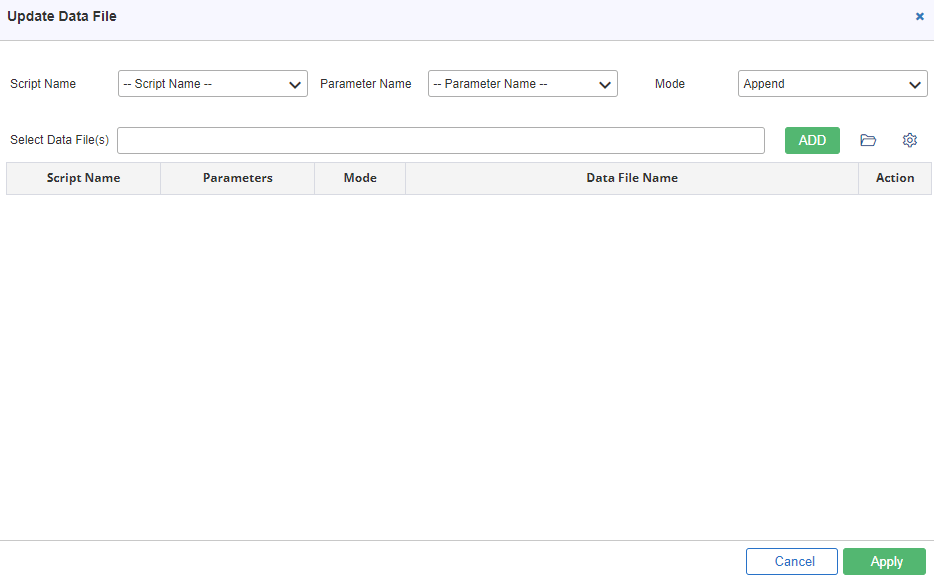
It has the following fields:
- Script Name: Select the name of the script where the data file is located or where the content is needed to be updated.
- Parameter Name: Select the parameter name from the drop down.
- Mode: Select whether the data is to be append or replace.
- Update Running Scenario: This option is used to update sections in the running scenario.
- Vuser Management
VUser management refers to the process of managing virtual users (VUsers) in performance testing or load testing scenarios. VUsers are simulated users that are used to mimic the behavior of real users on an application or system and are used to test the performance and scalability of the application or system under various load conditions.
VUser management tools are often used to manage and automate the process of creating, configuring, and monitoring VUsers in performance testing scenarios. These tools typically provide a user-friendly interface for configuring VUsers, as well as monitoring and analyzing test results in real-time.

It has the following columns:
Sync Points
Sync points mean ‘meeting points’. A Sync point creates intense user load on the server at a time to measure server performance under load.
For example, to test a bank server, the user could create a scenario that contains two Sync points as ‘Deposit’ and ‘Withdraw’. The first Sync point ensures that 1000 Vusers simultaneously deposit cash. The second Sync point ensures that another 1000 Vusers simultaneously withdraw cash. To measure how the server performs when only 500 Vusers deposit cash, the user can deactivate the withdraw Sync point, and instruct 500 Vusers to participate in the deposit Sync point only.
Sync Point Summary displays all the configured Sync Points. The user can add, update, delete, release, and activate/deactivate a Sync point.
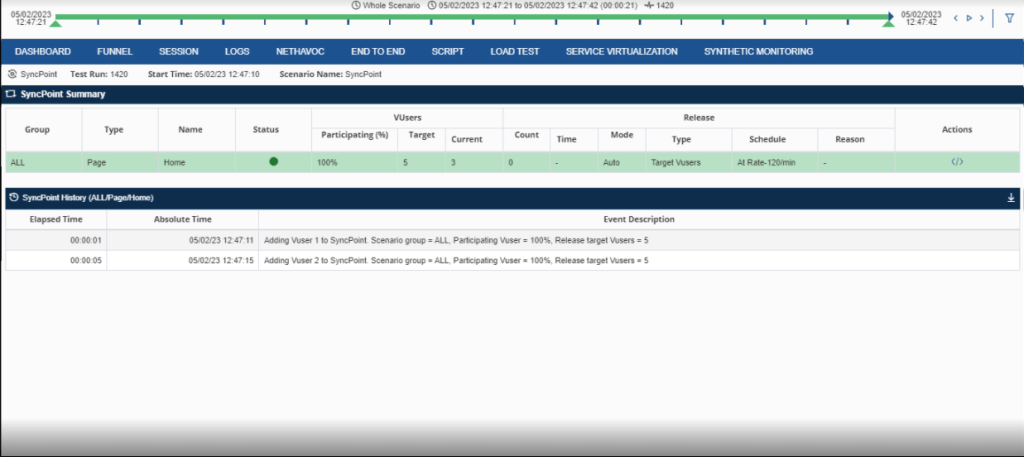
Sync point is released due to following reasons.
- Release Target Vusers Arrive at the Sync Point: When target Vusers arrive at the Sync point, then they are released.
- Overall Timeout: Maximum time allowed for each Sync point to reach the target after first Vuser has entered the system. If the Sync point is not released within the timeout period, then all the Vusers are released from the Sync point.
- Inter User Arrival Timeout: Maximum time allowed between two Vusers arriving at a Sync point.
- Manual Release: Immediate release for any Sync point at any state (by using the ‘Release’ button).
- Multiple release policy: A set of Vusers is released at an absolute time in step mode, and another set of Vusers will be released periodically with the same step mode (a + b).
- Single release policy: Allows you to configure the percentage of Vusers to be released in a particular duration.
It has the following fields in Sync Point Summary:
- Group Name: It shows the name of the group.
- Type: Specify the type of sync point.
- Name: Specify the name of the object (transaction/page/script/custom) on which SyncPoint is applied.
- Participating Vusers%: Percentage of Vusers participated for a specific Sync point. This percentage is calculated over the total number of Vusers in the case of ALL groups.
- Release Target Vusers: Specifies the number of Vusers that should reach a Sync point for releasing that Sync point.
- Action: To add, release, update, delete, activate or deactivate the Sync point.
- Mode: It is the way in which the Sync point is going to be released. This could be done either automatically or manually.
- Release Type: It shows how the Vusers will be released
- Schedule: It defines when the VUsers are released after they have reached their respective Sync point.
- Last Release Reason: Reason for the last release of Sync point. If the release happens multiple times, the reason gets overwritten each time and it displays the latest one. There can be the following reasons:
- Target Reached
- Period Completed
- Absolute Time Completed
- Status
![]() – Activated Sync point
– Activated Sync point
![]() – Deactivated Sync point
– Deactivated Sync point
![]() – Sync point in Progress [All action buttons are disabled for Sync point with this status]
– Sync point in Progress [All action buttons are disabled for Sync point with this status]
A user can view the history of a Sync point by selecting it from the Sync Point(s) Summary table. It displays elapsed time, absolute time, and event description.
- Elapsed time: Elapsed time is simply the amount of time that passes from the beginning of an event to its end. For example, 00:00:02, 00:00:07, and so on.
- Absolute Time: Absolute time is simply the actual time of the occurrence of the event. For example, 09/04/19 22:25:27, 09/04/19 22:25:32, and so on. The format of absolute time is: MM/DD/YY HH:MM: SS.
- Event Description: Events get generated on every user arrival and on every Sync point release. Only one event for user arrival is logged within 10 seconds. All events for Sync Points release are logged in the system and are displayed on the Sync Point History


It has the following columns:
- Test Run: Shows the test run number of the selected generator.
- Generator name: The name of the generator.
- Generator IP: This shows the IP of the server.
- Cmon Port: Shows the Cmon port of the server.
- Location: Displays the location of the generator.
- Generator Blade: This shows the name of the blade on which the generator is running.
- Status: The state name in which the Datacenter is present and the server is kept.
- Action: We can edit or delete the generator.
Save Dashboard Changes
This feature is used to save the current changes in the dashboard. To apply this, follow the below mentioned steps:
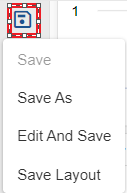
- Click the Save Option button on the left panel, there are following options displayed:
- Save As
- Edit and Save
- Save Layout
- By clicking on the Save As option, the system prompts for adding a new dashboard and save the changes as shown in below figure.
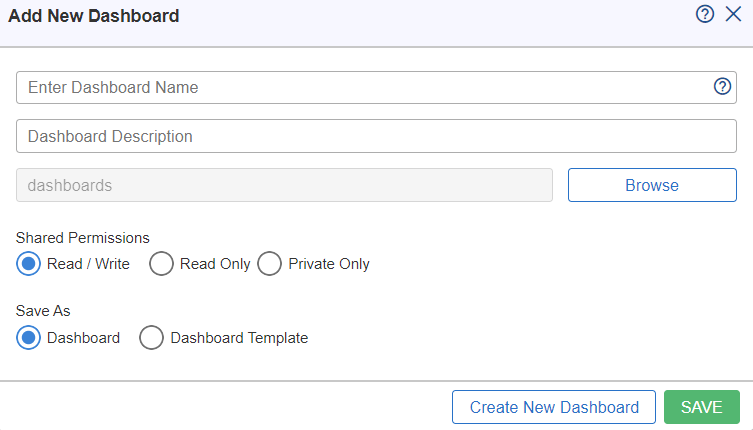
6. In the add new dashboard window, enter the dashboard name and description for the new dashboard, select the required shared permission option such as: Read/Write, Read Only and Private Only.
Note: You can also provide the path on which the new dashboard is to be added. To select the path, click on the Browse button.
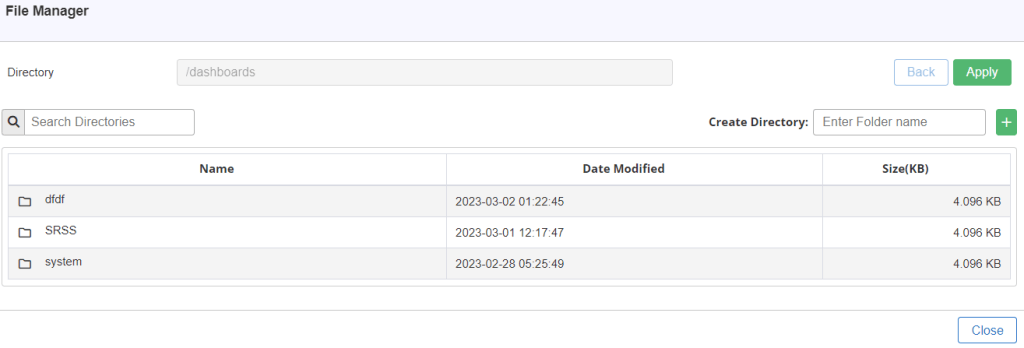
7. On clicking the browse button, the File Manager window will appear as shown in below figure.

8. In the file manager window, create a directory by entering the folder name in the Create Directory
Notes:
- On entering the directory name in the Create Directory field, click on the Add
 button to add the directory.
 - Once you click on the add button, the directory will be created and will be displayed in the File Manager window as shown in below figure.
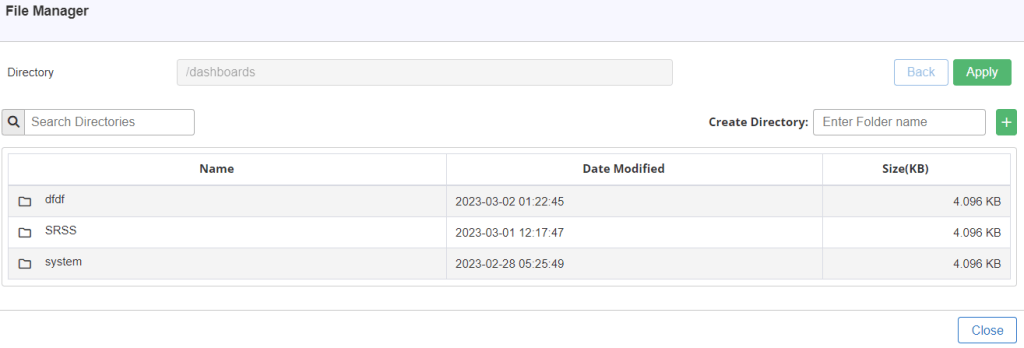
- You can click on the Back
 button to go back to the File Manager
 - You can click on the Apply
 button, to use the selected directory for the new dashboard.
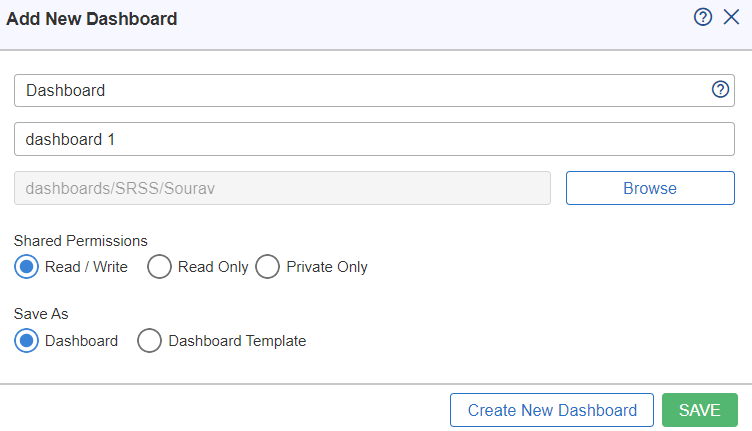
On clicking the Apply button, the selected directory with its path will be displayed on the Add New Dashboard window as shown in below figure.
Select the Save ![]() option to save the dashboard as shown in below figure.
option to save the dashboard as shown in below figure.

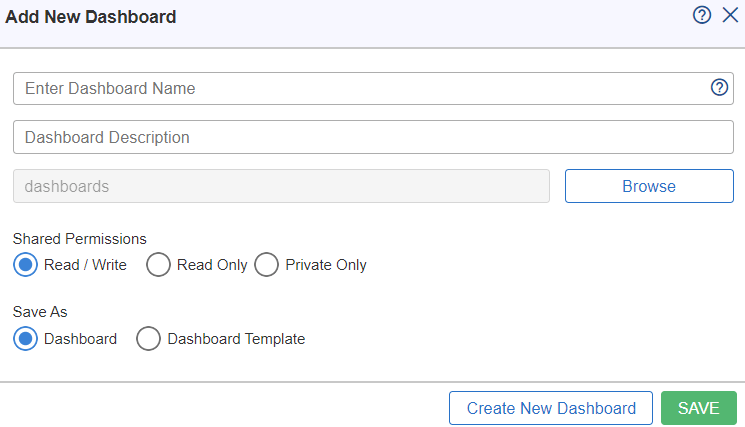
In the add new dashboard window, enter the dashboard name and description for the new dashboard, select the required shared permission option such as: Read/Write, Read Only and Private Only.
Note: You can also provide the path on which the new dashboard is to be added. To select the path, click on the Browse ![]() button.
button.
On clicking the browse button, the File Manager window will appear as shown in below Figure 143.
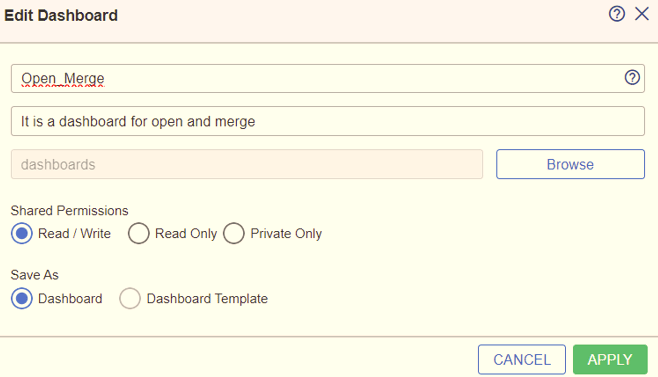
In the edit dashboard window, enter the dashboard name which you want to rename and provide the dashboard description.
Save Layout
In Save Layout, you can save the custom layouts by providing the layout name. On clicking the Save Layout option, the Save as Custom Layout dialog box will appear as shown in the below Figure 145

You have to enter the name for the layout in the Layout Name field, and then click on Save ![]() button. A success message is displayed at the top right corner of the window, as shown in below Figure 146.
button. A success message is displayed at the top right corner of the window, as shown in below Figure 146.

Note: When you try to save a layout with an existing name, an alert message is displayed stating Layout with same name is already available. Do you want to update? Click on OK ![]() button, to update the layout. If you don’t want to update the layout, then click on No
button, to update the layout. If you don’t want to update the layout, then click on No ![]() button.
button.
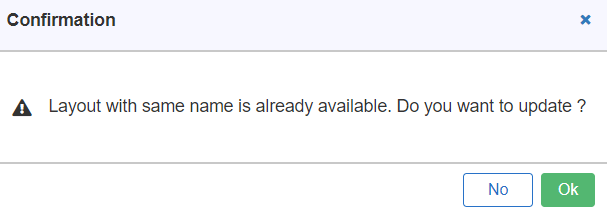
Note: To view the saved custom layout, go to Layout Manager > Custom.
