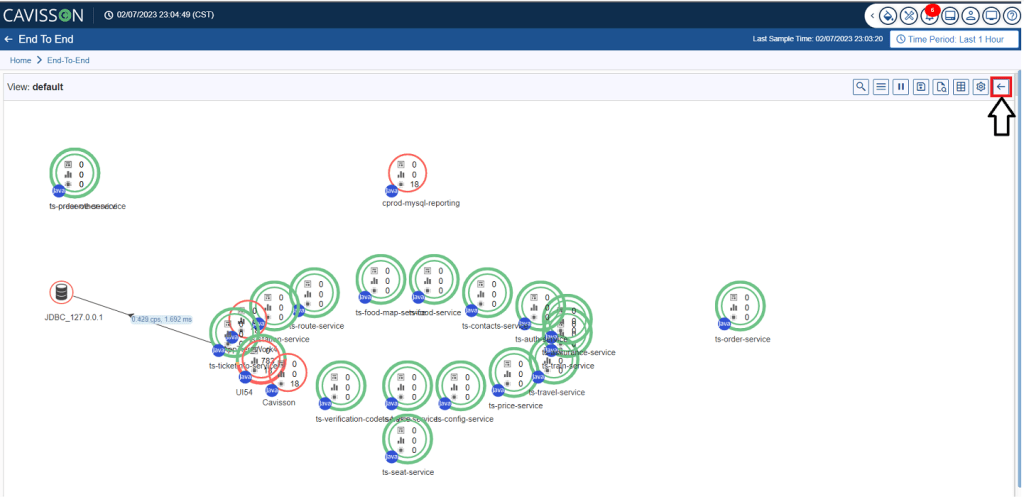
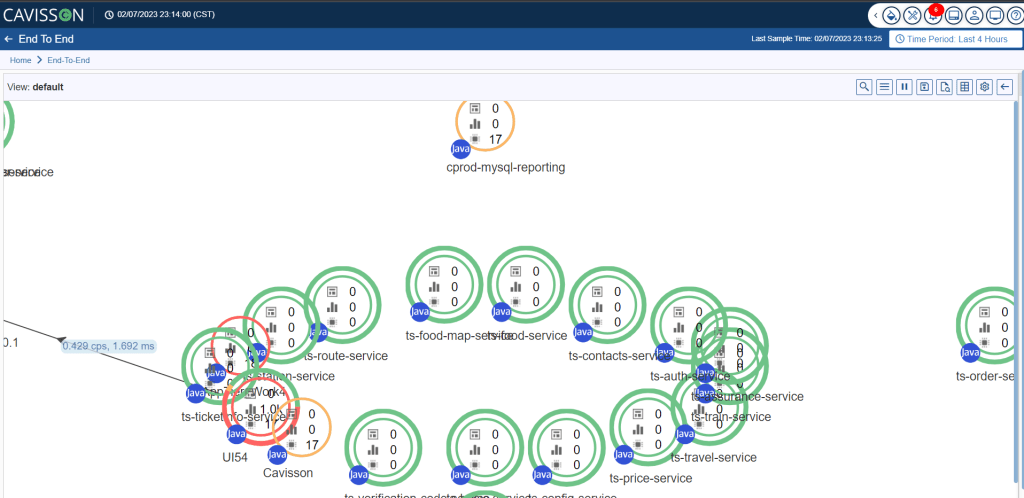
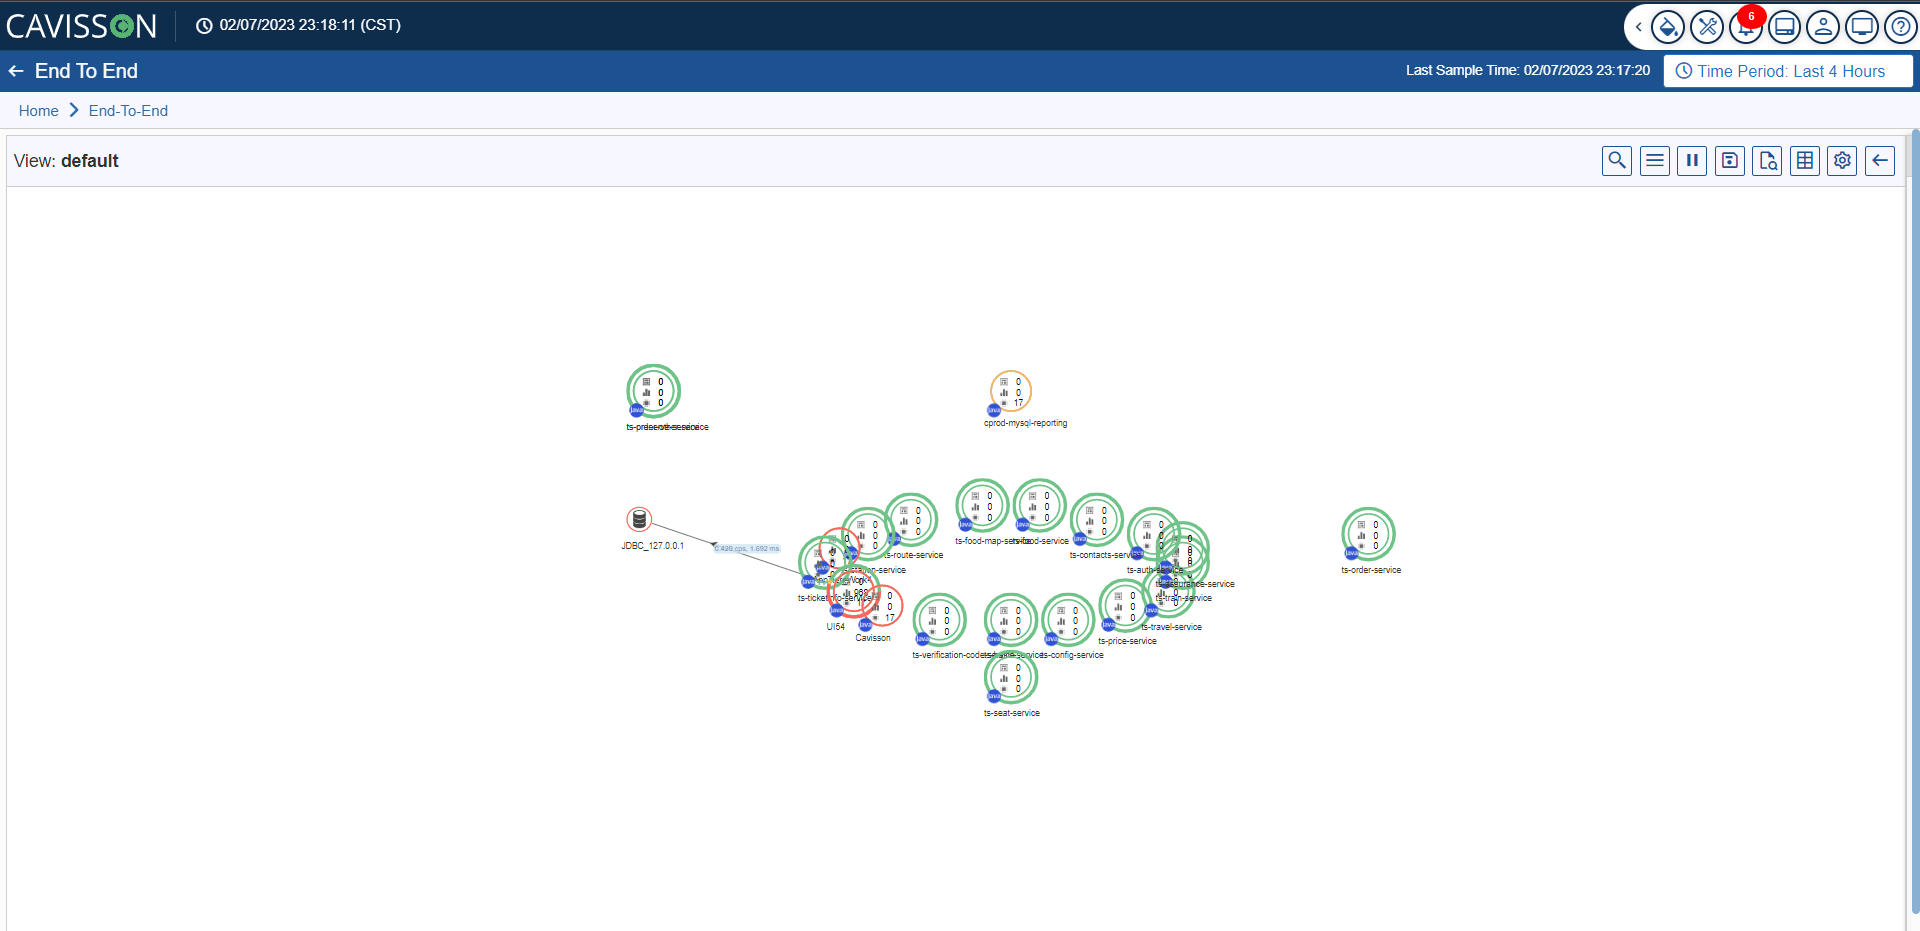
In flow map management, you can perform the following tasks:
- Search Node
- Edit View
- View the Default Flow Map view
- Save
- Pause/Start request
- Layout
- Grid View
- Flow Map Call Settings
- Maximize/Minimize the Flow Map View
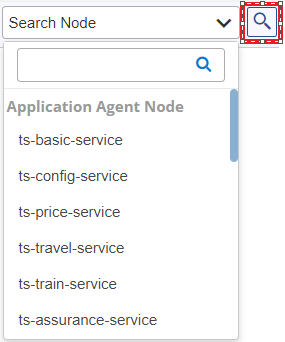
Search a Node
You can search for Tiers and IPs by clicking the Search Node ![]() icon. After searching, the searched Tier/IP is highlighted for 10 seconds, and then the highlight disappears.
icon. After searching, the searched Tier/IP is highlighted for 10 seconds, and then the highlight disappears.
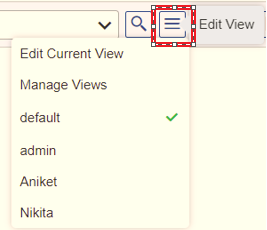
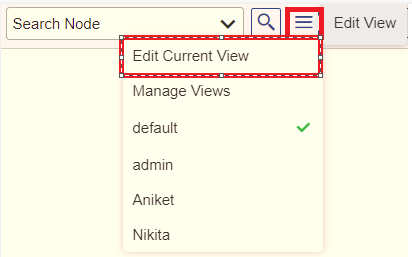
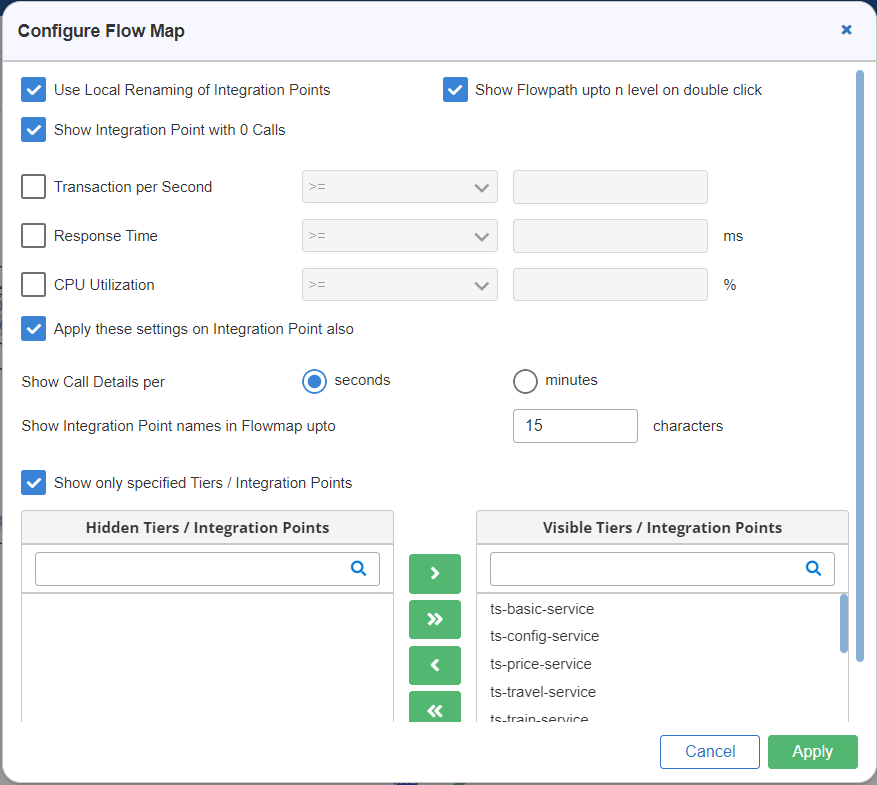
- This displays the Configure Flow Map window as shown in Figure 11.
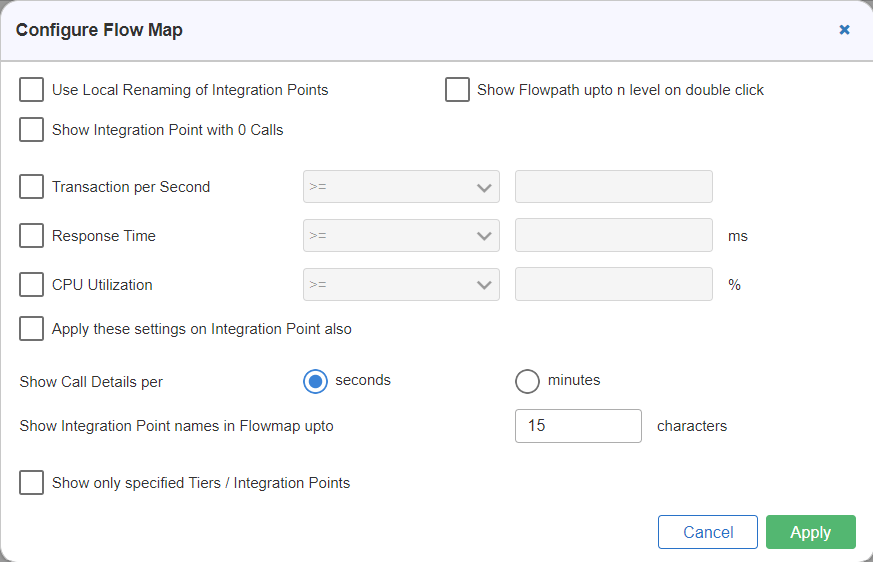
- Below is the description of each entry in the Configure Flow Map window:
- Use Local Renaming of Integration Points: If you have renamed any integration point then, on selecting this check box, the local renaming of the integration point is considered; else, the system considers the default name of the integration point.
- Show Integration Point with zero calls: On selecting this check box, the system also considers the integration points that execute no calls; otherwise, the system eliminates those integration points that constitute no calls.
- Show Flowpath up to n level on double click: On selecting this check box, you can double-click a tier to view all the connected tiers and the integration points up to ‘n’ level.
Note: In the case of shared flowmaps, when read only access is given to other users, the above three filters are disabled.
Value Filters
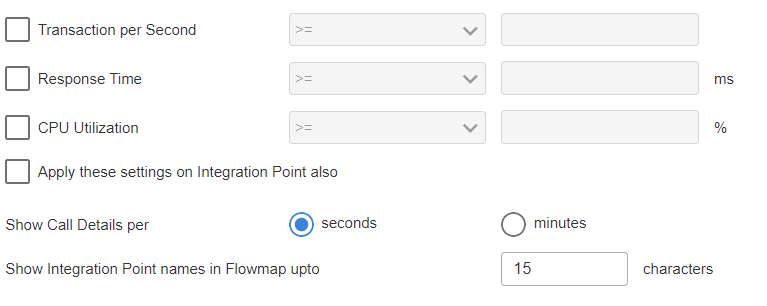
- Transaction per Second: On selecting this check box, you can filter the flow maps based on the number of transactions per second. First, select the option either greater than or equal to (>=) or smaller than or equal to (<=) and specify the value for which the filter needs to be applied.
- Response Time: On selecting this check box, you can filter the flow maps based on the response time of transactions. First, select the option either greater than or equal to (>=) or smaller than or equal to (<=) and specify the value (in milliseconds) for which the filter needs to be applied.
- CPU Utilization: On selecting this check box, you can filter the flow maps based on CPU utilization. First, select the option either greater than or equal to (>=) or smaller than or equal to (<=) and specify the value (in percentage) for which the filter needs to be applied.
Apply these settings on Integration Point also: To apply these settings (value filters) i.e., the Transactions per second filter, Response time filter, and CPU utilization on Integration Point also, select this check box.
Show Call Details: You can select show calls per second or minute.
Show Integration Point names in Flowmap upto characters: You can configure Integration Point character length. The default character length is 15.
Name Filters
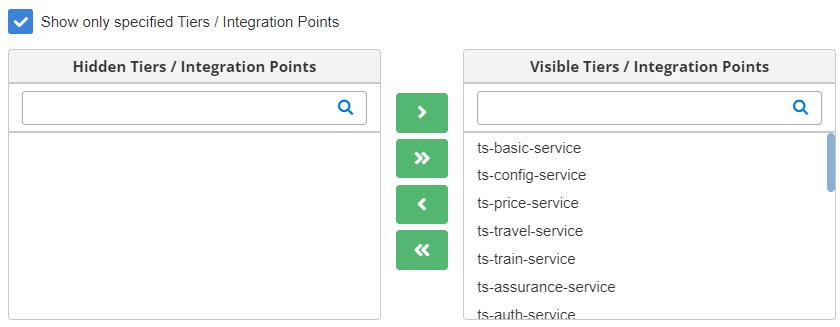
- Show only specified Tiers/Integration Points: This can also be termed as Name Filters, where you can apply filters based on the Tier/Integration Point names. On selecting this check box, two sections are displayed, one for Hidden Tiers/Integration Points and the other for Visible Tiers/Integration Points. You can move the tiers/integration points from one section to another by using the arrow buttons.
- If you select this check box and do not apply value filters, then the system displays all those tiers/integration points that are under the Visible Tiers/Integration Points
- If you apply value filters, then the system only considers the Tiers/Integration Points that are under the Visible Tiers/Integration Points The Tiers/Integration points that are under the Hidden Tiers/Integration Points section are not taken into consideration and hence are not displayed whether they are matched with the condition of value filters.
- After configuration, click the Apply
 The flowmap is displayed based on the configuration of the fields.
Example
In this example, we have performed the following tasks:
Input
- Select the Use Local Renaming of Integration Points check box.
- Select the Show Integration Point with 0 Calls check box.
- Apply the Transaction per second filter and it should be less than or equal to 3.
Select Apply these settings on Integration Point also check box as shown in Figure 14.
Output
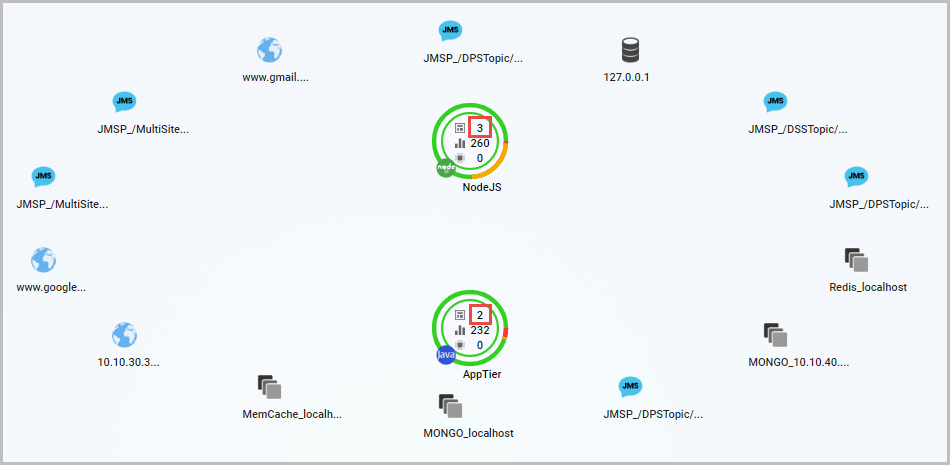
The output after the configuration of the application of the above filters will be as shown in Figure 15 . Here we can see that the system displays only those tiers whose transaction per second (TPS) is less than or equal to 3.
Manage Views
Manage Flow Map feature of Application End-to-End View is used for the following purposes:
- To set as default flow map.
- To make a flow map shareable with other owners.
- To remove a flow map.
To View the Manage Flow Map Window, follow the steps mentioned below:
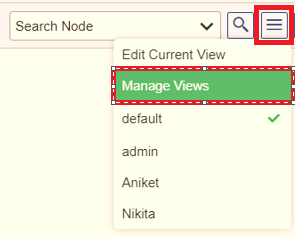
- Hover the mouse on the Edit View
 icon, and then click the Manage Views option as shown in Figure 16.
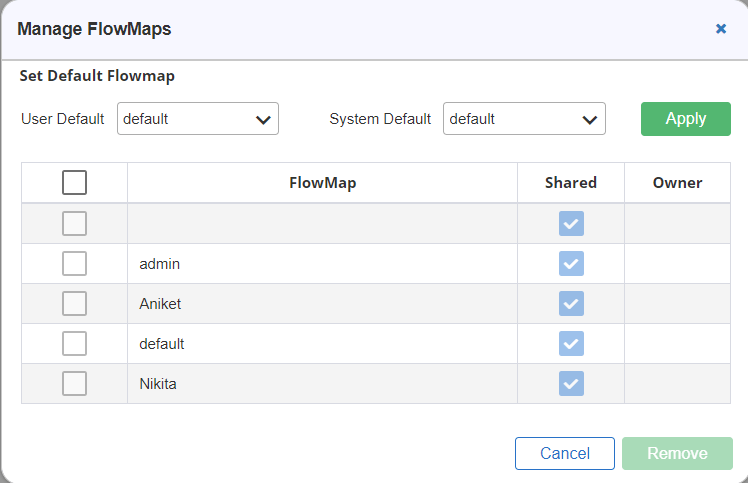
- The Manage Flowmaps window is displayed as shown in Figure 17.
To Set as Default Flow Map
Select the desired flow map from the Default Flowmap drop-down list and click Apply button.
To Make a Flow Map Shareable
Making a flow map shareable means that it can be viewed by other owners as well. To enable this, select the Shared check box corresponding to the flow map.
To Remove a Flow Map
To remove a flow map, select the flow map and click the Remove ![]() button, the flow map is removed from the list.
button, the flow map is removed from the list.
Default Flow Map
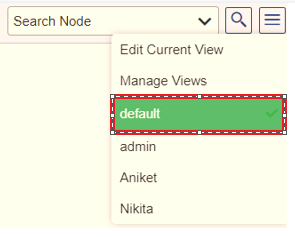
To load the default flow map, click on the Default option as shown in Figure 18. It is loaded by default at the time of accessing the application End-to-End View. You can also create a custom flow map and designate it as the default flow map.
Pause/Start Request
The details of the flow maps are refreshed automatically every 2 minutes which is the progress interval of the test run. You can also pause the auto-refresh of the flow map details by clicking the Pause button ![]() . Upon clicking, the auto-refresh feature of the flow map is disabled and the button appearance changes to
. Upon clicking, the auto-refresh feature of the flow map is disabled and the button appearance changes to ![]() . To start the auto-refresh feature, click the
. To start the auto-refresh feature, click the ![]() button.
button.
 |
Save
Here, you can save the current view or save it as a new view (just like Save as). You have the following options within this section as shown in Figure 19.


On clicking the save view option, the Save Default FlowMap window will appear. Click on the Save ![]() button to save the current view of the flowmap as shown in Figure 21.
button to save the current view of the flowmap as shown in Figure 21.

Save as New View
The Save as New View feature of Application End-to-End View creates an identical copy of the flow map. It works similarly to the Save As option of any application software, such as Microsoft Word, PPT, etc. To do this, follow the below-mentioned steps:
- Click the Save As New View option as shown in Figure 22.

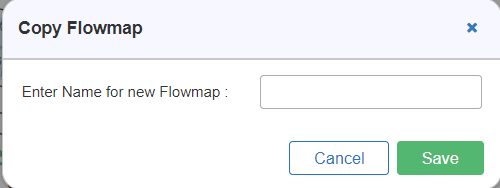
2. The Copy FlowMap window is displayed in Figure 23. Enter the name for the new flow map and click the Save This saves a copy of the flow map with the name provided in the box.
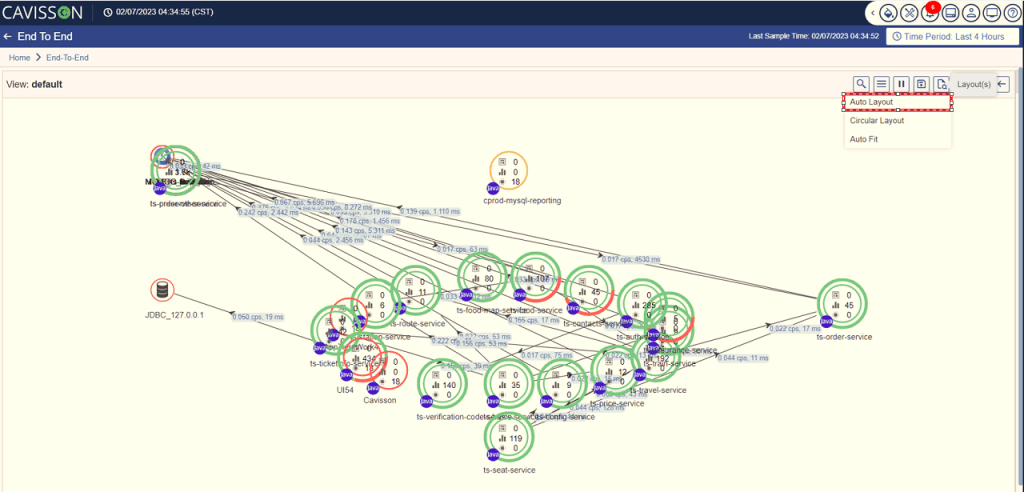
Auto Layout
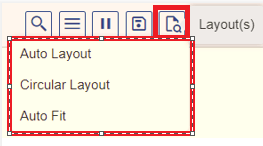
Auto layout arranges the tiers and integration points in the form of an ellipse. This layout creates two layers. The outer layer represents the integration points, and the inner layer represents the tiers. To execute the auto-layout feature, click the Auto Layout option as shown in Figure 25.
Example:
Auto Fit Layout
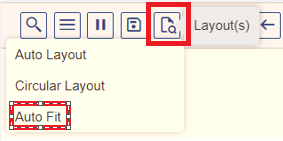
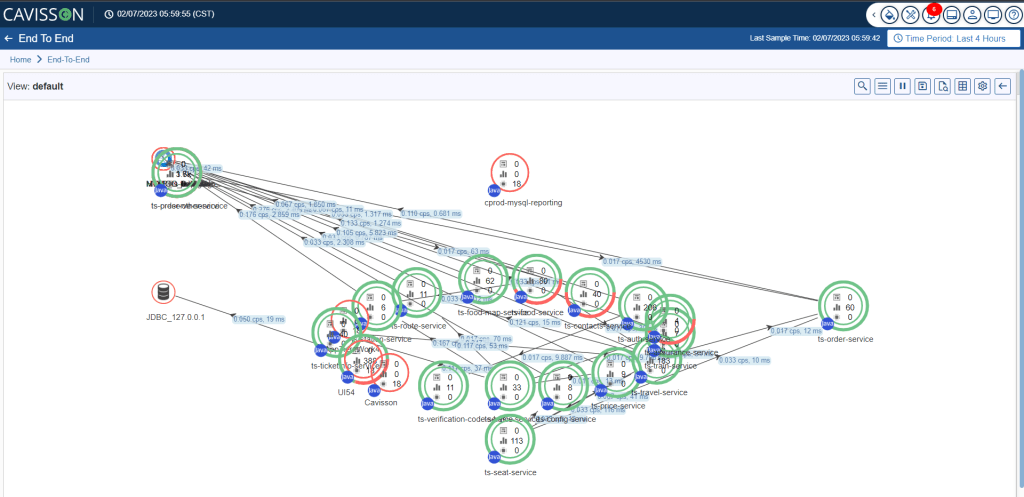
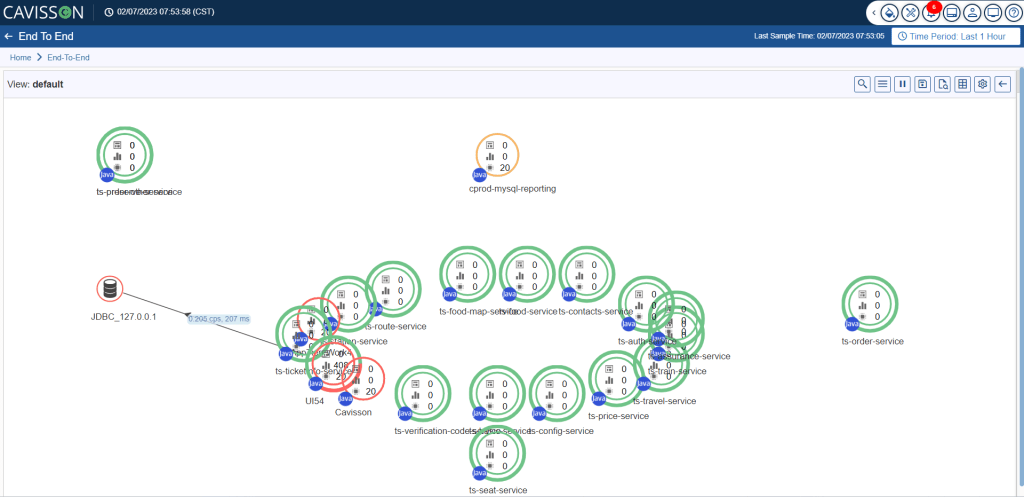
Auto Fit layout wraps the flow map entities, such as tiers and integration points, within the panel. This eliminates scrolling and arranges the entities in such a way that the flow map can be viewed in a single snapshot. You can implement the auto-fit layout by clicking the Auto Fit Layout option as shown in Figure 26.
Circular Layout
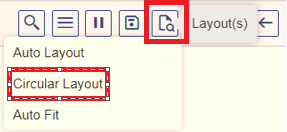
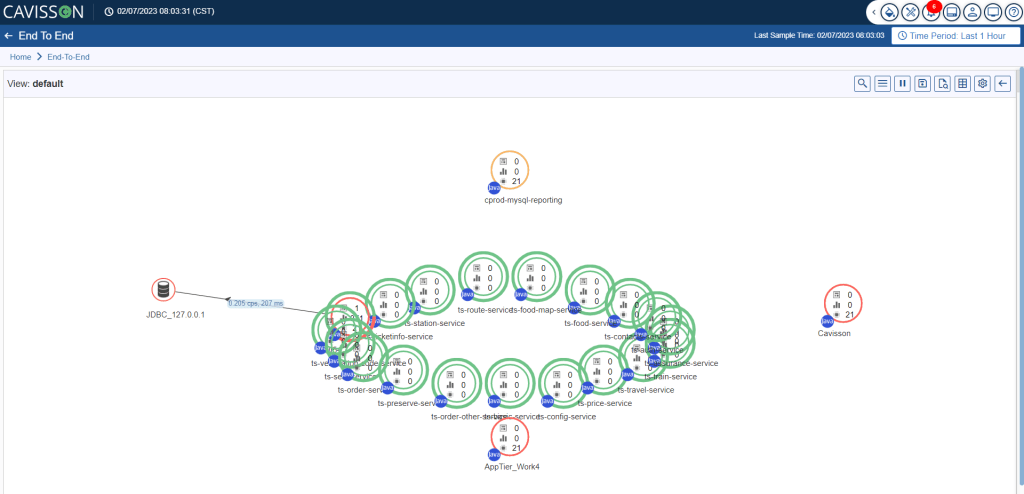
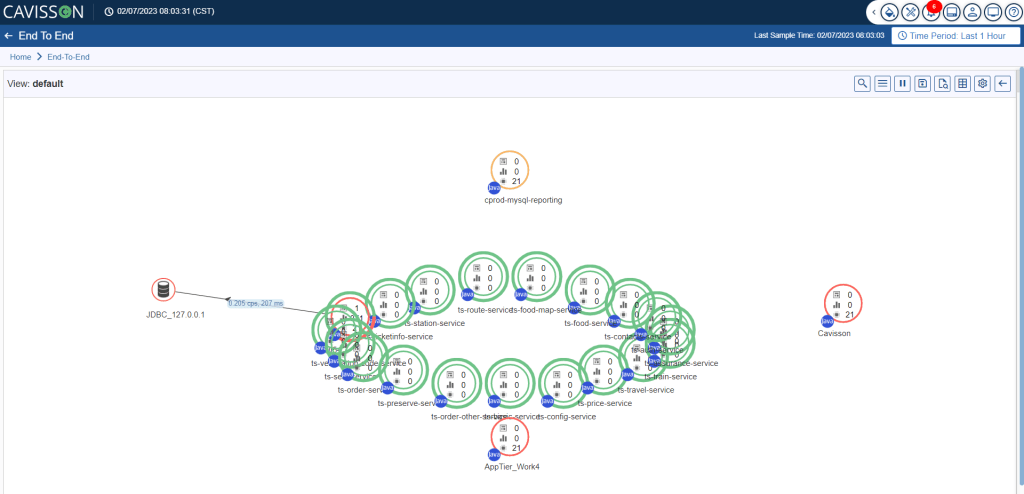
The Circular layout is similar to the auto-layout. The difference is in auto layout, two ellipses are created, one for tiers and the other for integration points. However, in a circular layout, only one ellipse is created and both tiers and integration points are represented in that ellipse. To change the layout to a circular layout, click the Circular Layout option as shown in Figure 29.
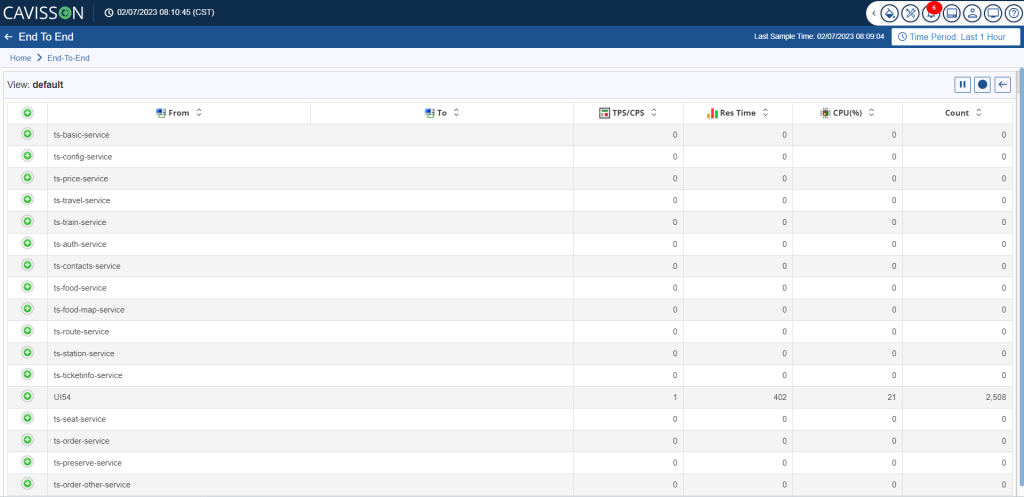
- By default, tier detail is displayed as shown in Figure 34. To view the integration point details to which the tier is connected, click the
 button. This expands the tier and displays the integration points.

The following information is displayed:
- From : This represents the tier from where the call is executed.
- To : This represents the integration point connected to the tier.
- TPS/CPS : This represents transactions per second/calls per second.
- Res Time : This represents the response time taken by the system.
- CPU (%) : This represents the usage of CPU in percentage.
- Count: This represents the total number of calls.
- To go back to the map view, click the FlowMap View button .
FlowMap Call Settings
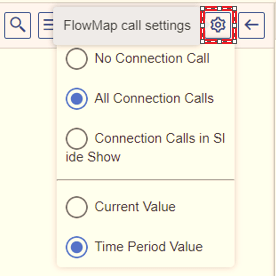
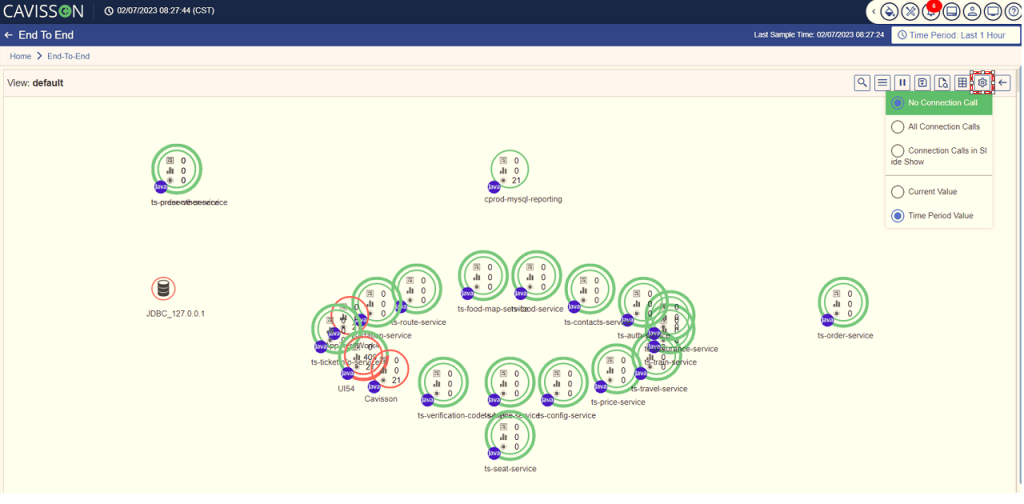
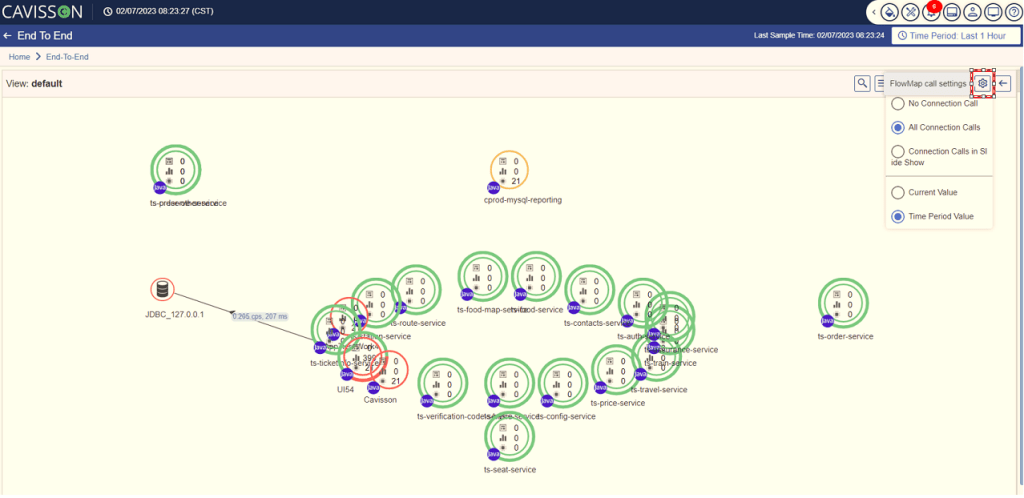
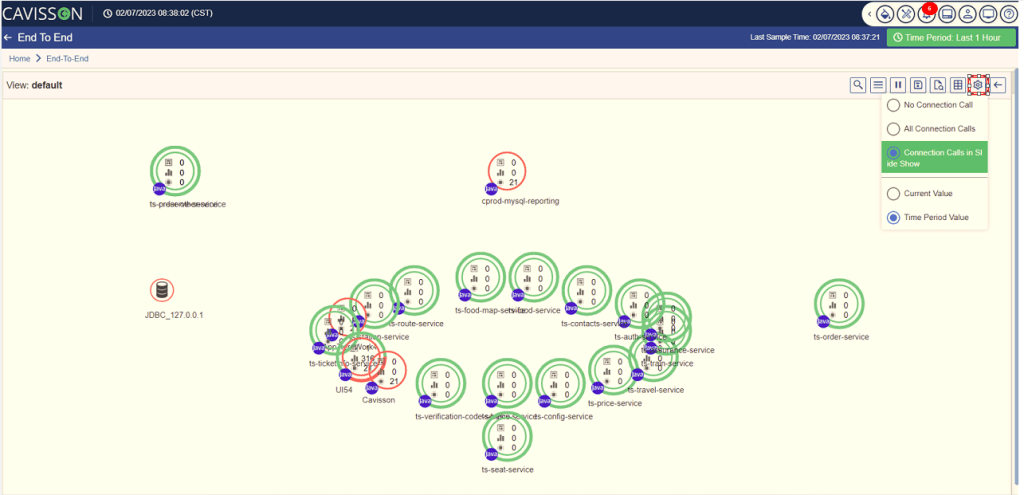
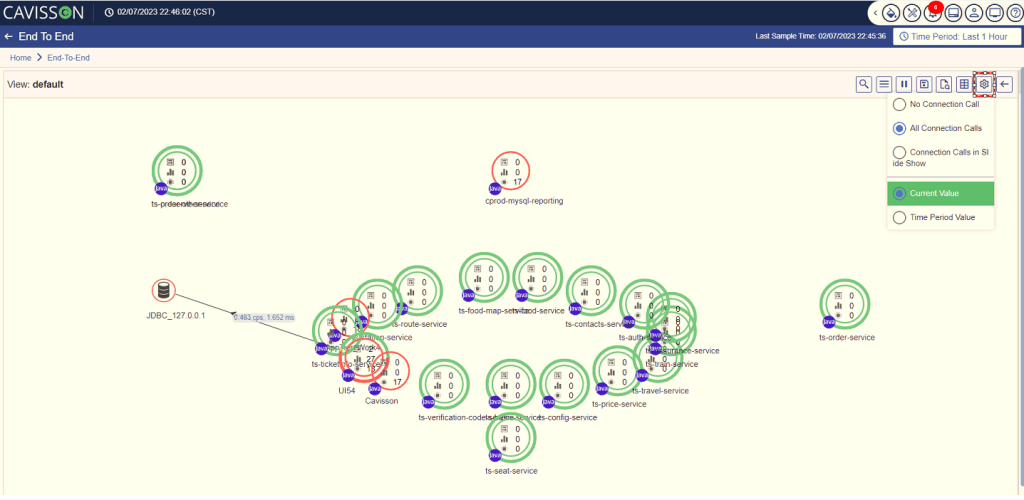
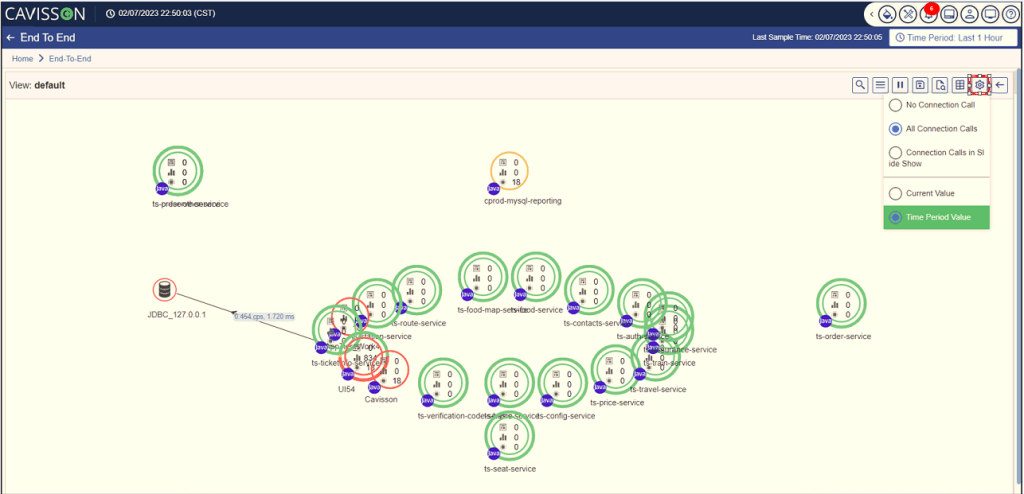
In this section, you can select the connection pattern and the view pattern. To view the settings with different options, click the Settings icon . The following pop-up box is displayed as shown in Figure 34.
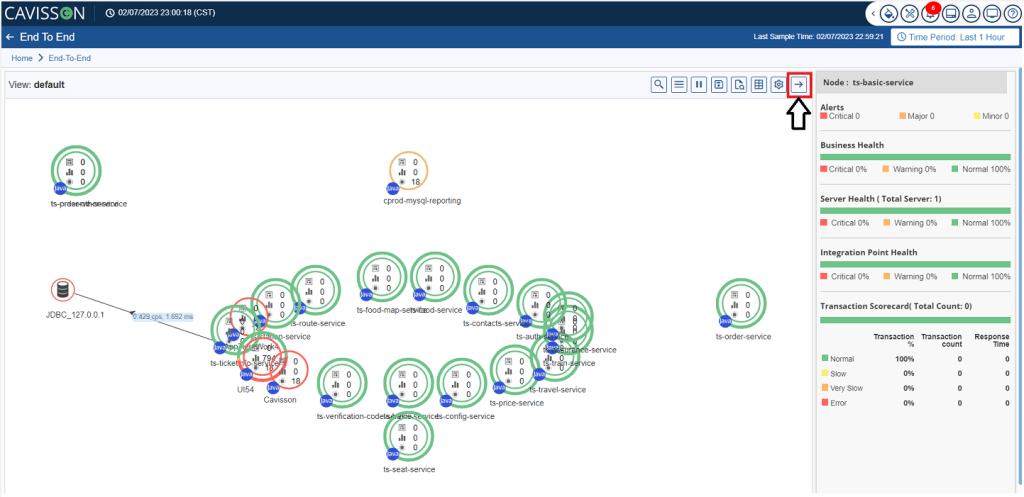
To restore it to the previous view, click the Minimize ![]() button as marked in Figure 41.
button as marked in Figure 41.
